

Abstract
There is limited evidence demonstrating the benefits of physical activity with regard to mortality risk or the harms associated with sedentary behavior in black adults, so we examined the relationships between these health behaviors and cause-specific mortality in a prospective study that had a large proportion of black adults. Participants (40–79 years of age) enrolled in the Southern Community Cohort Study between 2002 and 2009 (n = 63,308) were prospectively followed over 6.4 years, and 3,613 and 1,394 deaths occurred in blacks and whites, respectively. Black adults who reported the highest overall physical activity level (≥32.3 metabolic equivalent-hours/day vs. <9.7 metabolic equivalent-hours/day) had lower risks of death from all causes (hazard ratio (HR) = 0.76. 95% confidence interval (CI): 0.69, 0.85), cardiovascular disease (HR = 0.81, 95% CI: 0.67, 0.98), and cancer (HR = 0.76, 95% CI: 0.62, 0.94). In whites, a higher physical activity level was associated with a lower risk of death from all causes (HR = 0.76, 95% CI: 0.64, 0.90) and cardiovascular disease (HR = 0.69, 95% CI: 0.49, 0.99) but not cancer (HR = 0.95, 95% CI: 0.67, 1.34). Spending more time being sedentary (>12 hours/day vs. <5.76 hours/day) was associated with a 20%–25% increased risk of all-cause mortality in blacks and whites. Blacks who reported the most time spent being sedentary (≥10.5 hours/day) and lowest level of physical activity (<12.6 metabolic equivalent-hours/day) had a greater risk of death (HR = 1.47, 95% CI: 1.25, 1.71). Our study provides evidence that suggests that health promotion efforts to increase physical activity level and decrease sedentary time could help reduce mortality risk in black adults.
Keywords: blacks, cancer, exercise, prevention, sedentary behavior
Approximately 40 million black people live in the United States, with slightly more than 50% living in the southeastern portion of the country (1). Blacks face a number of health disparities compared with whites, including higher rates of death from cardiovascular disease (2) and cancer (3) and shorter life expectancies (74.5 years vs. 78.8 years, respectively) (4). For this reason, there is great interest in identifying behavioral factors that are amenable to intervention and that could improve the health of black adults. Increasing physical activity is a particularly attractive strategy because it is associated with a broad range of health benefits, including a greater longevity (5, 6) and lower risks of heart disease, stroke, hypertension, diabetes, and certain cancers (7). Daily amounts of physical activity have declined dramatically over the last 50 years in the United States, particularly as time spent in sedentary behavior (i.e., sitting or reclining) has increased (8, 9). The prevalence of leisure-time physical inactivity is greatest in the southeastern United States (10), the region of the United States that also has the highest black population (1), and yet it is unclear how these patterns of behavior may contribute to mortality risk among blacks in this region.
The health benefits of leisure-time physical activity are well known (7), and evidence of the adverse health effects of sedentary behavior is accumulating rapidly (11); however, empirical evidence demonstrating these associations in blacks in the United States is sparse. Only a limited number of studies that have investigated the association between physical activity level and death or cardiovascular outcomes for blacks (12–16), and most examined only leisure-time physical activity (exercise) (12–15) rather than household and occupational activity or overall activity. Only 2 studies have examined sedentary behavior as a risk factor for death in blacks (17, 18). Further, none of these studies have provided separate estimates of these associations for black men. Given the limited evidence available, empirical data examining the associations among overall physical activity level, sedentary behavior, and mortality rates in black adults is greatly needed (7).
Accordingly, we tested the hypotheses that overall physical activity level is inversely associated and sedentary behavior is positively associated with all-cause, cardiovascular, and cancer mortality in black adults participating in the Southern Community Cohort Study (SCCS) (19). We also estimated for the first time risk estimates for black men and the joint contributions of overall physical activity and sedentary behavior on mortality risk in black adults overall. The associations in white participants in the study were included for comparison to describe similarities or possible differences between races.
METHODS
Study design and participants
The SCCS is a prospective cohort study designed to assess disparities in the rates of chronic diseases among adults in urban and rural areas in 12 states in southeastern United States (Florida, Alabama, Mississippi, Louisiana, Arkansas, Tennessee, Georgia, South Carolina, North Carolina, Virginia, West Virginia, and Kentucky) (19). From 2002 to 2009, nearly 85,000 adults were enrolled in the cohort, most of whom (86%) enrolled at 1 of 71 participating community health centers that provide basic health services mainly to low-income and uninsured persons (20). An additional 14% of the cohort enrolled from 2004 to 2006 by responding to a mailed questionnaire sent to randomly selected residents of the same 12 states. The study was designed so that approximately two thirds of participants were black. Participants eligible for enrollment in the overall cohort were 40–79 years of age, spoke English, and had not been treated for cancer in the 12 months before enrollment. The SCCS was approved by the institutional review boards at Vanderbilt University and Meharry Medical College. All participants provided written informed consent.
Mortality ascertainment
For analysis of all-cause mortality, vital status was ascertained from the Social Security Administration and the National Death Index through December 31, 2011. Information on specific causes of death was ascertained via linkage to the National Death Index through December 31, 2011. Cause-specific categories of mortality were classified as cardiovascular disease (International Classification of Diseases, 10th Revision codes I00-I69), cancer (International Classification of Diseases, 10th Revision codes C00-C97), and other nonexternal causes, which excluded cardiovascular disease, cancer, and all International Classification of Diseases, 10th Revision codes beginning with S, T, V, W, X, and Y.
Assessment of physical activity level and sedentary behaviors
A wide range of “usual” amounts of physical activity and sedentary behavior performed at home, at work, and during leisure time were assessed. Physical activity level was assessed by asking about time typically spent performing light, moderate, and strenuous (vigorous) activities at home and at work, as well as time spent moderately and vigorously exercising/participating in sports. Time spent doing work and home activities was assessed separately for week and weekend days, and exercise and sports participation was assessed for a typical week. Overall physical activity level was estimated as the sum of home and work activity and exercise and sports participation. In addition to leisure-time activity and activities done at home and work, time spent walking slowly (moving around, walking at work, walking a dog, doing light exercise) and walking quickly (to go places, for exercise, climbing stairs) was also assessed and evaluated separately. Questions about sedentary behaviors asked about the amount of time per day typically spent sitting in a car or bus; sitting at work; sitting to view television or movies; sitting using a computer at home (e.g., checking e-mail, using the Internet, playing games); and doing other activities that involve sitting (e.g., eating meals, talking on the phone, reading, playing cards, or sewing). For all questions, participants provided open-ended duration responses (hours and minutes). We evaluated the reliability and validity of the SCCS physical activity questionnaire in 118 randomly selected SCCS participants and found the validity of the instrument to be comparable for blacks and whites (21).
For analysis, time spent in sedentary behaviors was summarized and reported in hours per day, whereas duration reports of active behaviors were converted to estimates of physical activity energy expenditure in metabolic equivalent (MET) hours per day using common MET values for the specific activities assessed using the Compendium of Physical Activities (22). Accumulating 1 MET-hour/day of energy expenditure from physical activity is achieved by participating in 0.5 hours of a light activity (2 METs per hour), 0.25 hours of moderate intensity activity (4 METs per hour), or 0.125 hours of a vigorous activity (8 METs per hour).
Covariate assessment
The baseline survey gathered information about a number of relevant covariates that were considered as potential confounders in the present analysis. These covariates included demographic factors (age, sex, race, educational level, annual household income, and marital status), occupational status, comorbid conditions (asthma, diabetes, hypertension, and high cholesterol), alcohol intake, smoking history, body size (height and weight), and sleep duration. Dietary intake was assessed using an 89-item food frequency questionnaire that was developed specifically for the typical diet in the southeastern United States and validated with respect to a number of nutrients (23, 24).
Development of the analytic cohort
Between March 2002 and September 2009, a total of 84,784 individuals enrolled in the SCCS. For this analysis, we excluded 4,130 participants (4.9%) who did not report their race as “white” or “black/African American.” To minimize problems with reverse causality, we excluded persons who reported heart disease (previous heart attack or bypass surgery; n = 5,535), cancers other than nonmelanoma skin cancer (n = 5,099), stroke (n = 5,150), Parkinson's disease (n = 130), lupus (n = 674), and multiple sclerosis (n = 255) at enrollment. We also excluded those with missing information on physical activity level (n = 2,498) and sedentary behaviors (n = 1,919). Our analytic cohort consisted of 63,308 participants (exclusion categories were not mutually exclusive).
Statistical analyses
Cox proportional hazards models were used to estimate hazard ratios and accompanying 95% confidence intervals for all-cause mortality separately among black and white participants in relation to quartiles of physical activity level and sedentary behavior among all participants at cohort entry. Age was used as the underlying time metric. Our a priori analysis plan included examination of risk among blacks and whites separately. We also evaluated effect modification formally by conducting likelihood ratio tests for models for each primary behavior exposure and each cause of death with and without race-behavior interaction terms.
Covariates included in all models were source of enrollment (community health centers or general population), educational level (<9 years, 9–11 years, high school, some college, or beyond college), household income (<$15,000, $15,000–$24,999, $25,000–$49,999, or ≥$50,000), cigarette smoking (never; former, <1 pack/day; former, ≥1 pack/day; current, <1 pack/day; or current, ≥1 pack/day), body mass index (BMI, measured as weight (kg)/height (m)2; <18.5, 18.5–24.9, 25–29.9, 30.0–34.9, or ≥35.0), and sleep duration (<7, 7–8, or ≥9 hours/day). A number of other factors were also evaluated as potential confounders of the physical activity–all-cause mortality association using a backwards model-building procedure with a greater than 10% change-in-estimate criterion for retention in the final model. We examined dietary factors that included intakes of energy, macronutrients, specific fats (saturated, polyunsaturated, and monounsaturated), and alcohol. Other factors were marital status, working status, and diagnosis of diabetes, hypertension, high cholesterol, or asthma as reported at baseline. Of these, only diabetes (yes or no) and employment status (yes or no) were retained in the final models. To investigate the potential that preexisting disease near the time of enrollment would bias our results, we also conducted sensitivity analyses in which participants with less than 1 year of follow-up were excluded. Analyses were conducted using SAS/STAT software, version 9.3 (SAS Institute, Inc., Cary, North Carolina), and all tests were 2-sided.
RESULTS
Characteristics of the cohort by quartiles of physical activity level and sedentary behavior are presented in Table 1. Approximately 70% of cohort members were black and more than two thirds reported a household income less than $25,000 and no more than a high school education. Just over half of the cohort was female (Table 1). Overall physical activity level was significantly associated with age, BMI, energy and macronutrient intakes, race, sex, source of enrollment, educational level, income, smoking status, employment status, marital status, alcohol consumption, sleep time, and prevalent asthma, diabetes, hypertension, and high cholesterol. More time spent in being sedentary also was significantly associated with each of these factors except prevalent hypertension and diabetes.
Table 1.
Characteristics of Participants by Overall Physical Activity Level and Sedentary Behaviors, Southern Community Cohort Study, 2002–2011
| Characteristic | Overall Physical Activity, MET-hours/week |
Overall Sedentary Behavior, hours/day |
||||||||||||||
|---|---|---|---|---|---|---|---|---|---|---|---|---|---|---|---|---|
| <9.73 (n = 15,801) |
9.74–18.60 (n = 15,877) |
18.61–32.31 (n = 15,798) |
≥32.32 (n = 15,832) |
<5.76 (n = 16,067) |
5.77–8.50 (n = 16,536) |
8.51–12.00 (n = 15,869) |
>12.00 (n = 15,832) |
|||||||||
| Mean (SE) | % | Mean (SE) | % | Mean (SE) | % | Mean (SE) | % | Mean (SE) | % | Mean (SE) | % | Mean (SE) | % | Mean (SE) | % | |
| Age at baseline, years | 53.1 (9.0) | 52.4 (8.8) | 50.9 (8.2) | 48.8 (6.9) | 52.0 (8.9) | 51.9 (8.8) | 51.2 (8.3) | 49.9 (7.5) | ||||||||
| BMIa | 30.7 (8.1) | 30.8 (7.8) | 30.4 (7.4) | 28.9 (6.7) | 29.4 (7.1) | 29.9 (7.3) | 30.5 (7.7) | 31.1 (8.1) | ||||||||
| Total energy intake, kcal/day | 2,412 (1,379) | 2,402 (1,347) | 2,537 (1,406) | 3,015 (1,622) | 2,498 (1,442) | 2,532 (1,429) | 2,575 (1,442) | 2,766 (1,527) | ||||||||
| Total fat intake, g/day | 91.0 (56.1) | 91.7 (55.5) | 97.2 (58.2) | 114.4 (66.7) | 93.6 (58.3) | 95.9 (58.2) | 98.5 (59.4) | 106.6 (63.4) | ||||||||
| Total saturated fat intake, g/day | 27.5 (17.3) | 27.6 (17.1) | 29.2 (17.9) | 34.5 (20.5) | 28.2 (18.0) | 28.8 (17.9) | 29.7 (18.3) | 32.2 (19.6) | ||||||||
| Total protein intake, g/day | 90.1 (55.2) | 90.7 (54.1) | 95.9 (56.7) | 112.2 (65.2) | 93.2 (57.1) | 94.7 (56.2) | 97.1 (58.0) | 104.3 (62.7) | ||||||||
| Total carbohydrate intake, g/day | 288 (159) | 290 (157) | 304 (162) | 351 (183) | 300 (166) | 303 (164) | 306 (165) | 324 (174) | ||||||||
| Sex | ||||||||||||||||
| Male | 44.5 | 32.6 | 33.8 | 54.7 | 42.4 | 42.2 | 40.3 | 40.6 | ||||||||
| Female | 55.5 | 67.4 | 66.2 | 45.3 | 57.6 | 57.8 | 59.7 | 59.4 | ||||||||
| Race | ||||||||||||||||
| White | 29.9 | 30.0 | 29.6 | 26.9 | 29.9 | 31.4 | 30.4 | 24.3 | ||||||||
| Black | 70.1 | 70.0 | 70.4 | 73.1 | 70.1 | 68.6 | 69.6 | 75.7 | ||||||||
| Source of enrollment | ||||||||||||||||
| Community health center | 90.3 | 86.8 | 86.7 | 89.4 | 92.2 | 89.5 | 86.5 | 84.7 | ||||||||
| General population | 9.7 | 13.2 | 13.3 | 10.6 | 7.9 | 10.5 | 13.5 | 15.3 | ||||||||
| Educational level | ||||||||||||||||
| <9 years | 11.4 | 7.2 | 5.3 | 4.4 | 10.4 | 7.0 | 5.8 | 4.8 | ||||||||
| 9–11 years | 24.0 | 19.9 | 18.5 | 20.9 | 25.0 | 21.6 | 18.8 | 17.6 | ||||||||
| High school | 36.7 | 37.5 | 39.6 | 44.5 | 40.6 | 41.0 | 38.4 | 38.2 | ||||||||
| Some college | 16.6 | 19.5 | 21.3 | 20.9 | 15.5 | 18.1 | 21.0 | 24.0 | ||||||||
| ≥College | 11.4 | 16.0 | 15.3 | 9.3 | 8.6 | 12.2 | 16.0 | 15.5 | ||||||||
| Income | ||||||||||||||||
| <$15,000 | 67.0 | 54.3 | 47.5 | 48.8 | 62.5 | 55.3 | 50.5 | 48.8 | ||||||||
| $15,000–$24,999 | 16.6 | 19.8 | 23.8 | 27.0 | 20.4 | 22.3 | 21.9 | 22.8 | ||||||||
| $25,000–$49,999 | 9.6 | 14.3 | 16.5 | 16.2 | 11.1 | 13.6 | 15.2 | 17.0 | ||||||||
| ≥$50,000 | 6.8 | 11.6 | 12.2 | 8.0 | 6.1 | 8.8 | 12.4 | 11.4 | ||||||||
| Smoking status | ||||||||||||||||
| Never | 35.2 | 40.3 | 41.0 | 32.2 | 38.0 | 36.9 | 38.3 | 35.5 | ||||||||
| Former, <1 pack/day | 11.3 | 12.6 | 12.3 | 9.9 | 11.5 | 11.7 | 11.8 | 11.1 | ||||||||
| Former, ≥1 pack/day | 11.0 | 9.3 | 8.8 | 7.2 | 8.4 | 9.4 | 9.5 | 9.1 | ||||||||
| Current, <1 pack/day | 26.8 | 24.9 | 25.9 | 33.4 | 28.0 | 27.6 | 26.7 | 28.8 | ||||||||
| Current, ≥1 pack/day | 15.7 | 12.9 | 12.0 | 17.2 | 14.1 | 14.5 | 13.7 | 15.6 | ||||||||
| Currently working | ||||||||||||||||
| Yes | 20.1 | 36.7 | 51.8 | 63.2 | 38.4 | 39.4 | 44.8 | 50.1 | ||||||||
| No | 80.0 | 63.3 | 48.3 | 36.8 | 61.6 | 60.6 | 55.2 | 49.9 | ||||||||
| Marital status | ||||||||||||||||
| Married | 29.6 | 36.1 | 37.8 | 34.6 | 32.8 | 34.8 | 36.1 | 34.4 | ||||||||
| Divorced | 34.8 | 31.9 | 32.1 | 34.3 | 32.7 | 32.6 | 33.6 | 34.2 | ||||||||
| Widowed | 11.2 | 10.4 | 8.3 | 5.1 | 9.9 | 9.8 | 8.2 | 7.0 | ||||||||
| Single | 24.4 | 21.7 | 21.8 | 25.9 | 24.6 | 22.8 | 22.1 | 24.4 | ||||||||
| Alcohol consumption | ||||||||||||||||
| None | 49.2 | 47.5 | 44.7 | 35.1 | 48.1 | 44.6 | 42.6 | 40.8 | ||||||||
| <1 drink/day | 29.9 | 33.2 | 34.6 | 32.3 | 29.3 | 32.3 | 34.5 | 34.0 | ||||||||
| ≥1 drinks/day | 21.0 | 19.3 | 20.7 | 32.6 | 22.5 | 23.1 | 22.9 | 25.2 | ||||||||
| Sleep time, hours/day | ||||||||||||||||
| <7 | 40.0 | 38.1 | 39.9 | 43.0 | 41.2 | 39.1 | 39.9 | 40.9 | ||||||||
| 7–8 | 43.3 | 47.8 | 47.4 | 44.0 | 46.2 | 48.2 | 45.7 | 42.1 | ||||||||
| ≥9 | 16.7 | 14.1 | 12.7 | 13.1 | 12.6 | 12.8 | 14.5 | 17.0 | ||||||||
| Asthma | ||||||||||||||||
| Yes | 15.3 | 14.0 | 12.9 | 11.9 | 12.5 | 13.1 | 14.1 | 14.5 | ||||||||
| No | 84.7 | 86.0 | 87.1 | 88.2 | 87.5 | 86.9 | 85.9 | 85.5 | ||||||||
| Diabetes | ||||||||||||||||
| Yes | 23.8 | 20.8 | 17.5 | 12.4 | 18.0 | 18.8 | 18.8 | 18.9 | ||||||||
| No | 76.2 | 79.3 | 82.5 | 87.6 | 82.0 | 81.2 | 81.2 | 81.1 | ||||||||
| Hypertension | ||||||||||||||||
| Yes | 59.2 | 55.2 | 50.8 | 43.1 | 51.7 | 52.5 | 51.8 | 52.2 | ||||||||
| No | 40.8 | 44.8 | 49.2 | 56.9 | 48.3 | 47.5 | 48.2 | 47.8 | ||||||||
| High cholesterol | ||||||||||||||||
| Yes | 33.4 | 33.1 | 29.3 | 22.0 | 28.4 | 30.5 | 30.2 | 28.7 | ||||||||
| No | 66.6 | 66.9 | 70.7 | 78.0 | 71.6 | 69.5 | 69.9 | 71.3 | ||||||||
Abbreviations: BMI, body mass index; MET, metabolic equivalent; SE, standard error.
a Weight (kg)/height (m)2.
Mortality follow-up
During an average of 6.4 (standard deviation, 2.1) years of follow-up, there were 3,613 deaths in blacks and 1,394 deaths in whites. Cancer and heart disease were the leading causes of death among both blacks and whites. Among blacks, the other leading causes of death were human immunodeficiency virus/acquired immunodeficiency syndrome, diabetes, and cerebrovascular disease. Among whites, the other leading causes of death were chronic lower respiratory diseases, diabetes, and liver disease.
Mortality in relation to overall physical activity level
A higher level of overall physical activity was associated with lower risks of all-cause, cardiovascular, and cancer mortality in blacks after adjustment for sex, BMI, overall sedentary behavior, and other covariates (Table 2). The most active blacks (≥32.32 MET-hours/day) had a 24% lower risk of death from all causes (HR = 0.76, 95% confidence interval (CI): 0.69, 0.85), a 19% lower risk of death from cardiovascular disease (HR = 0.81, 95% CI: 0.67, 0.98), and a 24% lower risk of death from cancer (HR = 0.76, 95% CI: 0.62, 0.94) compared with the least active blacks (<9.73 MET-hours/day). The inverse trends were monotonic for all-cause mortality but not cardiovascular or cancer mortality. Significantly lower risk was evident for all outcomes in persons who reported at least 9.73–18.60 MET-hours/day of overall physical activity (second quartile).
Table 2.
Association Between Overall Physical Activity Level and Cause-Specific Mortality in Black and White Adults, Southern Community Cohort Study, 2002–2011
| Model by Cause of Death | Overall Physical Activity Level, MET-hours/day |
P Value | |||||||||||
|---|---|---|---|---|---|---|---|---|---|---|---|---|---|
| <9.73 |
9.74–18.60 |
18.61–32.31 |
≥32.32 |
||||||||||
| No. of Deaths | HR | 95% CI | No. of Deaths | HR | 95% CI | No. of Deaths | HR | 95% CI | No. of Deaths | HR | 95% CI | ||
| Blacks | |||||||||||||
| All causes | |||||||||||||
| Model 1a | 1,325 | 1.00 | Referent | 881 | 0.87 | 0.79, 0.95 | 705 | 0.81 | 0.74, 0.90 | 702 | 0.77 | 0.70, 0.86 | <0.0001 |
| Model 2b | 1,325 | 1.00 | Referent | 881 | 0.86 | 0.78, 0.94 | 705 | 0.80 | 0.73, 0.89 | 702 | 0.76 | 0.69, 0.85 | <0.0001 |
| Cardiovascular disease | |||||||||||||
| Model 1a | 389 | 1.00 | Referent | 238 | 0.80 | 0.68, 0.95 | 207 | 0.83 | 0.70, 1.00 | 206 | 0.81 | 0.67, 0.99 | 0.06 |
| Model 2b | 389 | 1.00 | Referent | 238 | 0.80 | 0.68, 0.94 | 207 | 0.83 | 0.69, 0.99 | 0.81 | 0.67, 0.98 | 0.05 | |
| Cancer | |||||||||||||
| Model 1a | 328 | 1.00 | Referent | 219 | 0.82 | 0.68, 0.98 | 179 | 0.80 | 0.65, 0.97 | 179 | 0.77 | 0.63, 0.94 | 0.005 |
| Model 2b | 328 | 1.00 | Referent | 219 | 0.81 | 0.68, 0.97 | 179 | 0.79 | 0.65, 0.96 | 179 | 0.76 | 0.62, 0.94 | 0.004 |
| Whites | |||||||||||||
| All causes | |||||||||||||
| Model 1a | 536 | 1.00 | Referent | 342 | 0.87 | 0.76, 1.01 | 277 | 0.85 | 0.73, 1.00 | 239 | 0.75 | 0.64, 0.89 | 0.01 |
| Model 2 | 536 | 1.00 | Referent | 342 | 0.87 | 0.76, 1.01 | 277 | 0.86 | 0.73, 1.00 | 239 | 0.76 | 0.64, 0.90 | 0.02 |
| Cardiovascular disease | |||||||||||||
| Model 1a | 135 | 1.00 | Referent | 81 | 0.83 | 0.62, 1.10 | 71 | 0.90 | 0.66, 1.22 | 49 | 0.68 | 0.48, 0.97 | 0.12 |
| Model 2b | 135 | 1.00 | Referent | 81 | 0.82 | 0.61, 1.09 | 71 | 0.90 | 0.67, 1.23 | 49 | 0.69 | 0.49, 0.99 | 0.14 |
| Cancer | |||||||||||||
| Model 1a | 115 | 1.00 | Referent | 84 | 0.94 | 0.70, 1.26 | 62 | 0.82 | 0.59, 1.14 | 61 | 0.95 | 0.67, 1.34 | 0.97 |
| Model 2b | 115 | 1.00 | Referent | 84 | 0.95 | 0.70, 1.27 | 62 | 0.82 | 0.59, 1.15 | 61 | 0.95 | 0.67, 1.34 | 0.97 |
Abbreviations: CI, confidence interval; HR, hazard ratio; MET, metabolic equivalent.
a Model 1 was adjusted for sex, source of enrollment (community health center or general population), educational level (<9 years, 9–11 years, high school, some college, or beyond college), household income (<$15,000, $15,000–$24,999, $25,000–$49,999, or ≥$50,000), cigarette smoking (never; former, <1 pack/day; former, ≥1 pack/day; current, <1 pack/day; or current, ≥1 pack/day), body mass index (weight (kg)/height (m)2; <18.5, 18.5–24.9, 25–29.9, 30.0–34.9, or ≥35.0), sleep duration (<7, 7–8, or ≥9 hours/day), diabetes (yes or no), and employment status (yes or no).
b Model 2 was adjusted for the covariates in model 1 and overall sedentary behavior (quartiles).
Detailed analyses revealed some variation in the physical activity-mortality associations by sex in blacks. For all-cause mortality, the strength of association was similar in men (HR = 0.74, 95% CI: 0.65, 0.84) and women (HR = 0.83, 95% CI: 0.69, 0.9) when comparing the most active persons to the least active (≥32.32 MET-hours/day vs. <9.73 MET-hours/day). However, somewhat stronger associations were noted for the most active black men for cardiovascular (HR = 0.71, 95% CI: 0.56, 0.90) and cancer (HR = 0.76, 95% CI: 0.59, 0.99) mortality. The relation between physical activity level and these outcomes was less clear among black women (Web Table 1, available at http://aje.oxfordjournals.org/). Compared with white adults who reported the least physical activity, those who reported the most physical activity (≥32.32 MET-hours/day vs. <9.73 MET-hours/day) had a 24% reduction in the risk of all-cause mortality (HR = 0.76, 95% CI: 0.64, 0.90) and a 31% reduction in the risk of cardiovascular mortality (HR = 0.69, 95% CI: 0.49, 0.99); however, there was no association with cancer mortality (Table 2).
We also examined all-cause mortality in relation to moderate-vigorous sports and exercise participation (not including walking for exercise) and daily walking. There was no association between exercise and sports participation (≥15 MET-hours/week vs. 0 MET-hours/week) and all-cause mortality, with hazard ratios near 1.0 for blacks (HR = 0.99, 95% CI: 0.89, 1.09) and whites (HR = 0.99, 95% CI: 0.84, 1.17). Walking fast “to go places or for exercise” was inversely associated with all-cause mortality for black men (HR = 0.78, 95% CI: 0.70, 0.86) and black women (HR = 0.78, 95% CI: 0.68, 0.88) (Figure 1). There was no association between fast walking and all-cause mortality among whites, and slow walking was not associated with mortality in either group (Figure 1).
Figure 1.

Association between slow and fast walking (metabolic equivalent (MET)-hours/day) and all-cause mortality in blacks and whites, Southern Community Cohort Study, 2002–2011. A) Slow walking in blacks (Ptrend = 0.47); B) fast walking in blacks (Ptrend < 0.01); C) slow walking in whites (Ptrend = 0.26); and D) fast walking in whites (Ptrend = 0.30). The model was adjusted for sex, source of enrollment (community health center or general population), educational level (<9 years, 9–11 years, high school, some college, or beyond college), household income (<$15,000, $15,000–$24,999, $25,000–$49,999, or ≥$50,000), cigarette smoking (never; former, <1 pack/day; former, ≥1 pack/day; current, <1 pack/day; or current, ≥1 pack/day), body mass index (weight (kg)/height (m)2; <18.5, 18.5–24.9, 25–29.9, 30.0–34.9, or ≥35.0), sleep duration (<7, 7–8, or ≥9 hours/day), diabetes (yes or no), employment status (yes or no), sedentary behavior (hours/day), and other types of physical activity (MET-hours/day). Examples of slow walking included “moving around, walking at work, walking the dog, or for light exercise.” Examples of fast walking included “climbing stairs, walking fast to go places, or for exercise.” Bars, 95% confidence intervals.
Mortality in relation to sedentary behavior
More overall time spent being sedentary was associated with a greater risk of death from all causes in both blacks and whites after adjustment for sex, BMI, overall physical activity level, and other covariates (Table 3). Adjustment for physical activity level in models describing the sedentary behavior-mortality associations had little effect on the results (i.e., comparing results between models 1 and 2; Table 3). Black adults who reported the most sedentary behavior compared with those who reported the least (>12 hours/day vs. <5.76 hours/day) had a 19% greater risk of all-cause mortality (HR = 1.19, 95% CI: 1.08, 1.32), and white adults who reported the most sedentary behavior had a 24% greater risk (HR = 1.24, 95% CI: 1.06, 1.47). Detailed analysis among black participants suggested that the association with all-cause mortality was stronger in women (HR = 1.27, 95% CI: 1.09, 1.48) than in men (HR = 1.13, 95% CI: 0.99, 1.28) (Web Figure 1), but there was little evidence of association for overall sedentary behavior and cardiovascular mortality in black men or black women (Figure 2). Among white participants, we observed a strong positive association between time spent being sedentary and the risk of cardiovascular mortality only in men (for >12 hours/day vs. <5.76 hours/day, HR = 2.18, 95% CI: 1.34, 3.54; Figure 2). The interaction by race in men was statistically significant (P = 0.01). Sedentary behavior was not associated with death from cancer in blacks or whites (Table 3, Web Figure 2). Except for the interaction by race of cardiovascular disease mortality and sedentary behavior in men, no other significant interactions with race were observed (P > 0.2) for physical activity level or sedentary behavior and any other outcomes in men or women.
Table 3.
Association Between Overall Sedentary Behavior and Cause-Specific Mortality in Black and White Adults, Southern Community Cohort Study, 2002–2011
| Model by Cause of Death | Overall Sedentary Behavior, hours/day |
P Value | |||||||||||
|---|---|---|---|---|---|---|---|---|---|---|---|---|---|
| <5.76 |
5.76–8.50 |
8.51–12.00 |
>12.00 |
||||||||||
| No. of Deaths | HR | 95% CI | No. of Deaths | HR | 95% CI | No. of Deaths | HR | 95% CI | No. of Deaths | HR | 95% CI | ||
| Blacks | |||||||||||||
| All causes | |||||||||||||
| Model 1a | 967 | 1.00 | Referent | 908 | 1.01 | 0.92, 1.10 | 915 | 1.16 | 1.06, 1.27 | 823 | 1.17 | 1.06, 1.29 | 0.0002 |
| Model 2b | 967 | 1.00 | Referent | 908 | 1.02 | 0.93, 1.12 | 915 | 1.18 | 1.07, 1.30 | 823 | 1.19 | 1.08, 1.32 | <0.0001 |
| Cardiovascular disease | |||||||||||||
| Model 1a | 295 | 1.00 | Referent | 254 | 0.89 | 0.75, 1.06 | 259 | 1.06 | 0.89, 1.26 | 232 | 1.09 | 0.91, 1.30 | 0.07 |
| Model 2b | 295 | 1.00 | Referent | 254 | 0.90 | 0.76, 1.07 | 259 | 1.08 | 0.91, 1.28 | 232 | 1.11 | 0.93, 1.33 | 0.04 |
| Cancer | |||||||||||||
| Model 1a | 253 | 1.00 | Referent | 229 | 0.97 | 0.81, 1.17 | 216 | 1.04 | 0.86, 1.26 | 207 | 1.10 | 0.91, 1.34 | 0.24 |
| Model 2b | 253 | 1.00 | Referent | 229 | 0.98 | 0.82, 1.18 | 216 | 1.06 | 0.88, 1.28 | 207 | 1.12 | 0.92, 1.36 | 0.17 |
| Whites | |||||||||||||
| All causes | |||||||||||||
| Model 1a | 360 | 1.00 | Referent | 400 | 1.08 | 0.93, 1.25 | 346 | 1.08 | 0.93, 1.26 | 288 | 1.26 | 1.07, 1.48 | 0.001 |
| Model 2b | 360 | 1.00 | Referent | 400 | 1.08 | 0.93, 1.25 | 346 | 1.07 | 0.92, 1.25 | 288 | 1.24 | 1.06, 1.47 | 0.002 |
| Cardiovascular disease | |||||||||||||
| Model 1a | 66 | 1.00 | Referent | 97 | 1.43 | 1.04, 1.97 | 96 | 1.59 | 1.15, 2.20 | 77 | 1.76 | 1.25, 2.49 | 0.001 |
| Model 2b | 66 | 1.00 | Referent | 97 | 1.44 | 1.05, 1.98 | 96 | 1.59 | 1.14, 2.20 | 77 | 1.75 | 1.24, 2.48 | 0.002 |
| Cancer | |||||||||||||
| Model 1a | 96 | 1.00 | Referent | 92 | 0.87 | 0.65, 1.18 | 74 | 0.86 | 0.63, 1.19 | 60 | 1.04 | 0.74, 1.46 | 0.28 |
| Model 2b | 96 | 1.00 | Referent | 92 | 0.88 | 0.65, 1.18 | 74 | 0.86 | 0.63, 1.19 | 60 | 1.04 | 0.74, 1.46 | 0.29 |
Abbreviations: CI, confidence interval; HR, hazard ratio.
a Model 1 was adjusted for sex, source of enrollment (community health center or general population), educational level (<9 years, 9–11 years, high school, some college, or beyond college), household income (<$15,000, $15,000–$24,999, $25,000–$49,999, or ≥$50,000), cigarette smoking (never; former, <1 pack/day; former, ≥1 pack/day; current, <1 pack/day; or current, ≥1 pack/day), body mass index (weight (kg)/height (m)2; <18.5, 18.5–24.9, 25–29.9, 30.0–34.9, or ≥35.0), sleep duration (<7, 7–8, or ≥9 hours/day), diabetes (yes or no), and employment status (yes or no).
b Model 2 was adjusted for the covariates in model 1 and overall physical activity level (quartiles).
Figure 2.

Association between sedentary behavior (hours/day) and cardiovascular mortality in men and women by race, Southern Community Cohort Study, 2002–2011. A) Black men (Ptrend = 0.30); B) white men (Ptrend < 0.01); C) black women (Ptrend = 0.12); and D) white women (Ptrend = 0.32). The model was adjusted for sex, source of enrollment (community health center or general population), educational level (<9 years, 9–11 years, high school, some college, or beyond college), household income (<$15,000, $15,000–$24,999, $25,000–$49,999, or ≥$50,000), cigarette smoking (never; former, <1 pack/day; former, ≥1 pack/day; current, <1 pack/day; or current, ≥1 pack/day), body mass index (weight (kg)/height (m)2; <18.5, 18.5–24.9, 25–29.9, 30.0–34.9, or ≥35.0), sleep duration (<7, 7–8, or ≥9 hours/day), diabetes (yes or no), employment status (yes or no), and overall physical activity (quartiles). Bars, 95% confidence intervals.
We also examined the association between television viewing and all-cause mortality. Persons who reported viewing more than 5 hours/day of television (vs. <1 hour/day) were at greater risk: The risk was 21% greater in black men (HR = 1.21, 95% CI: 1.03, 1.43), 55% greater in black women (HR = 1.55, 95% CI: 1.22, 1.96), 24% greater in white men (HR = 1.24, 95% CI: 0.94, 1.64), and 70% greater in white women (HR = 1.70, 95% CI: 1.22, 2.37; Figure 3).
Figure 3.

Association between television viewing (hours/day) and all-cause mortality in men and women by race, Southern Community Cohort Study, 2002–2011. A) Black men (Ptrend < 0.01); B) white men (Ptrend = 0.40); C) black women (Ptrend < 0.01); and D) white women (Ptrend < 0.01). The model was adjusted for sex, source of enrollment (community health center or general population), educational level (<9 years, 9–11 years, high school, some college, or beyond college), household income (<$15,000, $15,000–$24,999, $25,000–$49,999, or ≥$50,000), cigarette smoking (never; former, <1 pack/day; former, ≥1 pack/day; current, <1 pack/day; or current, ≥1 pack/day), body mass index (weight (kg)/height (m)2; <18.5, 18.5–24.9, 25–29.9, 30.0–34.9, or ≥35.0), sleep duration (<7, 7–8, or ≥9 hours/day), diabetes (yes or no), overall physical activity (continuous), and other types of sedentary behavior (continuous). Bars, 95% confidence intervals.
To explore the contributions of both overall physical activity level and sedentary behavior to all-cause mortality risk in black adults (data were too sparse for a parallel analysis among whites), we examined the joint effects of these exposures using tertiles (Figure 4). Blacks who spent the most time sitting (≥10.5 hours/day) and were the least active (<12.6 MET-hours/day) had a 47% greater mortality risk (HR = 1.47, 95% CI: 1.25, 1.71) compared with those who reported the least sedentary time (<6.5 hours/day) and most activity (≥26.4 MET-hours/day).
Figure 4.
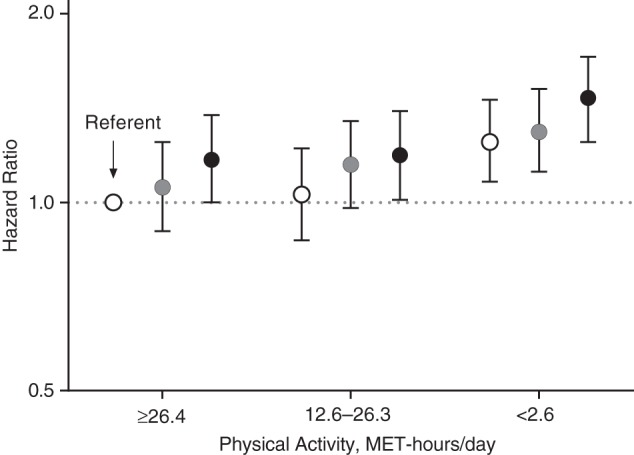
Joint effects of physical activity and sedentary behavior on all-cause mortality risk in black participants, Southern Community Cohort Study, 2002–2011. Tertiles of sedentary behavior are shown. Open circle, <6.5 hours/day; gray circles, 6.5–1.4 hours/day; and black circles, ≥10.5 hours/day. The model was adjusted for sex, source of enrollment (community health center or general population), educational level (<9 years, 9–11 years, high school, some college, or beyond college), household income (<$15,000, $15,000–$24,999, $25,000–$49,999, or ≥$50,000), cigarette smoking (never; former, <1 pack/day; former, ≥1 pack/day; current, <1 pack/day; or current, ≥1 pack/day), body mass index (weight (kg)/height (m)2; <18.5, 18.5–24.9, 25–29.9, 30.0–34.9, or ≥35.0), sleep duration (<7, 7–8, or ≥9 hours/day), diabetes (yes or no), and employment status (yes or no). MET, metabolic equivalent. Bars, 95% confidence intervals.
Sensitivity analysis excluding early deaths
In addition to excluding persons with pre-existing diseases in our analytic sample, we also conducted sensitivity analyses by excluding participants with less than 1 year of follow-up to evaluate the potential for reverse causality to explain our findings. Our results were virtually identical to the mortality associations presented for overall physical activity level (Table 2) and sedentary behaviors (Table 3 and Web Tables 2 and 3).
DISCUSSION
In the present large prospective study in the southeastern United States, we found that in blacks, higher levels of overall physical activity were associated with a 24% lower risk of death from all causes, a 19% lower risk of death from cardiovascular disease, and a 24% lower risk of death from cancer after controlling for relevant covariates and sedentary behavior. Walking to go places or for exercise also was associated with a lower mortality risk. In contrast, more overall time spent sitting and 5 hours/day or more of television viewing were associated with an increased risk of death during follow-up after adjustment for overall physical activity level. Our results add important empirical evidence that supports the hypothesis that engaging in more physical activity is associated with a lower mortality risk and that a larger amount of sedentary behavior is associated with an increased mortality risk in black adults. In addition, we provide the first evidence of which we are aware for these associations in black men.
Only a few United States–based studies in black adults have provided evidence that physical activity is inversely associated with death from all causes (12, 13) and cardiovascular disease (14, 16), and these studies have evaluated only leisure-time physical activity and not household and occupational activity, which may be important contributors to overall activity. Our study adds to this literature by providing empirical evidence that greater amounts of physical activity are associated with a lower risk of all-cause mortality, along with much needed evidence demonstrating reduced risks of all-cause, cardiovascular, and cancer mortality in black men. Our physical activity results among black men are consistent with results of Kokkinos et al. (25), who demonstrated a reduced mortality risk associated with greater cardiorespiratory fitness among black veterans. Previous studies of incident cardiovascular outcomes that included black men suggested that the lower mortality risk that we observed may be linked to prevention of incident heart disease, stroke, and heart failure (16).
Several studies have recently demonstrated a positive association between prolonged sedentary behavior and mortality risk (5, 26–30), but there is only limited evidence among black adults. Matthews et al. (17) reported that prolonged television viewing (≥7 hours/day vs. <1 hour/day) was associated with a 2-fold greater risk for all-cause mortality in an analysis that combined black men and women in the National Institutes of Health-AARP Study. Seguin et al. (18) recently reported that black women in the Women's Health Initiative who reported the most time spent sitting (≥11 hours/day vs. <4 hours/day) had a 37%–57% greater risk of all-cause, cardiovascular, and cancer mortality. The present study confirms these findings by demonstrating positive associations of overall time spent sitting and television viewing with all-cause mortality in black adults and extends the evidence base by presenting separate estimates for black males. Our finding for television viewing, the most prevalent leisure-time sedentary behavior in the United States (31), is notable because nationally blacks report watching 20%–30% more television than do whites (31). Targeting reductions in television viewing in favor of more physically active pursuits may be a useful strategy to improve longevity in black adults.
Interestingly, in a finding that is consistent with other those from studies (17, 26, 28–30), we found evidence that suggests that the association for overall time spent sitting (>12 hours/day vs. <5.76 hours/day) was stronger in black women (HR = 1.27, 95% CI: 1.09, 1.48) than in black men (HR = 1.13, 95% CI: 0.99, 1.28). Future studies utilizing improved measures of the amount and types of sedentary behavior and physical activity (32) are needed to better understand possible sex differences in this association.
Our study has several strengths that should be considered. The SCCS cohort is among the largest prospective cohorts ever assembled to investigate risk and preventive factors for cancer and other chronic diseases in black adults (19), and over an average of 6.4 years of follow-up, more than 5,000 deaths contributed to the current analysis. Inclusion of both sexes in the study and its large sample size facilitated investigation of our target behaviors in black men and women. We also considered and controlled for a large number of factors that could have confounded the results, including demographic and dietary factors, sleep duration, BMI, and for the sedentary behavior results, overall physical activity level. Our primary behavioral exposures were assessed by trained interviewers using an instrument that we designed to evaluate a broad range of relevant physical activity behaviors (21, 33). Thus, we were able to evaluate overall activity and sedentary time rather than just examining a few select behaviors (e.g., leisure-time activity, television viewing). Another unique strength of our study is that by design, the majority of our participants were from similar socioeconomic backgrounds, which may enhance comparability of results between blacks and whites, with adjustment for residual socioeconomic differences in our statistical modeling. To minimize the possible influence of reverse causality, we also excluded individuals with pre-existing chronic diseases and conducted sensitivity analyses that excluded the first year of follow-up. Although we believe these analytic approaches reduce concerns about reverse causality, excluding individuals with less than 1 year of follow-up may not completely eliminate this potential bias.
Our study also had other potential weaknesses that should be considered. First, we relied on self-reported information for our primary behavioral exposures, and possible differences in reporting accuracy by race is a concern. Walsh et al. (34) found differences in physical activity reporting by race in women, whereas Wolf et al. (35) did not. In our validation study within the SCCS, we found comparable validity for blacks and whites, but the validity coefficients observed were low in comparison to an accelerometer (i.e., r = 0.17–0.37) (21). Thus, measurement error in our physical activity and sedentary behavior exposures may be substantial (32, 36), and in prospective studies such as this one, such errors on average will tend to attenuate the risk estimates observed (32). Second, an additional weakness of our study was the smaller number of deaths among whites than among blacks, particularly deaths from cardiovascular disease and cancer. This reduced the statistical power in our comparisons of effects in whites and evaluation of differences between blacks and whites. Nevertheless, nearly 1,400 deaths were observed among whites, which enabled us to detect significant associations with both physical activity level and sedentary behaviors.
Daily levels of physical activity have declined dramatically over the last 50 years in the United States, particularly as time spent in sedentary behaviors has increased at home and at work (8, 9). Our findings provide much-needed empirical evidence supporting the hypothesis that more overall physical activity is associated with a lower mortality risk and that prolonged time in sedentary behavior is associated with an increased mortality risk in both black and white adults. Collectively, our results suggest that the associations of physically active and sedentary behaviors with mortality are evident in black men, and the associations observed are broadly similar for both blacks and whites. Thus, interventions designed to reduce time spent in sedentary behavior, particularly television viewing, in favor of spending time in more physically active pursuits could be useful in reducing the risk of death among black adults in the United States.
Supplementary Material
ACKNOWLEDGMENTS
Author affiliations: Division of Cancer Epidemiology and Genetics, Nutritional Epidemiology Branch, National Cancer Institute, Rockville, Maryland (Charles E. Matthews, Qian Xiao); EpidStat Institute, Ann Arbor, Michigan (Sarah S. Cohen); Department of Medicine, Vanderbilt University Medical Center and Vanderbilt-Ingram Cancer Center, Nashville, Tennessee (Jay H. Fowke, Maciej S. Buchowski, William J. Blot); International Epidemiology Institute, Rockville, Maryland (Xijing Han, William J. Blot); Department of Internal Medicine, Meharry Medical College, Nashville, Tennessee (Margaret K. Hargreaves); and Department of Epidemiology, Harvard School of Public Health, Dana-Farber/Harvard Cancer Center, Boston, Massachusetts (Lisa B. Signorello).
The Southern Community Cohort Study is funded by grant R01 CA92447 from the National Cancer Institute at the National Institutes of Health, including special allocations from the American Recovery and Reinvestment Act (grant 3R01 CA092447-08S1). Partial support for M.K.H. was provided by National Institutes of Health grants 5P60 DK20593-24 and 5U01 CA114641-05.
Conflict of interest: none declared.
REFERENCES
- 1.Rastogi S, Johnson TD, Hoeffel EM, et al. The Black Population: 2010. 2010 Census Briefs. http://www.census.gov/prod/cen2010/briefs/c2010br-06.pdf . Published September 2011. Accessed February 14, 2013.
- 2.Group W, Roger VL, Go AS, et al. Heart disease and stroke statistics–2012 update: a report from the American Heart Association. Circulation. 2012;125(1):e2–e220. doi: 10.1161/CIR.0b013e31823ac046. [DOI] [PMC free article] [PubMed] [Google Scholar]
- 3.American Cancer Society. Cancer Facts and Figures—2012. Atlanta, GA: American Cancer Society; 2012. [Google Scholar]
- 4.US National Center for Health Statistics. Health, United States, 2011: With Special Feature on Socioeconomic Status and Health. Hyattsville, MD: US National Center for Health Statistics; 2012. [PubMed] [Google Scholar]
- 5.Stamatakis E, Hamer M, Dunstan DW. Screen-based entertainment time, all-cause mortality, and cardiovascular events: population-based study with ongoing mortality and hospital events follow-up. J Am Coll Cardiol. 2011;57(3):292–299. doi: 10.1016/j.jacc.2010.05.065. [DOI] [PubMed] [Google Scholar]
- 6.Moore SC, Patel AV, Matthews CE, et al. Leisure time physical activity of moderate to vigorous intensity and mortality: a large pooled cohort analysis. PLoS Med. 2012;9(11):e1001335. doi: 10.1371/journal.pmed.1001335. [DOI] [PMC free article] [PubMed] [Google Scholar]
- 7.Physical Activity Guidelines Advisory Committee. Physical Activity Guidelines Advisory Committee Report. Washington, DC: US Department of Health and Human Services; 2008. [DOI] [PubMed] [Google Scholar]
- 8.Brownson RC, Boehmer TK, Luke DA. Declining rates of physical activity in the United States: What are the contributors? Annu Rev Public Health. 2005;26:421–443. doi: 10.1146/annurev.publhealth.26.021304.144437. [DOI] [PubMed] [Google Scholar]
- 9.Ng SW, Popkin BM. Time use and physical activity: a shift away from movement across the globe. Obes Rev. 2012;13(8):659–680. doi: 10.1111/j.1467-789X.2011.00982.x. [DOI] [PMC free article] [PubMed] [Google Scholar]
- 10.US Centers for Disease Control and Prevention. Physical Inactivity Estimates, by County. http://www.cdc.gov/features/dsphysicalinactivity/ Published March 9, 2011. Accessed May 1, 2013.
- 11.Owen N, Sparling PB, Healy GN, et al. Sedentary behavior: emerging evidence for a new health risk. Mayo Clin Proc. 2010;85(12):1138–1141. doi: 10.4065/mcp.2010.0444. [DOI] [PMC free article] [PubMed] [Google Scholar]
- 12.Gregg EW, Gerzoff RB, Caspersen CJ, et al. Relationship of walking to mortality among US adults with diabetes. Arch Intern Med. 2003;163(12):1440–1447. doi: 10.1001/archinte.163.12.1440. [DOI] [PubMed] [Google Scholar]
- 13.Leitzmann MF, Park Y, Blair A, et al. Physical activity recommendations and decreased risk of mortality. Arch Intern Med. 2007;167(22):2453–2460. doi: 10.1001/archinte.167.22.2453. [DOI] [PubMed] [Google Scholar]
- 14.Mathieu RA, 4th, Powell-Wiley TM, Ayers CR, et al. Physical activity participation, health perceptions, and cardiovascular disease mortality in a multiethnic population: the Dallas Heart Study. Am Heart J. 2012;163(6):1037–1040. doi: 10.1016/j.ahj.2012.03.005. [DOI] [PMC free article] [PubMed] [Google Scholar]
- 15.Manson JE, Greenland P, LaCroix AZ, et al. Walking compared with vigorous exercise for the prevention of cardiovascular events in women. N Engl J Med. 2002;347(10):716–725. doi: 10.1056/NEJMoa021067. [DOI] [PubMed] [Google Scholar]
- 16.Bell EJ, Lutsey PL, Windham BG, et al. Physical activity and cardiovascular disease in African Americans in Atherosclerosis Risk in Communities. Med Sci Sports Exerc. 2013;45(5):901–907. doi: 10.1249/MSS.0b013e31827d87ec. [DOI] [PMC free article] [PubMed] [Google Scholar]
- 17.Matthews CE, George SM, Moore SC, et al. Amount of time spent in sedentary behaviors and cause-specific mortality in US adults. Am J Clin Nutr. 2012;95(2):437–445. doi: 10.3945/ajcn.111.019620. [DOI] [PMC free article] [PubMed] [Google Scholar]
- 18.Seguin R, Buchner DM, Liu J, et al. Sedentary behavior and mortality in older women: the Women's Health Initiative. Am J Prev Med. 2014;46(2):122–135. doi: 10.1016/j.amepre.2013.10.021. [DOI] [PMC free article] [PubMed] [Google Scholar]
- 19.Signorello LB, Hargreaves MK, Blot WJ. The Southern Community Cohort Study: investigating health disparities. J Health Care Poor Underserved. 2010;21(suppl 1):26–37. doi: 10.1353/hpu.0.0245. [DOI] [PMC free article] [PubMed] [Google Scholar]
- 20.Hargreaves MK, Arnold C, Blot WJ. Community health centers: their role in the treatment of minorities and in health disparities research. In: Satcher D, Paramies R, editors. Multicultural Medicine and Health Disparities. New York, NY: McGraw-Hill; 2006. pp. 485–494. [Google Scholar]
- 21.Buchowski MS, Matthews CE, Cohen SS, et al. Evaluation of a questionnaire to assess sedentary and active behaviors in the Southern Community Cohort Study. J Phys Act Health. 2012;9(6):765–775. doi: 10.1123/jpah.9.6.765. [DOI] [PMC free article] [PubMed] [Google Scholar]
- 22.Ainsworth BE, Haskell WL, Whitt MC, et al. Compendium of physical activities: an update of activity codes and MET intensities. Med Sci Sports Exerc. 2000;32(9 suppl):S498–S504. doi: 10.1097/00005768-200009001-00009. [DOI] [PubMed] [Google Scholar]
- 23.Signorello LB, Munro HM, Buchowski MS, et al. Estimating nutrient intake from a food frequency questionnaire: incorporating the elements of race and geographic region. Am J Epidemiol. 2009;170(1):104–111. doi: 10.1093/aje/kwp098. [DOI] [PMC free article] [PubMed] [Google Scholar]
- 24.Signorello LB, Buchowski MS, Cai Q, et al. Biochemical validation of food frequency questionnaire-estimated carotenoid, alpha-tocopherol, and folate intakes among African Americans and non-Hispanic Whites in the Southern Community Cohort Study. Am J Epidemiol. 2010;171(4):488–497. doi: 10.1093/aje/kwp402. [DOI] [PMC free article] [PubMed] [Google Scholar]
- 25.Kokkinos P, Myers J, Kokkinos JP, et al. Exercise capacity and mortality in black and white men. Circulation. 2008;117(5):614–622. doi: 10.1161/CIRCULATIONAHA.107.734764. [DOI] [PubMed] [Google Scholar]
- 26.Patel AV, Bernstein L, Deka A, et al. Leisure time spent sitting in relation to total mortality in a prospective cohort of US adults. Am J Epidemiol. 2010;172(4):419–429. doi: 10.1093/aje/kwq155. [DOI] [PMC free article] [PubMed] [Google Scholar]
- 27.Koster A, Caserotti P, Patel KV, et al. Association of sedentary time with mortality independent of moderate to vigorous physical activity. PLoS One. 2012;7(6):e37696. doi: 10.1371/journal.pone.0037696. [DOI] [PMC free article] [PubMed] [Google Scholar]
- 28.van der Ploeg HP, Chey T, Korda RJ, et al. Sitting time and all-cause mortality risk in 222 497 Australian adults. Arch Intern Med. 2012;172(6):494–500. doi: 10.1001/archinternmed.2011.2174. [DOI] [PubMed] [Google Scholar]
- 29.Katzmarzyk PT, Church TS, Craig CL, et al. Sitting time and mortality from all causes, cardiovascular disease, and cancer. Med Sci Sports Exerc. 2009;41(5):998–1005. doi: 10.1249/MSS.0b013e3181930355. [DOI] [PubMed] [Google Scholar]
- 30.Wijndaele K, Brage S, Besson H, et al. Television viewing time independently predicts all-cause and cardiovascular mortality: the EPIC Norfolk study. Int J Epidemiol. 2011;40(1):150–159. doi: 10.1093/ije/dyq105. [DOI] [PubMed] [Google Scholar]
- 31.Bureau of Labor Statistics, US Department of Labor. American Time Use Survey: Table A1, 2011. http://www.bls.gov/tus/tables/a1_2011.pdf. Published June 22, 2012. Accessed January 7, 2013. [Google Scholar]
- 32.Matthews CE, Moore SC, George SM, et al. Improving self-reports of active and sedentary behaviors in large epidemiologic studies. Exerc Sport Sci Rev. 2012;40(3):118–126. doi: 10.1097/JES.0b013e31825b34a0. [DOI] [PMC free article] [PubMed] [Google Scholar]
- 33.Cohen SS, Matthews CE, Signorello LB, et al. Sedentary and physically active behavior patterns among low-income African-American and white adults living in the Southeastern United States. PLoS One. 2013;8(4):e59975. doi: 10.1371/journal.pone.0059975. [DOI] [PMC free article] [PubMed] [Google Scholar]
- 34.Walsh MC, Hunter GR, Sirikul B, et al. Comparison of self-reported with objectively assessed energy expenditure in black and white women before and after weight loss. Am J Clin Nutr. 2004;79(6):1013–1019. doi: 10.1093/ajcn/79.6.1013. [DOI] [PubMed] [Google Scholar]
- 35.Wolf AM, Hunter DJ, Colditz GA, et al. Reproducibility and validity of a self-administered physical activity questionnaire. Int J Epidemiol. 1994;23(5):991–999. doi: 10.1093/ije/23.5.991. [DOI] [PubMed] [Google Scholar]
- 36.Ferrari P, Friedenreich C, Matthews CE. The role of measurement error in estimating levels of physical activity. Am J Epidemiol. 2007;166(7):832–840. doi: 10.1093/aje/kwm148. [DOI] [PubMed] [Google Scholar]
Associated Data
This section collects any data citations, data availability statements, or supplementary materials included in this article.