

Abstract
Cancer stem cells (CSCs) may contribute to tumor initiation, distant metastasis and chemo-resistance. One of RNA-binding proteins, Quaking (QKI), was reported to be a tumor suppressor. Here we showed that reduced QKI levels were observed in many human oral cancer samples. Moreover further reduction of QKI expression in CSCs was detected compared with non-CSCs in oral cancer cell lines. Overexpressing QKI in oral cancer cells significantly reduced CSC sphere formation and stem cell-associated genes. In tumor implanting nude mice model, QKI significantly impeded tumor initiation rates, tumor sizes and lung metastasis rates. As a contrast, knocking down QKI enhanced the above effects. Among the putative CSC target genes, SOX2 expression was negatively affected by QKI, mechanism study revealed that QKI may directly regulate SOX2 expression via specific binding with its 3′UTR in a cis element-dependent way. Loss of SOX2 even completely reversed the sphere forming ability in QKI knockdown cell line. Taken together, these data demonstrated that SOX2 is an important CSC regulator in oral cancer. QKI is a novel CSC inhibitor and impaired multiple oral CSC properties via partial repression of SOX2. Therefore, reduced expression of QKI may provide a novel diagnostic marker for oral cancer.
Keywords: QKI, SOX2, cancer stem cell, oral cancer, self-renewal
Introduction
Oral cancer accounts for 3% of all cancer cases throughout the world.1 It is estimated that 127 459 annual deaths are caused from oral cancer worldwide, of which 96 720 occur in developing countries.2 Squamous cell carcinoma originating in the mucosal linings accounts for more than 90% of oral cancers.2 Oral squamous cell carcinoma (OSCC) is characterized by invasive growth, a considerable rate of early recurrences, and frequent lymph nodes metastasis.1 Except for inoperable cases, surgery remains the primary treatment modality of choice in OSCC.3 However, regardless of the easy access of oral cavity for clinical examination, OSCC is usually diagnosed in advanced stages. Percentages of morbidity and mortality of OSCC was not substantially improved during the past 30 y.2 Additionally, the incidence rate is still rising, especially in younger people aging from 18 to 44 y.4 Therefore, it is more important to discover new diagnostic and therapeutic targets.
The CSC hypothesis posits that many cancers are maintained in a hierarchical organization of rare CSCs as tumor initiator, then consequently divide into amplifying cells and partially differentiated as tumor mass.5 Compared with non-CSCs, CSCs contribute more to tumor initiation, metastasis, resistance to chemotherapy, and tumor recurrence.6,7 Recent data highly support the existence of CSCs in solid tumors, including OSCC and head and neck squamous cell carcinomas (HNSCC).8,9 The stem cell properties can be identified by a surface marker, such as CD44 and CD133, however CSC markers are not universal for all cancer types.10 It is becoming evident that tumorigenesis usually shared similar pathways with early development.8 For example, the transcription factor SOX2 is essential to maintain the pluripotent phenotype in embryonic stem cells. It can even efficiently generate iPS (induced precursor cells) with other factors.11 It was also known that SOX2 is amplified in lung, esophagus squamous cancers12 and OSCC.13 However, there is no direct evidence to show its relevance with CSCs, nor how its regulation was controlled.
As we know regulation of gene expression occurred at multiple levels, post-transcriptional control of mRNA dynamics mediated by miRNAs and/or RNA-binding proteins was recently found to be more and more widespread.14,15 The RNA-binding protein Quaking (QKI) is a member of the highly conserved signal transduction and activator of RNA (STAR) family of RNA-binding proteins.16 The qkI gene expresses 3 major alternatively spliced mRNAs (5, 6, and 7 kb) encoding QKI5, QKI6, and QKI7 that differ in their C-terminal 30 amino acids.17 Through binding with QKI response element (QRE; ACUAAY[N1–20]UAAY) located in the 3′ untranslated region (3′UTR) of target mRNAs, QKI, in its heterodimer or homodimer forms, regulates mRNA stability, nuclear retention, RNA transportation, and translational modulation.16,17 Recent studies employing the Clip-Seq and bioinformatics analysis identified thousands of genes containing at least one QRE as direct targets of QKI.15,16 Among these target genes, many of them are cancer-related, such as Ras, Jun, Fos, and p53. These findings denote the significance of QKIs in controlling cell proliferation and stress signals.16
In the present study, we hypothesized that QKI is a novel tumor suppressor in OSCC; it may affect CSC self-renewal ability in vitro and in vivo. It’s more intriguing to know whether there’s any CSC marker genes affected by QKI and therefore mediated the novel CSC regulatory effects of QKI.
Results
QKI expression in cell lines and human OSCC samples
We first investigated the expression of QKI using tissue microarrays (TMAs) with 10 adjacent normal mucosal samples and 50 primary OSCC samples. Immunohistochemistry analysis revealed that QKI expression was detectable in 100% of the adjacent normal mucosal samples (10/10), and only in 72% of OSCC samples (36/50) and at a relatively lower level (Fig. 1A). The data above indicated that the expression of QKI in OSCC was aberrantly reduced.

Figure 1. Expression pattern of QKI in cell lines and human OSCC samples. (A) Representative data of the expression of QKI in the adjacent normal and OSCC samples assayed by immunohistochemistry. QKI expression was much lower in most cancerous tissues than that in the adjacent normal counterparts. (B) mRNA levels of QKI in Tca8113, Tb, and FaDu cell lines were quantified by qPCR. Results were normalized to GAPDH mRNA. Data are shown as mean ± SD from 3 independent experiments. (C) Protein levels of QKI in the above cell lines were detected by western blot, and β-actin served as an internal control to ensure equal loading. (D) qPCR analysis was performed for the indicated genes in Tca8113 and Tca8113 sphere cells. Data are shown as mean ± SD from 3 independent experiments. CK13, cytokeratin 13. (E) mRNA levels of QKI in Tca8113 and Tb cells in different culture conditions were quantified by qPCR. Data are shown as mean ± SD from 3 independent experiments. **P < 0.01. (F) Protein levels of QKI and SOX2 in Tca8113 cells in different culture conditions were detected by western blot.
To further explore the potential role of QKI in the progression of OSCC, we examined the endogenous expression of QKI in OSCC cell lines using qPCR and western blot analysis (Fig. 1B and C). It is important to note that there are 2 positive protein bands in the western blot results, corresponding with QKI5 (upper band) and QKI6 (lower band) respectively. Among the 2 human OSCC cell lines, Tca8113 and Tb, and the human pharynx squamous cell carcinoma cell line FaDu, Tb is a cell derivative set up from brain metastasis of Tca8113 cells in nude mice.18 The lowest QKI mRNA and protein levels in the metastatic Tb cells suggest an inverse relevance of QKI with cancer grading.
Tumor spheres efficiently enrich tumorigenic CSCs characteristic with stem cell marker genes.19 We found Tca8113 sphere cells contain higher CSC marker genes, including KLF4, CD44, SOX2, etc. and lower differentiation related genes, including involucrin, RARβ, CK13 and E-cadherin as well (Fig. 1D). As a contrast, QKI expressions are the lowest at both mRNA and protein levels in cultured Tca8113 or Tb spheres. After seeding back to adherent condition and culturing for 10 more d, QKI expression was restored (Fig. 1E and F). Notably, sphere-derived Tca8113 cells, but not parental Tca8113 cells, highly expressed stem cell associated SOX2, which showed an opposite trend after attachment culture (Fig. 1F). Taken together, the reduced QKIs expression pattern in clinical cancer samples and oral CSC subpopulations highly suggested the suppressive roles of QKI in cancers.
QKI inhibits stem cell properties of OSCC in vitro
It’s critical to know whether QKIs exert a repressive role in oral CSCs. To confirm this, we set up stable cell lines overexpressing QKI5 or QKI6 respectively and knocking down QKI with LV-miQKI in Tca8113 cells, which were verified by qPCR and western blot (Fig. 2A and B).

Figure 2. QKI inhibits stem cell properties of OSCC in vitro. (A) Expression of QKI in Tca8113 cells. Tca8113 cells infected with LV-miQKI, LV-QKI5, or LV-QKI6 were detected by qPCR. Data are shown as mean ± SD from 3 independent experiments. (B) Expression of QKI and SOX2 in Tca8113 cells. Tca8113 cells infected with LV-miQKI, LV-QKI5, or LV-QKI6 were detected by western blot. Overexpression of QKI reduced the protein level of SOX2, while knockdown of QKI increased the level of SOX2 in Tca8113 cells. (C) LV-miQKI cells formed more primary and secondary passaged spheres than the control cells, while LV-QKI5 or LV-QKI6 cells formed fewer primary and secondary passaged spheres than the control cells. Shown are representative phase-contrast image of spheres derived from cells (scale bar = 200 μm). Data are shown as mean ± SD from 3 independent experiments. *P < 0.05; **P < 0.01. (D) qPCR analysis was performed for the indicated genes in Tca8113, LV-QKI5, or LV-QKI6 cells. Data are shown as mean ± SD from 3 independent experiments. **P < 0.01. CK5, cytokeratin 5; CK14, cytokeratin 14. (E) qPCR analysis was performed for the indicated genes in Tca8113 or LV-miQKI cells. Data are shown as mean ± SD from 3 independent experiments. **P < 0.01.
In tumor sphere forming experiment, the number of spheres reflects the quantity of cells capable of self-renewal.20 As shown in Figure 2C, compared with the control cells, LV-QKI5 and LV-QKI6 cells generated fewer spheres in their first and second passages, while LV-miQKI cells formed more. These data supported that QKI indeed inhibited the self-renewal ability of oral CSCs in vitro.
Subsequently, the changes of stem cell associated genes were detected. Compared with the controls, LV-QKI5 or LV-QKI6 cells decreased protein levels of SOX2 and mRNA levels of a panel of stem genes, including SOX2, NANOG, OCT4, HIF1α, CK-5, CK-14, and Cyclin D1 (Fig. 2B and D).
Meanwhile stem cell associated genes was compared between LV-miQKI cells and the control cells. As shown in Figure 2B and E, LV-miQKI cells increased protein levels of SOX2 and mRNA levels of a panel of stem cell genes, including SOX2, NANOG, KLF4, OCT4, SNAIL, and CK-5.
Finally the effect of QKI on cell proliferation was performed by the MTT assay. We found that LV-miQKI cells proliferated more rapidly than the controls, while LV-QKI5 and LV-QKI6 cells decelerated the cell growth trend (Fig. 3A). Cell cycle analysis further indicated that QKI overexpression prolonged the G1 phase with shortened S and G2/M phase (Fig. 3B) without apparent effects on cell apoptosis (Fig. 3C). These data implicated that QKI might inhibit stem cell properties through regulating the proliferation of oral CSCs.
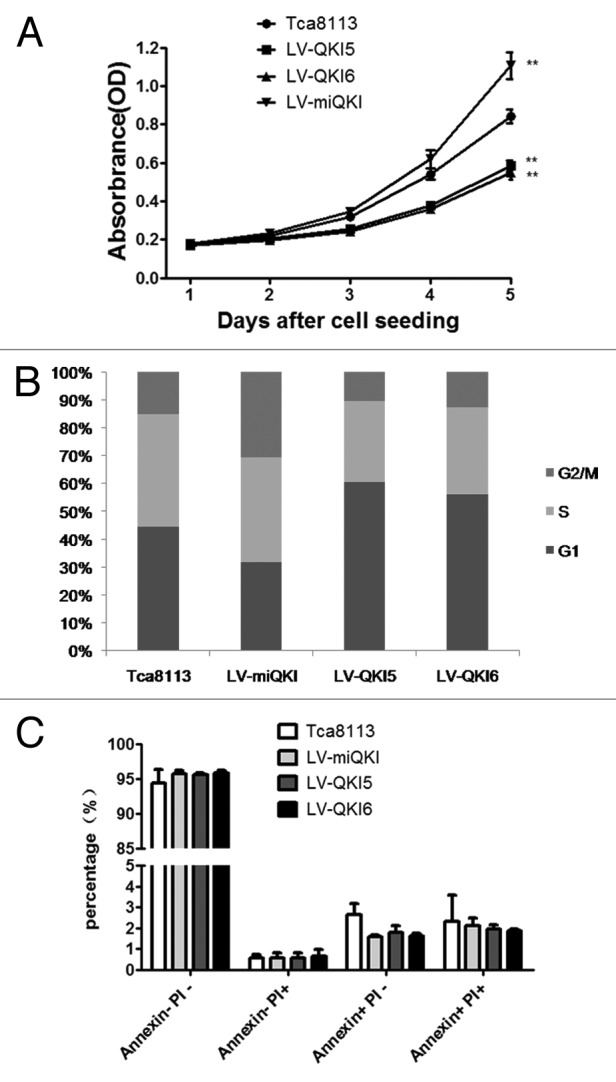
Figure 3. QKI inhibits the expansion of OSCC cells and has no marked effect on cell apoptosis. (A) Compared with the control cells, overexpression of QKI5 or QKI6 significantly inhibited the growth of Tca8113 cells, and knockdown of QKI promoted the growth of Tca8113 cells. LV-QKI5, LV-QKI6, LV-miQKI and Tca8113 cells were cultured for indicated time and cell number were analyzed by MTT (n = 5, **P < 0.01). (B) Cell cycle distribution of cells with QKI overexpression and knockdown. Results from flow cytometric analysis showed that compared with the control cells, the proportion of cells in S and G2/M phase was increased in LV-miQKI cells, and the proportion of cells in G1 phase was increased in LV-QKI5 and LV-QKI6 cells. Data presented here is a representative of 3 different experiments. (C) Flow cytometric analysis showed no marked effect on cell apoptosis. Data from 3 independent experiments are presented as mean ± SD. PI, propidium iodide.
QKI inhibits tumor formation and pulmonary metastasis in nude mice
An important CSC feature is more efficient xenograft formation.21 To confirm the inhibitory role of QKI in tumor initiation by oral CSC, a series of LV-QKI5, LV-QKI6, LV-miQKI or control Tca8113 cells were subcutaneously injected into nude mice and followed by monitoring of tumor formation every 3 d. As shown in Figure 4A, a significant difference in tumor incidence and tumor growth were observed among these subpopulations. First no mice inoculated with 5 × 10³ LV-QKI5 or LV-QKI6 cells developed tumors, whereas 5 × 10³ control cells developed tumors in only 1 out of 6 animals, tumors developed in 2 out of 6 animals inoculated with 5 × 10³ LV-miQKI cells. Second at the level of 5 × 10⁴ cells inoculation, LV-QKI5 or LV-QKI6 cells developed tumors in 2 out of 6 animals. Notably all 6 animals developed tumors injected with LV-miQKI or control cells. At last, at the level of 1 × 10⁶ cells injection, all animals developed tumors. Additionally, all 6 of tumors that grew from injected LV-QKI5 orLV-QKI6 cells were smaller than those from control cells, and tumors that grew from LV-miQKI cells were consistently larger in size than those from control cells (Fig. 4B and C). Therefore, LV-miQKI cells were more tumorigenic than the control cells, while LV-QKI5 or LV-QKI6 cells were less tumorigenic.

Figure 4. QKI inhibits tumor formation and pulmonary metastasis in nude mice. (A) Tumor incidence in mouse xenografts injected with the indicated number of LV-miQKI, LV-QKI5, LV-QKI6, or Tca8113 cells after 6 wk is shown. (B) Representative subcutaneous tumors from mice injected with 1 × 10⁶ cells after 6 wk of transplantation are shown. (C) Tumor volumes from each group (n = 6) were also measured. **P < 0.01 vs control. (D) Representative lung tissue sections of nude mice killed at 6 wk from each group are shown (H&E; original magnification 100×). (E) The number of lung metastatic foci in each group (n = 3) was calculated. Results display the mean ± SD. *P < 0.05, **P < 0.01 vs control.
CSCs usually displayed a strong tendency of tumor metastases.6 To test it, experimental pulmonary metastasis model was employed in which 5 × 10⁵ cells were injected into nude mice via tail vein injection (3 mice per group). After 6 wk, the formation of tumor foci in the lungs was evaluated. Compared with the control group, both LV-QKI5 group and LV-QKI6 group displayed significant fewer numbers of pulmonary metastatic lesions, while LV-miQKI group resulted in significantly increased number of pulmonary metastatic lesions (Fig. 4D and E). Together, these results demonstrated that QKI inhibited tumorigenicity and pulmonary metastasis of OSCC cells in vivo.
QKI impairs tumor initiation and self-renewal by mediating a self-renewal gene, SOX2
As an RNA-binding protein, QKI may function through modulating the expression of its target mRNAs at the post-transcriptional level. To determine the major direct downstream mediator of QKI in tumor initiation and self-renewal, we scrutinized the coding and noncoding regions of stem cell associated genes, which may contain potential QREs and their expressions were also consistently altered upon QKI overexpression or knockdown. SOX2 was selected as one of candidates conforming to the above criteria. First sequence analysis in the 3′UTR of SOX2 denoted that there is one putative QRE region. Second SOX2 expression was negatively regulated by QKI in vitro. Here we provided further in vivo evidence showing that tumor mass derived from QKI overexpression cells displayed weaker SOX2 immunostainings than the controls, strikingly tumors derived from QKI knockdown cells displayed stronger stainings than the controls (Fig. 5A). To exclude the possibility of a cell type-specific effect, SOX2 expression negatively regulated by QKI was also seen in another cell line, FaDu (Fig. 5B).

Figure 5. QKI causes decreased SOX2 expression at mRNA and protein level. (A) Immunostaining of QKI and SOX2 was performed on subcutaneous tumors inoculated with 1 × 10⁶ cells after 6 wk (original magnification 200×). Tumors derived from LV-QKI5 or LV-QKI6 cells displayed lower SOX2 immunostaining than the control, and tumors derived from LV-miQKI cells displayed higher SOX2 immunostaining than the control. (B) Expression of QKI and SOX2 in FaDu cells, and FaDu cells infected with LV-QKI5, LV-QKI6, or LV-miQKI was detected by western blot. (C) Representative data of the expression of SOX2 in adjacent normal mucosa assayed by immunohistochemistry (original magnification 200×). SOX2 was highly expressed in the stratum basale which contained stem cells. (D) Representative QKI and SOX2 expression in oral cancer tissue microarray sections of 50 patients (original magnification 200×). The immunostaining levels of QKI and SOX2 were scored from 0 to 3. (E) Correlation of expression levels of QKI and SOX2 is shown (r = 0.5714, P < 0.01).
Worthy to note that, by use of TMAs with 10 adjacent normal mucosal samples, we found QKI was highly expressed in the stratum spinosum which contained differentiated cells (Fig. 1A), while SOX2 was mainly expressed in the stratum basale co-localizing with the region containing stem cells (Fig. 5C). TMAs analysis of 50 clinical OSCC samples by immunohistochemistry further confirmed the negative association between QKI and SOX2, with relevance rate as 0.57 (Fig. 5D and E).
Lastly we asked if QKI directly downregulated SOX2 expression via regulating its mRNA stability. First LV-miQKI cells and the control cells were treated with 5 µg/ml actinomycin D to inhibit transcription initiation. After 6 h of treatment the stability of the SOX2 mRNA increased significantly in LV-miQKI cells (Fig. 6A), indicating that loss of QKI might prevent the degradation of the SOX2 mRNA. Then, 2 reporter vectors containing the wild-type SOX2 3′UTR with potential QRE and the mutant one without the potential QRE were constructed (Fig. 6B). Forced expression of QKI5 or QKI6 obviously decreased the readings of wild-type SOX2 3′UTR reporter activity, but not the mutant one (Fig. 6C), such results highly suggested that QKI modulated the expression of SOX2 by direct binding to the QRE located in SOX2 3′UTR. Moreover it is necessary to determine whether aberrant QKI reduction drives tumor initiation and self-renewal by activating SOX2, therefore we performed a SOX2 knocking down experiment. As shown in Figure 6D sequence 2# had better effect. As shown in Figure 6E, SOX2 silencing completely abrogated positive effect of QKI knockdown on sphere formation ability in Tca8113 cells. In conclusion, QKI mitigated self-renewal ability of CSCs via repression of SOX2.

Figure 6. QKI inactivates oral CSCs via repression of SOX2. (A) Reduced QKI enhances the mRNA stability of SOX2. LV-miQKI cells and control Tca8113 cells were treated with Actinomycin D at time 0, and RNA was extracted at indicated time to examine the RNA stability. Increased SOX2 mRNA stability was detected in LV-miQKI cells. Data presented here are representative of 3 independent experiments. (B) Scheme of constructs used for dual luciferase assays. The position of the putative QRE sequence in the SOX2 3′UTR is depicted as a gray vertical bar. Sequence of the truncation is given below. (C) QKI regulates SOX2 expression by direct binding to the QRE located in SOX2 3′UTR. pGL3-SOX2 3′UTR WT or pGL3-SOX2 3′UTR TRUNCATION reporter and internal control vector pBind were cotransfected with the indicated plasmids for 24 h before luciferase activity examination. Fold induction was calculated and expressed as means ± SD (n = 3). **P < 0.01. (D) Knockdown efficiency of the 2 different small interfering RNAs targeting SOX2 mRNA levels of SOX2 were quantified by qPCR (left panel) and protein levels of SOX2 were detected by western blot (right panel) at 48 h post-transfection. (E) Representative images of spheres from Tca8113 LV-miQKI cells transfected with control siRNA or siRNA targeting SOX2 (left panel). Experiments were performed in triplicate, and data are shown as mean ± SD *P < 0.05 (right panel).
Discussion
Growing evidence suggests that human cancers belong to be stem cell diseases.22 Cancer cells with the properties of stem cells, known as CSCs, possess the ability to self-renew, and to survive adverse tissue microenvironment.23 However, underlying regulatory mechanisms of CSCs are not fully understood. In this study, we show for the first time that QKI plays an important role in self-renewal and tumorigenicity of CSCs. To evaluate the correlation of QKI with oral CSCs, we analyzed a series of human OSCC samples and different cell lines. We found that QKI expression was much lower in most cancerous tissues than the adjacent normal ones. Endogenous QKI expression was dynamically altered between CSCs and non-CSCs of oral cancer cell lines. Furthermore, overexpression of QKI impaired stem cell characteristics of oral CSCs, whereas knocking down QKI yielded an opposing effect. These findings support our hypothesis that aberrant QKI reduction promotes progression of OSCC through its suppressive effects on CSCs. The mechanism of QKI-mediated repression of OSCC self-renewal is likely due to the direct modulation of downstream target SOX2.
QKI regulates many mRNA target gene expressions at post-transcriptional levels. The expressions of hundreds of genes are regulated by QKI via direct associating with QKI at their 3′UTR region harboring QREs sites with specific AYUAAY sequence.15,24 Many gene products implicated in CSCs have been identified as mRNA targets of QKI, including β-catenin, Ras, Jun, p53, and others.16
In this study, we first disclosed that QKI is normally present in oral mucosa, especially in the region of stratum spinosum-containing differentiated cells, but absent in the stratum basale rich in stem cells. Such differing distribution pattern highly suggested that QKI may inhibit normal stem cell functions. By comparing with neighboring normal tissue, QKI was aberrantly reduced in OSCC tissues correlating with defective differentiated status and enhanced self-renewal ability of cancers. Based on the tumor sphere models derived from oral cancer cell lines, contrary to the highly enriched CSC genes, QKI expression was lowered compared with the non-CSCs. Such dynamic alteration suggested aberrant QKI declining may contribute to the CSC formation. Combining the in vitro and in vivo data, our results highly supported that QKI is indeed a negative regulator of CSCs in oral cancer cells.
Regarding to the regulatory mechanisms mediated by QKI in OSCC-derived CSCs, except some tested targets of QKI based on other functional models, such as β-catenin, Ras, Jun, and p53. We first discovered and demonstrated that an important stem cell regulator SOX2 was the direct target of QKI, which may be responsible for the suppressing effects exerted by QKI in CSCs.
Accumulating evidence suggests that SOX2 acts as an oncogene in some epithelial cancers.25 Interestingly, we found a reverse correlation between QKI and SOX2 expression in clinical OSCC samples, while in normal oral mucosa, SOX2 is mainly present in the stratum basale containing normal stem cells displaying a mutual exclusive pattern with QKI under normal condition. Our study provided substantial evidence to validate that SOX2 is a direct target of QKI in the CSC regulations. Since SOX2 promotes cell proliferation and tumorigenesis by facilitating the G1/S transition through transcriptional regulation of cyclin D1 in breast cancer cells.26 At the same time, QKI overexpression increased the G1 phase percentage and reduced expression of cyclin D1. Collectively, these findings highly suggested a possibility of cyclin D1 inactivation being involved in QKI-mediated repression of oral CSCs. Nevertheless, further investigation is required to determine whether the QKI-SOX2-cyclin D1 pathway contribute to it.
Our previous reports have shown that QKI functions as a suppressor in carcinogenesis through coordinately targeting multiple genes associated with cell growth and differentiation.27-29 As we know, aberrant canonical Wnt signaling pathway via β-catenin activation in stem cells is a key event in tumor initiation of many cancers. Our earlier results as well as others demonstrated that QKI inhibits β-catenin activity via direct binding to its 3′UTR,27,30 implying that QKI possibly, at least in part, regulate stem cell functions via suppressing β-catenin signaling.
Current adjuvant treatment for OSCC may selectively kill the proliferative cancer cells while sparing CSCs, which lead to tumor regrowth and relapse.8,31 Since QKI belong to be an upper level regulator by controlling multiple oncogenes and more than one CSC pathway, restoration of the tumor suppressor QKI might be attractive for OSCC therapy. However it may require further evidence to know how to enhance QKI expression more efficiently in vivo.
Materials and Methods
Cell lines and culture conditions
The oral cancer cell lines Tca8113 and Tb were cultured in 1640 medium (Invitrogen) supplemented with 10% fetal bovine serum (FBS). FaDu cells were kept in DMEM medium (Invitrogen) supplemented with 10% FBS (Invitrogen). All cell lines were maintained at 37 °C in an atmosphere containing 5% carbon dioxide.
Sphere formation assay
Cells were maintained in stem cell media consisting of DMEM/F12 (Gibco) basal media, B27 supplements (Invitrogen), 20 ng/mL human recombinant epidermal growth factor (EGF; Sigma-Aldrich) and 10 ng/mL basic fibroblastic growth factor (bFGF; Sigma-Aldrich), 0.4% BSA (Sigma-Aldrich), and 5 µg/mL insulin (Invitrogen). For the tumorsphere formation assay, cells were plated at a density of 500 cells/well in 24-well ultra-low attachment plates and maintained in stem cell medium. Spheres that arose within 10 d were recorded. For serial sphere formation assays, the spheres were harvested, disaggregated with 0.25% trypsin/EDTA and re-plated as described above. For each cell type, triplicate samples were done and the spheres were counted by 2 individuals in a blind fashion. For qPCR and western blot analysis, cells were plated at a density of 3000 cells/well in 6-well ultra-low attachment plates (Corning), 10–14 d later, spheres were collected and total RNA or protein was extracted.
PCR
Total RNA from different cell lines was extracted using Trizol reagent (Invitrogen). Two micrograms of total RNA was used to prepare the cDNA. For the mRNA decay assay, the cells were cultured in the indicated conditions and further treated with 5 µg/mL actinomycin D at time 0, and RNA was extracted at the indicated time to examine the SOX2 mRNA stability. β-actin was used as an internal control. The qPCR assay was performed using an AB 7500 system and SYBR Green PCR kit (Takara Bio). Relative mRNA levels of different targets were normalized to GAPDH levels and compared with the control using the 2−ΔΔCt. The primer sequences are provided in Table S1.
MTT
To assess cell proliferation, the MTT test was included. Cells were seeded at a density of 2000 cells/well in 96-well plates. After 1, 2, 3, 4, or 5 d of incubation, 3-(4, 5-methylthiazol-2-yl)-2, 5-diphenyl-tetrazolium bromide (MTT; Sigma-Aldrich) was added (100 μg/well) for 4 h incubation at 37 °C. Formazan products were solubilized with DMSO, and the optical density was measured at 570 nm. All experiments were performed in triplicate.
Flow cytometry assay
To analyze the cell cycle distribution, 1 × 10⁶ cells with indicated treatment were washed twice in PBS and fixed for at least 2 h in PBS containing 66.7% ethanol. Cells were spun down gently in 200 μL extraction buffer at 37 °C for 20 min and then re-suspended in PBS containing 50 μg/mL propidium iodide (PI) and 50 μg/mL RNase (Sigma-Aldrich) at 37 °C for 30 min in the dark. Cell cycle distribution was detected by FACS (BD Biosciences).
Apoptosis assay
Fluorescein isothiocyanate (FITC)-conjugated Annexin V and PI were used to identify apoptotic cells. Comparative experiments were performed at the same time by bivariate flow cytometry using a FACScan (BD Biosciences) and analyzed with CellQuest (BD Biosciences) software on data obtained from the cell population.
Immunohistochemistry on tissue microarrays and xenograft tumors
Tumors were fixed in 10% neutralized formalin and embedded in paraffin blocks. Four micrometer sections were prepared for H&E staining and immunohistochemical examination. Tissue microarrays containing 50 OSCC samples and 10 adjacent normal mucosal samples were used. The clinicopathologic characteristics of the 50 OSCC samples are shown in Table S2. Tissue microarrays and xenograft tumor slides were incubated with primary antibody antiQKI (1:150; Abcam) or antiSOX2 (1:150; Cell Signaling) for 24 h at 4 °C. Anti-rabbit peroxidase-conjugated secondary antibodies were applied. Staining of the whole tissue sections was examined and scored by 2 independent observers. The immunostaining levels were scored as 0 (negative), 1 (weakly positive), 2 (moderately positive), or 3 (strongly positive).
Western blot
Cells were lysed in a lysis buffer that contained a protease inhibitor cocktail. The membranes were incubated with antibodies raised against QKI (1:500; Sigma-Aldrich), SOX2 (1:600; Cell Signaling), and β-actin at 4 °C overnight. The secondary antibodies anti-rabbit IgG or anti-mouse IgG were both from Odyssey.
Plasmid construction, virus packaging, and infection
For the construction of the SOX2 3′UTR and the truncation SOX2 3′UTR reporter vectors, the entire SOX2 3′UTR region and the region without the putative QRE were amplified by reverse-transcription (RT)-PCR from the mRNA of normal oral tissue using the primers listed in Table S1. The PCR products were digested with indicated restriction enzymes before being ligated into our previously modified pGL3-control vector, in which restriction enzyme sites EcoRI, EcoRV, NdeI, and PstI are inserted downstream the XbaI site.27 The pcDNA3.1(+)-QKI5 and -6 were constructed as described before.27,32 Stealth small interfering RNAs (siRNA) targeting SOX2 were synthesized by Invitrogen and were dissolved in diethypyrocarbonate treated H2O at a concentration of 20 μmol/L as a stock. The nulceotide sequences are provided in Table S1. QKI overexpression/knockdown lentivirus was constructed by our own laboratory, and infection of QKI overexpression/knockdown lentivirus were performed as previously described.28
Reporter assay
Twenty-four hours after transfection, cells were lysed using passive lysis buffer and analyzed for firefly and Renilla luciferase activities using the dual-luciferase reagent assay kit (Promega) according to the manufacturer’s instructions. Values were expressed as means ± SD from 3 independent experiments.
Nude mice xenograft tumor and pulmonary metastasis model studies
Four-wk-old nude mice were purchased from the Forth Military Medical University Experimental Center. All animal experiments met the requirement of the Forth Military Medical University Animal Care Facility and the National Institutes of Health guidelines. Cells were suspended in 200 μL of DMEM and Matrigel (1:1) (Becton Dickinson) and injected subcutaneously into nude mice. The size and incidence of subcutaneous tumors were recorded every 3 d. Tumor volume was calculated as below: V (mm3) = width2 (mm2) × length (mm) / 2. Mice were killed for evaluation of tumor incidence, tumor size, and immunostaining at the indicated time points. Three 4-wk-old nude mice in each experimental group were injected intravenously with 5 × 10⁵ cells through the tail vein. Six weeks after injection, the lungs were isolated and analyzed. Metastases were quantified under microscope after paraffin embedment and hematoxylin and eosin (H&E) staining. The lung metastases were confirmed by H&E staining under microscopy.
Statistical analysis
Statistical analysis was performed using SPSS 16.0. Associations between QKI protein expression and SOX2 protein expression were assessed by the Pearson χ2 test. Correlation coefficients were assessed by Spearman correlation analysis. Quantitative variables were analyzed by t test. The statistical differences between the groups were analyzed by one-way analysis of variance. Data are presented as mean ± SD. All statistical tests were 2 sided, and P < 0.05 was considered statistically significant.
Supplementary Material
Disclosure of Potential Conflicts of Interest
The authors declare no potential conflicts of interest.
Acknowledgments
This work was supported by the National Science Foundation of China (81030046 and 81070820).
References
- 1.da Silva SD, Ferlito A, Takes RP, Brakenhoff RH, Valentin MD, Woolgar JA, Bradford CR, Rodrigo JP, Rinaldo A, Hier MP, et al. Advances and applications of oral cancer basic research. Oral Oncol. 2011;47:783–91. doi: 10.1016/j.oraloncology.2011.07.004. [DOI] [PubMed] [Google Scholar]
- 2.de Camargo Cancela M, Voti L, Guerra-Yi M, Chapuis F, Mazuir M, Curado MP. Oral cavity cancer in developed and in developing countries: population-based incidence. Head Neck. 2010;32:357–67. doi: 10.1002/hed.21193. [DOI] [PubMed] [Google Scholar]
- 3.Huang SH, O’Sullivan B. Oral cancer: Current role of radiotherapy and chemotherapy. Med Oral Patol Oral Cir Bucal. 2013;18:e233–40. doi: 10.4317/medoral.18772. [DOI] [PMC free article] [PubMed] [Google Scholar]
- 4.Cooper JS, Porter K, Mallin K, Hoffman HT, Weber RS, Ang KK, Gay EG, Langer CJ. National Cancer Database report on cancer of the head and neck: 10-year update. Head Neck. 2009;31:748–58. doi: 10.1002/hed.21022. [DOI] [PubMed] [Google Scholar]
- 5.Lee TK, Castilho A, Cheung VC, Tang KH, Ma S, Ng IO. CD24(+) liver tumor-initiating cells drive self-renewal and tumor initiation through STAT3-mediated NANOG regulation. Cell Stem Cell. 2011;9:50–63. doi: 10.1016/j.stem.2011.06.005. [DOI] [PubMed] [Google Scholar]
- 6.Dalerba P, Clarke MF. Cancer stem cells and tumor metastasis: first steps into uncharted territory. Cell Stem Cell. 2007;1:241–2. doi: 10.1016/j.stem.2007.08.012. [DOI] [PubMed] [Google Scholar]
- 7.Yu F, Yao H, Zhu P, Zhang X, Pan Q, Gong C, Huang Y, Hu X, Su F, Lieberman J, et al. let-7 regulates self renewal and tumorigenicity of breast cancer cells. Cell. 2007;131:1109–23. doi: 10.1016/j.cell.2007.10.054. [DOI] [PubMed] [Google Scholar]
- 8.Zhang Z, Filho MS, Nör JE. The biology of head and neck cancer stem cells. Oral Oncol. 2012;48:1–9. doi: 10.1016/j.oraloncology.2011.10.004. [DOI] [PMC free article] [PubMed] [Google Scholar]
- 9.Zhang Q, Shi S, Yen Y, Brown J, Ta JQ, Le AD. A subpopulation of CD133(+) cancer stem-like cells characterized in human oral squamous cell carcinoma confer resistance to chemotherapy. Cancer Lett. 2010;289:151–60. doi: 10.1016/j.canlet.2009.08.010. [DOI] [PubMed] [Google Scholar]
- 10.Magee JA, Piskounova E, Morrison SJ. Cancer stem cells: impact, heterogeneity, and uncertainty. Cancer Cell. 2012;21:283–96. doi: 10.1016/j.ccr.2012.03.003. [DOI] [PMC free article] [PubMed] [Google Scholar]
- 11.Takahashi K, Yamanaka S. Induction of pluripotent stem cells from mouse embryonic and adult fibroblast cultures by defined factors. Cell. 2006;126:663–76. doi: 10.1016/j.cell.2006.07.024. [DOI] [PubMed] [Google Scholar]
- 12.Hussenet T, du Manoir S. SOX2 in squamous cell carcinoma: amplifying a pleiotropic oncogene along carcinogenesis. Cell Cycle. 2010;9:1480–6. doi: 10.4161/cc.9.8.11203. [DOI] [PubMed] [Google Scholar]
- 13.Freier K, Knoepfle K, Flechtenmacher C, Pungs S, Devens F, Toedt G, Hofele C, Joos S, Lichter P, Radlwimmer B. Recurrent copy number gain of transcription factor SOX2 and corresponding high protein expression in oral squamous cell carcinoma. Genes Chromosomes Cancer. 2010;49:9–16. doi: 10.1002/gcc.20714. [DOI] [PubMed] [Google Scholar]
- 14.Biedermann B, Hotz HR, Ciosk R. The Quaking family of RNA-binding proteins: coordinators of the cell cycle and differentiation. Cell Cycle. 2010;9:1929–33. doi: 10.4161/cc.9.10.11533. [DOI] [PubMed] [Google Scholar]
- 15.Hafner M, Landthaler M, Burger L, Khorshid M, Hausser J, Berninger P, Rothballer A, Ascano M, Jr., Jungkamp AC, Munschauer M, et al. Transcriptome-wide identification of RNA-binding protein and microRNA target sites by PAR-CLIP. Cell. 2010;141:129–41. doi: 10.1016/j.cell.2010.03.009. [DOI] [PMC free article] [PubMed] [Google Scholar]
- 16.Galarneau A, Richard S. Target RNA motif and target mRNAs of the Quaking STAR protein. Nat Struct Mol Biol. 2005;12:691–8. doi: 10.1038/nsmb963. [DOI] [PubMed] [Google Scholar]
- 17.Chénard CA, Richard S. New implications for the QUAKING RNA binding protein in human disease. J Neurosci Res. 2008;86:233–42. doi: 10.1002/jnr.21485. [DOI] [PubMed] [Google Scholar]
- 18.Wang X, Sun W, Bai J, Ma L, Yu Y, Geng J, Qi J, Shi Z, Fu S. Growth inhibition induced by transforming growth factor-beta1 in human oral squamous cell carcinoma. Mol Biol Rep. 2009;36:861–9. doi: 10.1007/s11033-008-9256-x. [DOI] [PubMed] [Google Scholar]
- 19.O’Brien CA, Kreso A, Ryan P, Hermans KG, Gibson L, Wang Y, Tsatsanis A, Gallinger S, Dick JE. ID1 and ID3 regulate the self-renewal capacity of human colon cancer-initiating cells through p21. Cancer Cell. 2012;21:777–92. doi: 10.1016/j.ccr.2012.04.036. [DOI] [PubMed] [Google Scholar]
- 20.Dontu G, Jackson KW, McNicholas E, Kawamura MJ, Abdallah WM, Wicha MS. Role of Notch signaling in cell-fate determination of human mammary stem/progenitor cells. Breast Cancer Res. 2004;6:R605–15. doi: 10.1186/bcr920. [DOI] [PMC free article] [PubMed] [Google Scholar]
- 21.Clarke MF, Dick JE, Dirks PB, Eaves CJ, Jamieson CH, Jones DL, Visvader J, Weissman IL, Wahl GM. Cancer stem cells--perspectives on current status and future directions: AACR Workshop on cancer stem cells. Cancer Res. 2006;66:9339–44. doi: 10.1158/0008-5472.CAN-06-3126. [DOI] [PubMed] [Google Scholar]
- 22.Gupta PB, Chaffer CL, Weinberg RA. Cancer stem cells: mirage or reality? Nat Med. 2009;15:1010–2. doi: 10.1038/nm0909-1010. [DOI] [PubMed] [Google Scholar]
- 23.Pang R, Law WL, Chu AC, Poon JT, Lam CS, Chow AK, Ng L, Cheung LW, Lan XR, Lan HY, et al. A subpopulation of CD26+ cancer stem cells with metastatic capacity in human colorectal cancer. Cell Stem Cell. 2010;6:603–15. doi: 10.1016/j.stem.2010.04.001. [DOI] [PubMed] [Google Scholar]
- 24.Teplova M, Hafner M, Teplov D, Essig K, Tuschl T, Patel DJ. Structure-function studies of STAR family Quaking proteins bound to their in vivo RNA target sites. Genes Dev. 2013;27:928–40. doi: 10.1101/gad.216531.113. [DOI] [PMC free article] [PubMed] [Google Scholar]
- 25.Sarkar A, Hochedlinger K. The sox family of transcription factors: versatile regulators of stem and progenitor cell fate. Cell Stem Cell. 2013;12:15–30. doi: 10.1016/j.stem.2012.12.007. [DOI] [PMC free article] [PubMed] [Google Scholar]
- 26.Chen Y, Shi L, Zhang L, Li R, Liang J, Yu W, Sun L, Yang X, Wang Y, Zhang Y, et al. The molecular mechanism governing the oncogenic potential of SOX2 in breast cancer. J Biol Chem. 2008;283:17969–78. doi: 10.1074/jbc.M802917200. [DOI] [PubMed] [Google Scholar]
- 27.Yang G, Fu H, Zhang J, Lu X, Yu F, Jin L, Bai L, Huang B, Shen L, Feng Y, et al. RNA-binding protein quaking, a critical regulator of colon epithelial differentiation and a suppressor of colon cancer. Gastroenterology. 2010;138:231–40, e1-5. doi: 10.1053/j.gastro.2009.08.001. [DOI] [PMC free article] [PubMed] [Google Scholar]
- 28.Zhao Y, Zhang G, Wei M, Lu X, Fu H, Feng F, Wang S, Lu W, Wu N, Lu Z, et al. The tumor suppressing effects of QKI-5 in prostate cancer: a novel diagnostic and prognostic protein. Cancer Biol Ther. 2014;15:108–18. doi: 10.4161/cbt.26722. [DOI] [PMC free article] [PubMed] [Google Scholar]
- 29.Bian Y, Wang L, Lu H, Yang G, Zhang Z, Fu H, Lu X, Wei M, Sun J, Zhao Q, et al. Downregulation of tumor suppressor QKI in gastric cancer and its implication in cancer prognosis. Biochem Biophys Res Commun. 2012;422:187–93. doi: 10.1016/j.bbrc.2012.04.138. [DOI] [PubMed] [Google Scholar]
- 30.Ji S, Ye G, Zhang J, Wang L, Wang T, Wang Z, Zhang T, Wang G, Guo Z, Luo Y, et al. miR-574-5p negatively regulates Qki6/7 to impact β-catenin/Wnt signalling and the development of colorectal cancer. Gut. 2013;62:716–26. doi: 10.1136/gutjnl-2011-301083. [DOI] [PMC free article] [PubMed] [Google Scholar]
- 31.Alison MR, Lin WR, Lim SM, Nicholson LJ. Cancer stem cells: in the line of fire. Cancer Treat Rev. 2012;38:589–98. doi: 10.1016/j.ctrv.2012.03.003. [DOI] [PubMed] [Google Scholar]
- 32.Chen Y, Tian D, Ku L, Osterhout DJ, Feng Y. The selective RNA-binding protein quaking I (QKI) is necessary and sufficient for promoting oligodendroglia differentiation. J Biol Chem. 2007;282:23553–60. doi: 10.1074/jbc.M702045200. [DOI] [PubMed] [Google Scholar]
Associated Data
This section collects any data citations, data availability statements, or supplementary materials included in this article.