

Abstract
Background
Prognosis of long-term motor outcome of acute stroke patients with severe motor impairment has proven difficult.
Objective
Our primary goal was to evaluate the prognostic value of corticospinal tract (CST) injury on motor outcome of the upper limb compared to motor impairment level and lesion volume.
Methods
Ten acute stroke patients with moderately severe to severe motor impairment of the upper limb underwent diffusion tensor imaging (DTI) and testing of upper limb strength and dexterity at acute, subacute and chronic post-stroke time-points. A density-weighted CST atlas was constructed using DTI-tractography data from normal subjects. This CST atlas was applied, using a largely automated process, to DTI data from patients to quantify CST injury at each time-point. Differences in axial diffusivity (AD), radial diffusivity (RD) and fractional anisotropy (FA) of the ipsilesional CST relative to the contralesional CST were measured.
Results
Acute loss in CST AD correlated most strongly and significantly with subacute and chronic strength and dexterity, and remained significant after adjusting for acute motor impairment or lesion volume. Subacute loss in CST FA correlated most strongly with chronic dexterity, whereas subacute behavioral measures of limb strength correlated most strongly with chronic strength measures.
Conclusions
Loss in acute CST AD and subacute CST FA are strong prognostic indicators of future motor functions of the upper limb for stroke patients with substantial initial motor impairment. DTI-derived measure of CST injury early after stroke may have utility in healthcare planning and in design of acute stroke clinical trials.
Keywords: stroke, motor recovery, diffusion tensor imaging (DTI), corticospinal tract (CST), upper limb, motor impairment, strength, dexterity, prognosis, prediction
INTRODUCTION
Acute stroke often causes upper limb paresis ranging in severity from mild to severe. Most patients experience some degree of motor recovery over time, with final motor outcome typically achieved within six months.1, 2 For acute stroke patients with mild to moderate motor impairment of the upper limb, motor outcome is well predicted by the initial level of impairment measured by behavioral tests.1, 3–5 However, for acute patients with severe motor impairment of the limb, motor outcome is only weakly predicted by initial impairment level, with approximately equal numbers achieving good motor and poor outcome.4–6 An accurate prognostic indicator for acute stroke patients with severe motor impairment could have substantial utility in discharge and rehabilitation planning and in the design of acute stroke clinical trials.
As the corticospinal tract (CST) is a brain structure critical to voluntary movement of the upper limb, the severity of stroke-induced injury to the CST would be expected to affect motor outcome of the limb. Transcranial magnetic stimulation studies of the neurophysiological status of the CST in acute stroke patients with severe motor impairment of the upper limb have shown that motor outcome is generally better if motor evoked potentials (MEPs) can be elicited in the affected hand, than if MEPs are absent.7, 8 However, some severely impaired acute stroke patients with absent MEPs make substantial recovery,9, 10 indicating that accurate prognosis on a per patient basis requires an alternative approach. Diffusion tensor imaging (DTI) is a noninvasive magnetic resonance imaging (MRI) technique that can be used to assess structural integrity of the CST. Greater proximity between the CST, localized by DTI-tractography, and an acute infarct is associated with poorer motor outcome.11–14 Quantitative DTI studies in patients early after stroke have shown that greater loss in diffusion anisotropy of selected regions of the CST is associated with poorer motor outcome.13, 15–21 However, among these prior DTI studies, only a few restricted enrollment to stroke patients with severe motor impairment,13, 16, 22 the subset of patients for whom behavioral testing is an inadequate prognostic tool. Also, only one prior study compared the prognostic value of CST injury to initial motor impairment.21 Therefore, it is unclear if motor outcome of acute stroke patients with severe motor impairment is better predicted by a DTI-derived measure of CST injury than initial motor impairment.
Toward addressing this gap in knowledge, the current exploratory study assessed the prognostic value of DTI-derived measures of CST injury in acute stroke patients with moderately severe to severe motor impairment, relative to behavioral measure of motor impairment and lesion volume (i.e., a cruder measure of brain injury). The vast majority of DTI studies of stroke-induced injury to the CST have quantified tract injury by the loss in fractional anisotropy (FA), a diffusion anisotropy metric reflecting the relative magnitude of principal diffusivities.23 Since each principal diffusivity undergoes time-varying changes in ischemic and spared white matter after acute stroke,24 it is possible that change in a principal diffusivity of the CST might be more tightly linked to motor outcome than FA. Accordingly, we explored the relative prognostic value of FA and principal diffusivities of the CST. Furthermore, with an eye toward future clinical utility, we sought to develop an automated process for measuring CST injury, rather than relying on manual delineation of CST regions of interest in the DTI data, the time- and expertise-demanding approach typically used now.
METHODS
Study Design
Stroke patients participated in serial testing of motor function of the upper limb and MRI at 3–7 days (S1, acute), 1–2 months (S2, subacute) and 6–7 months (S3, chronic) after stroke onset.
Subjects
Ten patients with at least moderately severe motor impairment of the upper limb due to acute ischemic stroke in the middle cerebral artery (MCA) territory were enrolled (Table 1). In addition, 12 healthy adults with no history of stroke were enrolled for MRI in order to create a CST atlas. Details regarding subjects are provided in the Supplementary Text, Part I.
TABLE 1.
Patient Characteristics
| Patient | Age | Gender | Premorbid Handedness | Admission NIHSS | Stroke Characteristics | ||||
|---|---|---|---|---|---|---|---|---|---|
| Total | Motor Arm | Hemisphere | Location | Etiology (CCS) | Medical Intervention | ||||
| 1 | 19 | F | R | 13 | 4 | R | > 1/3 MCA territory | Other (cryptogenic) | IV rTPA and IA therapy |
| 2 | 52 | F | R | 13 | 4 | R | > 1/3 MCA territory | Other (CAD) | |
| 3 | 55 | F | R | 19 | 3 | L | > 1/3 MCA territory | Other (CAD) | |
| 4 | 64 | M | R | 14 | 4 | R | > 1/3 MCA territory | Other (CAD) | |
| 5 | 50 | F | R | 17 | 4 | R | > 1/3 MCA territory | Cardio-aortic embolism | IV rTPA and IA therapy |
| 6 | 49 | M | R | 13 | 4 | L | > 1/3 MCA territory | Large artery atherosclerosis | |
| 7 | 62 | M | R | 6 | 1 | R | Precentral and postcentral gyri, temporal lobe | Large artery atherosclerosis | IV rTPA |
| 8 | 59 | M | R | 13 | 4 | R | CR, IC, BG, insula | Large artery atherosclerosis | IV rTPA and carotid endarterectomy |
| 9 | 49 | M | R | 9 | 4 | R | CR, IC | Small artery occlusion | |
| 10 | 67 | F | R | 4 | 1 | R | CR, IC, BG | Large artery atherosclerosis | IV rTPA |
M = male; F = female; R = right; L = left; CCS = Causative Classification System; CAD = carotid artery dissection; CR = corona radiata; IC = internal capsule; BG = basal ganglia; IV rTPA = intravenous recombinant tissue plasminogen activator; IA = intra-arterial
Motor Function Testing
Motor function of the upper limb was assessed by: 1) Grip strength of the paretic hand relative to the contralateral hand measured by digital dynamometry;25 2) Upper limb section of the Motricity Index (MI; scale 1 – 100); and 3) Dexterity of the paretic hand relative to the contralateral hand measured by the Nine Hole Peg Test26 (NHPT). Details regarding motor function testing are provided in the Supplementary Text, Part II.
Image Acquisition and Analysis
Acquisition
A Siemens 3T TIM Trio MRI scanner and 12-channel head coil were used for imaging. Imaging parameters are provided in Supplementary Text, Part III.
Preprocessing
The DTI data were processed using standard procedures (Supplementary Text, Part IV) to generate images of each eigenvalue (λ1, λ2, and λ3), FA, apparent diffusion coefficient (ADC), mean B0 and mean DWI. The dominant diffusivity λ1 is also known as axial diffusivity (AD). The mean of perpendicular diffusivities λ2 and λ3 was computed and is known as radial diffusivity (RD).
CST Diffusion
Figure 1 shows the density-weighted CST atlas in MNI space. Details on atlas construction are provided in the Supplementary Text, Part V.
Figure 1.
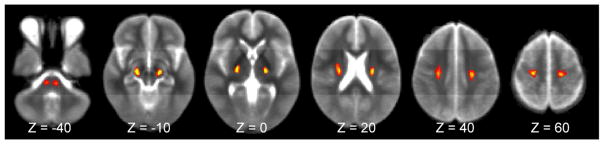
Density-weighted CST atlas in MNI152 space. Several axial (z-level) images from the level of the pons to precentral gyrus are shown. Voxels are color-coded for the relative density (scale of 0–100) of CST streamlines based on tractography of DTI data from healthy subjects.
The CST atlas was used to measure CST injury in each patient at each session by the following process. Using nonlinear registration software27 from FMRIB’s FSL Library,28, 29 each B0 volume was spatially normalized to the T2-weighted MNI152 brain with abnormal hyperintense voxels masked to eliminate them from the registration optimization process. Visual inspection of each registered B0 volume showed good alignment to the MNI152 brain even for brains with structural distortion due to edema at S1 or atrophy at S3. The density-weighted CST atlas was warped from MNI152 space to each native diffusion space by inverting the aforementioned registration matrix. At each transverse slice along the length of the ipsilesional CST and contralesional CST, the 10 voxels with the highest CST density were selected. Voxels in ventricular space were removed from the high-density CSTs, while voxels in regions of cavitation were retained; details of this process are provided in the Supplementary Text, Part VI. The mean of each diffusion metric of interest (AD, RD, FA) was computed across the ipsilesional and contralesional high-density CST voxels at each transverse slice. To account for individual differences in brain size, each diffusion measurement series was brought into spatial correspondence by interpolating to 60 points. Each 60-point series was smoothed by replacing each value with the mean of itself ± 2 adjacent points. Since there are age-related changes in white matter diffusion that are roughly symmetric between the hemispheres,30 we minimized the impact of patient age on estimates of CST injury by subtracting each diffusion measurement of the ipsilesional CST from the corresponding point of the contralesional CST. Finally, each set of 60 delta measurements was summed to provide overall measures of AD, RD and FA of the ipsilesional CST relative to the contralesional CST which we hereafter refer to as CST ΔAD, ΔRD and ΔFA, respectively. Positive values indicate stroke-induced increases in the diffusion metric of the ipsilesional CST relative to the contralesional CST, and negative values indicate stroke-induced decreases.
Lesion Volume
Lesion volume at S1 was measured using the DWI and at S2 using the FLAIR image. Abnormal hyperintense voxels were labeled manually in native image space. Volumes were calculated by multiplying the number of labeled voxels by voxel volume.
Statistical Analysis
An abnormality in CST diffusion (ΔAD, ΔRD and ΔFA) at S1 was evaluated using the one-sample Wilcoxon Signed-Rank test. Mixed-model analysis was used to test for an effect of time on each motor function and each CST diffusion metric, with Bonferroni- corrected Wilcoxon Signed-Rank test used for post-hoc testing. Spearman’s correlation was used to measure the strength of association between two variables, and Spearman’s partial correlation was used when adjusting for a covariate. Alpha was set at the two-tailed 0.05 level for all statistical testing. All testing was conducted using JMP software (SAS Institute Inc., v. 8.0.2).
RESULTS
Motor Function
Figure 2 shows measures of motor function (grip, MI, NHPT) at S1–S3. Patients made significant gains in grip strength and MI over time (each P < 0.001), with significant increases from S1 to S2 and S2 to S3 for both motor functions. Dexterity, measured by the NHPT, did not improve significantly over time (P = 0.11).
Figure 2.
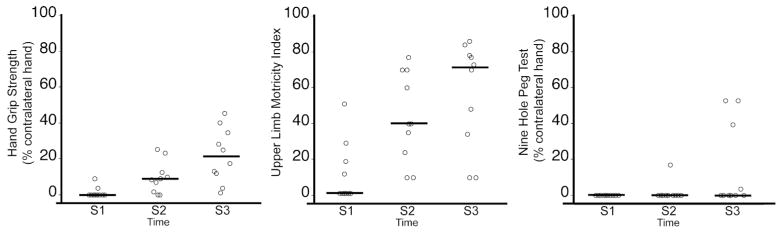
Motor functions of the paretic upper limb of stroke patients (N = 10) at the acute (S1), subacute (S2) and chronic (S3) study time-points. Symbols have been shifted along x-axis to allow easier visualization. The line at each time-point represents the median. Patients made significant gains in grip (P < 0.001, mixed model analysis) and Motricity Index (P < 0.001), but not the Nine Hole Peg Test (P = 0.11) over time.
CST Diffusion
Figure 3 shows measures of CST diffusion at S1–S3. At S1, there was a significant loss in CST ΔAD (P < 0.001) and CST ΔFA (P < 0.001), but not CST ΔRD. Patients showed significant change in CST ΔAD over time (P < 0.001), with significant increases from S1 to S3 and S2 to S3. CST ΔRD changed significantly over time (P < 0.001), increasing significantly from S1 to S2 and S2 to S3. CST ΔFA also changed significantly over time (P < 0.001), decreasing significantly from S1 to S2 and S1 to S3.
Figure 3.
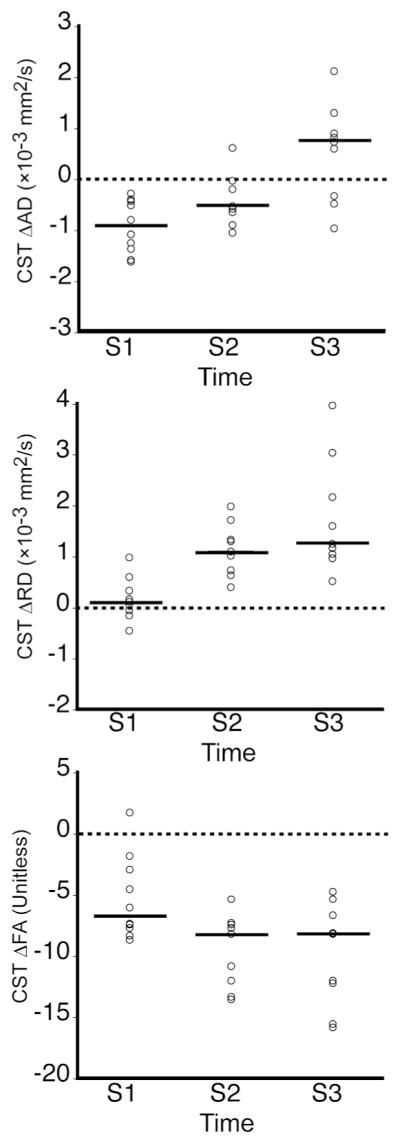
CST diffusion (ΔAD, ΔRD, ΔFA) at S1–S3. The line at each time-point represents the median. Patients had significant losses in CST ΔAD (P < 0.001, one-sample Wilcoxon Signed Rank test) and CST ΔFA (P < 0.001), but not CST ΔRD at S1. There were significant changes over time in CST ΔAD, ΔRD and ΔFA (each P < 0.001, mixed model analysis).
Correlations
We first examined the strength of association between motor outcomes at S2 (i.e., grip, MI, NHPT) and each potential predictor measured at S1 (i.e., CST diffusion, respective motor function, DWI lesion volume). Figure 4 A–C shows that among S1 potential predictors, only CST ΔAD correlated significantly with S2 grip. Confidence and prediction intervals about the regression line relating S1 CST ΔAD to S2 motor functions grip and MI are provided in the Supplementary Text, Part VII. NHPT did not correlate significantly with any S1 potential predictor. The correlations between S1 CST ΔAD and S2 grip and MI remained significant after adjusting for S1 motor function, S1 DWI lesion volume, S1 testing day or age (Table 2). These findings suggest that acute loss in AD of the CST is a strong predictor of subacute grip and overall strength of the paretic upper limb.
Figure 4.

Correlation between motor outcomes and potential predictors. A–C. S1 potential predictors of motor functions at S2. D–F. S1 potential predictors of motor functions at S3. G–I. S2 potential predictors of motor functions at S3. S1 LV = DWI lesion volume. S2 LV = FLAIR lesion volume. Values are Spearman’s correlation coefficients, absolute rs. * P < 0.05, ** P < 0.01, *** P < 0.001.
TABLE 2.
Results of Correlation and Partial Correlation Analyses
| Correlation | Covariate
|
|||||||
|---|---|---|---|---|---|---|---|---|
| Age | Motor Function | Lesion Volume | S1 Day | |||||
| S1 DWI | S2 FLAIR | |||||||
| S1 CST ΔAD vs S2 Grip | 0.88 *** | (0.50 0.97) | 0.88 *** | 0.87 ** | (S1 Grip) | 0.93 *** | 0.89 *** | |
| S1 CST ΔAD vs S2 MI | 0.88 *** | (0.52 0.97) | 0.90 *** | 0.86 ** | (S1 MI) | 0.90 *** | 0.88 *** | |
| S1 CST ΔAD vs S2 NHPT | 0.52 | (−0.22 0.88) | 0.55 | 0.52*⋄ | (S1 NHPT) | 0.51 | 0.58 | |
| S1 CST ΔAD vs S3 Grip | 0.85 ** | (0.44 0.97) | 0.91 *** | 0.84 ** | (S1 Grip) | 0.85 ** | 0.87 ** | |
| S1 CST ΔAD vs S3 MI | 0.97 *** | (0.84 0.99) | 0.97 *** | 0.96 *** | (S1 MI) | 0.97 *** | 0.97 *** | |
| S1 CST ΔAD vs S3 NHPT | 0.87 *** | (0.50 0.97) | 0.87 *** | 0.87 ***⋄ | (S1 NHPT) | 0.87 *** | 0.88 *** | |
| S2 CST ΔFA vs S3 Grip | 0.70 * | (0.00 0.94) | 0.78 ** | 0.12 | (S2 Grip) | 0.71 * | ||
| S2 CST ΔFA vs S3 MI | 0.87 ** | (0.47 0.98) | 0.90 *** | 0.37 | (S2 MI) | 0.88 *** | ||
| S2 CST ΔFA vs S3 NHPT | 0.79 * | (0.19 0.96) | 0.79 * | 0.82 ** | (S2 NHPT) | 0.79 * | ||
Values are Spearman’s correlations, in rs, between CST diffusion (at S1 or S2) and motor function (at S2 or S3) with no additional covariate (column 2, 95% confidence interval in parentheses) or adjusted for a covariate (columns 3 – 8). Motor function covariates (column 4) are in parentheses. Empty cells are correlations not tested.
non-partialled correlation because no variability in S1 NHPT scores.
P < 0.05,
P < 0.01,
P < 0.001
We next examined the strength of association between S3 motor outcomes and each S1 potential predictor. Figure 4D–F shows that S1 CST ΔAD correlated significantly with S3 grip, MI and NHPT. Confidence and prediction intervals about the regression line relating S1 CST ΔAD to these S3 motor functions are provided in the Supplementary Text, Part VII. The correlation between S1 CST ΔAD and each S3 motor function remained significant after adjusting for each covariate considered above (Table 2). These findings, together with the observed correlations between S1 CST ΔAD and S2 motor outcomes described above, suggest that the prognostic value of acute loss in CST AD extends from the subacute to the chronic post-stroke period, and from gross to fine motor functions.
Next, we examined the strength of association between S3 motor outcomes and potential predictors measured at S2 (i.e., CST diffusion, respective motor function, FLAIR lesion volume). Figure 4G–I shows that S2 grip and MI, but not NHPT, correlated strongly and significantly with their respective S3 motor function. Among the diffusion measures of S2 CST injury, CST ΔFA correlated most strongly and significantly with each S3 motor function. The correlation between S2 CST ΔFA and S3 grip, as well as between S2 CST ΔFA and S3 MI remained significant when adjusted for age or FLAIR lesion volume (Table 2). However, given the strong correlation between S2 grip and S3 grip, as well as between S2 MI and S3 MI (each rs = 0.88), the correlations between S2 CST ΔFA and S3 motor functions grip and MI were no longer significant after adjusting for the respective S2 motor function. The correlation between S2 CST ΔFA and S3 NHPT remained significant after adjusting for each considered covariate. These findings suggest that while subacute loss in CST FA does not improve prognosis of chronic grip and MI, it is a better prognostic indicator of chronic dexterity than behavioral measure of dexterity.
The findings described above led us to examine the basis of acute CST ΔAD and subacute CST ΔFA being good predictors of future motor functions (see Supplementary Text, Part VIII). Analyses revealed that among the three measures of CST injury at S1, CST ΔAD correlates most strongly with S2 CST ΔRD and ΔFA, the measures of S2 CST injury that correlate strongly with S2 grip and S2 MI (Supplementary Table 1 and 2). S1 CST ΔAD also correlates most strongly with S3 CST ΔFA, the strongest correlate of S3 motor functions. Similarly, among the measures of CST injury at S2, CST ΔFA correlates most strongly with S3 CST ΔFA, the strongest correlate of S3 grip, MI and NHPT. These results suggest that the strong prognostic value of acute CST ΔAD and subacute CST ΔFA for future motor functions is because they are the best surrogates of future measures of CST injury.
Lastly, given our interest in assessing the clinical utility of our DTI-based prognostic method, we evaluated the effect on correlations between motor outcomes and CST injury measured using DTI data downsampled from 60 to 30 directions, as halving the number of diffusion directions would halve imaging time and thereby may make DTI more easily tolerated by acute stroke patients (see Supplementary Text, Part IX). We found that correlations strength based on the 30-direction data were quite similar to those based on the original 60-direction data (Supplementary Table 3). Accordingly, as suggested based on the 60-direction data, our method may have clinical utility for prognosis of motor outcomes of acute and subacute stroke patients.
DISCUSSION
Prognosis of motor outcome of acute stroke patients with severe motor impairment has proven difficult. The current study explored the prognostic value of DTI-derived measures of CST injury in acute patients 3–7 days after stroke onset with moderately severe to severe motor impairment of the upper limb. We found that acute CST injury, measured by loss in AD of the ipsilesional CST relative to the contralesional CST (i.e., CST ΔAD), strongly and significantly correlated with subacute grip and overall upper limb strength (i.e., MI) as well as chronic grip, overall limb strength and dexterity (i.e., NHPT) (Figure 4). In contrast, motor outcomes did not correlate significantly with the other measures of acute CST injury (ΔFA, ΔRD), acute motor impairment, or acute lesion volume. Moreover, the significant correlations between acute CST ΔAD and motor outcomes remained significant after accounting for acute motor impairment, lesion volume or other potentially relevant covariates (i.e., age, post-stroke day of acute testing; Table 2). These findings suggest that CST ΔAD in patients 3–7 days after stroke onset is a strong prognostic indicator of motor outcome.
While our results suggest that acute CST ΔAD has strong prognostic value, the majority of prior DTI studies in humans have used the FA metric to quantify white matter injury. Motor outcome has been shown to associate strongly with progressive loss in FA of the CST measured serially over the first few weeks to months after stroke15, 17, 19 and with FA of the CST measured at approximately 2 weeks after stroke.31 We found that CST ΔFA at 3–7 days after stroke onset correlates weakly to moderately with motor outcomes (range in rs = 0.07 – 0.62; Figure 4), consistent with prior reports that CST FA at a single time-point within the first week after stroke has limited value in predicting long-term motor outcome.18, 32 Together, these findings suggest that motor outcome is only weakly to moderately predicted within the first week after stroke by FA of the CST, yet can be strongly predicted by AD. However, Yu et al. reported that neither AD or FA of the CST measured within one week of stroke correlated significantly with 1-year Motricity Index.19 There are several possible reasons for the partial discrepancy between our results and those of Yu et al., including different methods for measuring CST injury. A recent DTI study in patients with amyotrophic lateral sclerosis showed that AD of the CST, but not FA, differentiated clinical phenotypes.33 Furthermore, AD but not FA of white matter involved in transmitting information about visual motion differentiates adults with or without susceptibility to motion-induced nausea.34 Collectively, these studies suggest that AD of functionally-relevant white matter tracts can provide greater clinical insight about some neurological conditions compared to FA.
Our acute stroke patients had at least moderately severe motor impairment, and thus patients for whom prognosis of motor outcome is currently difficult. Previous DTI studies that similarly restricted enrollment to patients with severe motor impairment have suggested the prognostic value of CST injury.13, 16, 22 However, CST injury in these studies was measured over a wide post-stroke period (~5–30 days), whereas our measurements were generally made earlier (3–7 days). Our earlier measurement translates into increased potential that our prognostic biomarker may have clinical utility for severely-impaired, acute stroke patients. A recent study by Puig et al. that enrolled acute patients with mild to severe motor impairment found that 90-day motor outcome was predicted strongly at <12 hours by whether or not the CST is damaged,21 consistent with our findings. However, at 3 days, the level of motor impairment was found to have strong explanatory value and information about CST damage added little. These later findings of Puig et al. may appear inconsistent with ours; however about 50% of their patients at 3 days post-stroke were mildly impaired, whereas all of our patients at 3–7 days post-stroke had at least moderately severe motor impairment. Since motor outcome of acute stroke patients with mild impairment is well predicted by the level of impairment,1, 3–5 the prognostic value of CST damage for the Puig et al. 3-day patients may have been minimized. Combined, these findings suggest that the value of acute CST injury for predicting motor outcome increases with greater acute motor impairment.
Our study also explored the prognostic value of DTI-derived measures of CST injury in subacute patients (1–2 months after stroke onset) for predicting chronic motor functions (6–7 months after stroke onset). We found that subacute CST injury, measured by loss in FA of the ipsilesional CST relative to the contralesional CST (CST ΔFA), had stronger prognostic value for predicting chronic dexterity (i.e., NHPT) than subacute behavioral measure of dexterity, whereas chronic grip and overall limb strength (i.e., MI) were sufficiently well predicted by their respective subacute behavioral measure (Figure 4 and Table 2). The differential prognostic value of subacute CST injury among the three motor functions may stem from the fact that all of our patients had severe impairment in dexterity at the subacute time-point, whereas many fewer subacute patients had severe impairment in grip and overall limb strength (Figure 2). Accordingly, as suggested above regarding acute prognoses, the value of subacute CST injury for predicting motor outcome may increase with greater subacute motor impairment.
It is noteworthy that the DTI-derived measure of CST injury that correlated most strongly with future motor functions was ΔAD at the acute time-point, while ΔFA at the subacute time-point. These findings prompt several interrelated questions. First, why might these early measures of CST injury strongly predict later motor functions? Our analysis suggests that among the measures of CST injury considered, acute CST ΔAD and subacute CST ΔFA are the best surrogates of future CST injury, and thereby best predictors of later motor functions (Supplementary Text VIII, Supplementary Tables 1 and 2).
Second, why might CST ΔAD be the best indicator of acute CST injury compared to ΔRD and ΔFA? Toward understanding this finding, it should be kept in mind that our measures of CST injury reflect diffusion abnormalities along the ipsilesional CST from the precentral gyrus to pons, thus involving both ischemic and spared regions. At 3–7 days after stroke onset, all of our patients had a loss in CST ΔAD, whereas the direction of change in CST ΔRD was variable, reduced in 7 patients and elevated in 3 patients (Figure 3). These findings are compatible with prior reports that ischemic white matter undergoes progressive reductions in AD over the first few weeks after stroke, whereas RD initially drops then rises over this time period, diffusivity changes likely resulting from membrane failure then disrupted cell structure.24, 35–37 Also over the first few weeks after stroke, spared ipsilesional CST undergoes progressive reductions in AD and later elevations in RD,15, 19 corresponding to earlier degeneration of axonal fibers than myelin sheaths.38, 39 Given the time-varying changes in RD of ischemic and spared CST regions, CST ΔRD may be an unstable indicator of CST injury at 3–7 days after stroke onset. Furthermore, since the FA metric incorporates the magnitude of radial diffusivity, CST ΔFA may be rendered an unstable indicator of CST injury at 3–7 days. On the other hand, the consistent losses in AD of ischemic and spared CST regions early after stroke may underlie CST ΔAD being a good indicator of CST injury at 3–7 days post-stroke.
Third, why might CST ΔFA be the best indicator of subacute CST injury compared to CST ΔAD and ΔRD? AD of ischemic white matter begins to rise and RD continues to rise during the subacute period, reflecting accumulation of water that freely diffuses in cystic spaces that replaces necrotic tissue.40 In spared CST regions, reductions in AD and elevations in RD continue, largely due to further degeneration of axonal fibers and myelin, respectively.17, 19, 41 We propose that since there are no highly time-varying changes in diffusivities of the CST during the 1–2 months post-stroke period, like those in RD during the 3–7 day period, the FA metric that incorporates both axial and radial diffusivities may be the best indicator of subacute CST injury. The inherent noisiness of diffusion-weighted images can be mitigated by using the FA metric,42 which may contribute to CST ΔFA being a good indicator of subacute CST injury.
A parallel aim of our exploratory study was to set the technical groundwork for future clinical utility of our DTI-based method for prognosis of motor outcome in acute and subacute stroke patients. Our method involves a density-weighted CST atlas that was constructed using DTI-tractography data from normal subjects. This atlas could be made publically available after future verification of our method. The atlas was utilized to measure CST injury in patients by a process that is currently automated except for two steps. The first of these is manual labeling of abnormally hyperintense voxels in B0 images. With recent advances in automated delineation of ischemic tissue,43, 44 manual labeling could be obviated in the future. Our process also currently involves visual assessment of automatically defined high-density CST voxels, and manual removal of voxels that erroneously extend into cerebrospinal fluid and/or temporal lobe in the cerebral peduncle region, which occurred in a few patients. An automated strategy could be selection of fewer than the default number of 10 highest density CST voxels in the cerebral peduncle region. Clinical application of our method would also require development of automated quality control, rather than visual and subjective assessments. We showed that prognostic strengths of acute CST ΔAD and subacute ΔFA were essentially unchanged when measured using the original high-resolution (60-direction) DTI data compared to the downsampled, lower resolution (30-direction) DTI data (Supplementary Table 3). The lower resolution DTI data would have taken about 5 minutes to acquire, comparable to the duration of current imaging protocols that acute patients typically tolerate well, further supporting the potential clinical utility of our prognostic approach.
Our study has several strengths and limitations. Its strengths include examining the relative prognostic strength of several diffusion metrics, not simply the commonly used FA metric. Furthermore, it is a serial study that evaluated the value of several DTI-derived measures of CST injury at acute and subacute time-points for predicting multiple motor outcomes of the upper limb. A limitation of this study is its small sample size and thus low statistical power. As a result, some relationships with moderate correlation were deemed not significant (e.g., acute CST ΔFA versus subacute MI rs = 0.62, P = 0.054). Also a consequence of low statistical power, to minimize the likelihood of model overfitting and resultant Type 1 error, we assessed the prognostic value of DTI-derived measures of CST injury after adjusting serially for each covariate rather than multiple covariates in a single model. Despite these limitations, the novel findings and technical developments of the current exploratory study motivate a future study involving a substantially larger sample size.
In summary, the findings of our current study provide preliminary support that acute CST ΔAD and subacute ΔFA are strong prognostic indicators of motor outcomes for stroke patients with significant initial motor impairment. With future validation by a larger study, our DTI-based prognostic method could allow clinicians to more confidently inform their patients and families about expected outcomes, and the healthcare system could better project and allocate long-term care and rehabilitation resources. DTI-based measure of acute CST injury could also be used for patient selection and randomization in stroke clinical trials, as well as a surrogate biomarker of long-term motor outcome.
Supplementary Material
Acknowledgments
This study was supported by a grant from the Founders Affiliate of the American Heart Association (09GRNT2240036), and carried out using resources provided by the Biomedical Technology Program of the NIH-NCRR (P41RR14075) and the Harvard NeuroDiscovery Center. ABS was supported by grants from the NIH-NINDS (R01NS051412 and 1R21NS077442).
References
- 1.Duncan PW, Goldstein LB, Matcher D, Divine GW, Feussner J. Measurement of motor recovery after stroke: outcome assessment and sample size requirements. Stroke. 1992;23:1084–9. doi: 10.1161/01.str.23.8.1084. [DOI] [PubMed] [Google Scholar]
- 2.Nakayama H, Hendrik SJ, Raaschou HO, Olsen TS. Recovery of upper extremity function in stroke patients: the Copenhagen stroke study. Arch Phys Med Rehabil. 1994;75:394–9. doi: 10.1016/0003-9993(94)90161-9. [DOI] [PubMed] [Google Scholar]
- 3.Feys H, De Weerdt W, Nuyens G, van de Winckel A, Selz B, Kiekens C. Predicting motor recovery of the upper limb after stroke rehabilitation: value of a clinical examination. Physiother Res Int. 2000;5:1–18. doi: 10.1002/pri.180. [DOI] [PubMed] [Google Scholar]
- 4.Wade DT, Langton-Hewer R, Wood VA, Skilbeck CE, Ismail HM. The hemiplegic arm after stroke: measurement and recovery. J Neurol Neurosurg Psychiatry. 1983;46:521–4. doi: 10.1136/jnnp.46.6.521. [DOI] [PMC free article] [PubMed] [Google Scholar]
- 5.Prabhakaran S, Zarahn E, Riley C, Speizer A, Chong JY, Lazar RM, et al. Inter-individual variability in the capacity for motor recovery after ischemic stroke. Neurorehabil Neural Repair. 2008;22:64–71. doi: 10.1177/1545968307305302. [DOI] [PubMed] [Google Scholar]
- 6.Binkofski F, Seitz RJ, Hacklander T, Pawelec D, Mau J, Freund HJ. Recovery of motor functions following hemiparetic stroke: a clinical and magnetic resonance-morphometric study. Cerebrovasc Dis. 2001;11:273–81. doi: 10.1159/000047650. [DOI] [PubMed] [Google Scholar]
- 7.Rapisarda G, Bastings E, de Noordhout AM, Pennisi G, Delwaide PJ. Can motor recovery in stroke patients be predicted by early transcranial magnetic stimulation? Stroke. 1996;27:2191–6. doi: 10.1161/01.str.27.12.2191. [DOI] [PubMed] [Google Scholar]
- 8.Escudero JV, Sancho J, Bautista D, Escudero M, Lopez-Trigo J. Prognostic value of motor evoked potential obtained by transcranial magnetic brain stimulation in motor function recovery in patients with acute ischemic stroke. Stroke. 1998;29:1854–9. doi: 10.1161/01.str.29.9.1854. [DOI] [PubMed] [Google Scholar]
- 9.Heald A, Bates D, Cartlidge NE, French JM, Miller S. Longitudinal study of central motor conduction time following stroke. 2. Central motor conduction measured within 72 h after stroke as a predictor of functional outcome at 12 months. Brain. 1993;116:1371–85. doi: 10.1093/brain/116.6.1371. [DOI] [PubMed] [Google Scholar]
- 10.Turton A, Wroe S, Trepte N, Fraser C, Lemon RN. Contralateral and ipsilateral EMG responses during recovery of arm and hand function after stroke. Electroenceph Clin Neurophysiol. 1996;101:316–28. doi: 10.1016/0924-980x(96)95560-5. [DOI] [PubMed] [Google Scholar]
- 11.Kunimatsu A, Aoki S, Masutani Y, Abe O, Mori H, Ohtomo K. Three-dimensional white matter tractography by diffusion tensor imaging in ischaemic stroke involving the corticospinal tract. Neuroradiology. 2003;45:532–5. doi: 10.1007/s00234-003-0974-4. [DOI] [PubMed] [Google Scholar]
- 12.Yamada K, Ito H, Nakamura H, Kizu O, Akada W, Kubota T, et al. Stroke patients’ evolving symptoms assessed by tractography. J Magn Reson Imaging. 2004;20:923–9. doi: 10.1002/jmri.20215. [DOI] [PubMed] [Google Scholar]
- 13.Cho SH, Kim DG, Kim DS, Kim YH, Lee CH, Jang SH. Motor outcome according to the integrity of the corticospinal tract determined by diffusion tensor tractography in the early stage of corona radiata infarct. Neurosci Lett. 2007;426:123–7. doi: 10.1016/j.neulet.2007.08.049. [DOI] [PubMed] [Google Scholar]
- 14.Lai C, Zhang SZ, Liu HM, Zhou YB, Zhang YY, Zhang QW, et al. White matter tractography by diffusion tensor imaging plays an important role in prognosis estimation of acute lacunar infarctions. Br J Radiol. 2007;80:782–9. doi: 10.1259/bjr/99366083. [DOI] [PubMed] [Google Scholar]
- 15.Thomalla G, Glauche V, Koch MA, Beaulieu C, Weiller C, Rother J. Diffusion tensor imaging detects early Wallerian degeneration of the pyramidal tract after ischemic stroke. Neuroimage. 2004;22:1767–74. doi: 10.1016/j.neuroimage.2004.03.041. [DOI] [PubMed] [Google Scholar]
- 16.Jang SH, Cho SH, Kim YH, Han BS, Byun WM, Son SM, et al. Diffusion anisotrophy in the early stages of stroke can predict motor outcome. Restor Neurol Neurosci. 2005;23:11–7. [PubMed] [Google Scholar]
- 17.Moller M, Frandsen J, Andersen G, Gjedde A, Vestergaard-Poulsen P, Ostergaard L. Dynamic changes of corticospinal tracts after stroke detected by fibertracking. J Neurol Neurosurg Psychiatry. 2007;78:587–92. doi: 10.1136/jnnp.2006.100248. [DOI] [PMC free article] [PubMed] [Google Scholar]
- 18.Yoshioka H, Horikoshi T, Aoki S, Hori M, Ishigame K, Uchida M, et al. Diffusion tensor tractography predicts motor functional outcome in patients with spontaneous intracerebral hemorrhage. Neurosurgery. 2008;62:97–103. doi: 10.1227/01.NEU.0000311066.03121.B8. [DOI] [PubMed] [Google Scholar]
- 19.Yu C, Zhu C, Zhang Y, Chen H, Qin W, Wang M, et al. A longitudinal diffusion tensor imaging study on Wallerian degeneration of corticospinal tract after motor pathway stroke. Neuroimage. 2009;47:451–8. doi: 10.1016/j.neuroimage.2009.04.066. [DOI] [PubMed] [Google Scholar]
- 20.Radlinska B, Ghinani S, Leppert IR, Minuk J, Pike GB, Thiel A. Diffusion tensor imaging, permanent pyramidal tract damage, and outcome in subcortical stroke. Neurology. 2010;75:1048–54. doi: 10.1212/WNL.0b013e3181f39aa0. [DOI] [PMC free article] [PubMed] [Google Scholar]
- 21.Puig J, Pedraza S, Blasco G, Daunis IEJ, Prados F, Remollo S, et al. Acute damage to the posterior limb of the internal capsule on diffusion tensor tractography as an early imaging predictor of motor outcome after stroke. AJNR Am J Neuroradiol. 2011;32:857–63. doi: 10.3174/ajnr.A2400. [DOI] [PMC free article] [PubMed] [Google Scholar]
- 22.Jang SH, Bai D, Son SM, Lee J, Kim DS, Sakong J, et al. Motor outcome prediction using diffusion tensor tractography in pontine infarct. Ann Neurol. 2008;64:460–5. doi: 10.1002/ana.21444. [DOI] [PubMed] [Google Scholar]
- 23.Basser PJ. Inferring microstructural features and the physiological state of tissues from diffusion-weighted images. NMR Biomed. 1995;8:333–44. doi: 10.1002/nbm.1940080707. [DOI] [PubMed] [Google Scholar]
- 24.Sotak CH. The role of diffusion tensor imaging in the evaluation of ischemic brain injury - a review. NMR Biomed. 2002;15:561–9. doi: 10.1002/nbm.786. [DOI] [PubMed] [Google Scholar]
- 25.Cramer SC, Nelles G, Schaechter JD, Kaplan JD, Finklestein SP. Computerized measurement of motor performance after stroke. Stroke. 1997;28:2162–8. doi: 10.1161/01.str.28.11.2162. [DOI] [PubMed] [Google Scholar]
- 26.Mathiowetz V, Weber K, Kashman N, Volland G. Adult norms for the nine hole peg test of manual dexterity. Occup Ther J Res. 1985;5:24–37. doi: 10.5014/ajot.39.6.386. [DOI] [PubMed] [Google Scholar]
- 27.Andersson JLR, Jenkinson M, Smith S. FMRIB technical report TR07JA2. 2010. Non-linear registration, aka spatial normalisation. [Google Scholar]
- 28.Smith SM, Jenkinson M, Woolrich MW, Beckmann CF, Behrens TE, Johansen-Berg H, et al. Advances in functional and structural MR image analysis and implementation as FSL. Neuroimage. 2004;23 (Suppl 1):S208–19. doi: 10.1016/j.neuroimage.2004.07.051. [DOI] [PubMed] [Google Scholar]
- 29.FSL. http://www.fmrib.ox.ac.uk/fsl.
- 30.Pfefferbaum A, Sullivan EV, Hedehus M, Lim KO, Adalsteinsson E, Moseley M. Age-related decline in brain white matter anisotropy measured with spatially corrected echo-planar diffusion tensor imaging. Magn Reson Med. 2000;44:259–68. doi: 10.1002/1522-2594(200008)44:2<259::aid-mrm13>3.0.co;2-6. [DOI] [PubMed] [Google Scholar]
- 31.Stinear CM, Barber PA, Petoe M, Anwar S, Byblow WD. The PREP algorithm predicts potential for upper limb recovery after stroke. Brain. 2012;135:2527–35. doi: 10.1093/brain/aws146. [DOI] [PubMed] [Google Scholar]
- 32.Puig J, Pedraza S, Blasco G, Daunis IEJ, Prats A, Prados F, et al. Wallerian degeneration in the corticospinal tract evaluated by diffusion tensor imaging correlates with motor deficit 30 days after middle cerebral artery ischemic stroke. AJNR Am J Neuroradiol. 2010;31:1324–30. doi: 10.3174/ajnr.A2038. [DOI] [PMC free article] [PubMed] [Google Scholar]
- 33.Rajagopalan V, Yue GH, Pioro EP. Brain white matter diffusion tensor metrics from clinical 1. 5T MRI distinguish between ALS phenotypes. J Neurol. 2013;260:2532–40. doi: 10.1007/s00415-013-7012-1. [DOI] [PubMed] [Google Scholar]
- 34.Napadow V, Sheehan J, Kim J, Dassatti A, Thurler AH, Surjanhata B, et al. Brain white matter microstructure is associated with susceptibility to motion-induced nausea. Neurogastroenterol Motil. 2013;25:448–50. doi: 10.1111/nmo.12084. [DOI] [PMC free article] [PubMed] [Google Scholar]
- 35.Sorensen AG, Wu O, Copen WA, Davis TL, Gonzalez RG, Koroshetz WJ, et al. Human acute cerebral ischemia: detection of changes in water diffusion anisotropy by using MR imaging. Radiology. 1999;212:785–92. doi: 10.1148/radiology.212.3.r99se24785. [DOI] [PubMed] [Google Scholar]
- 36.Bhagat YA, Hussain MS, Stobbe RW, Butcher KS, Emery DJ, Shuaib A, et al. Elevations of diffusion anisotropy are associated with hyper-acute stroke: a serial imaging study. Magn Reson Imaging. 2008;26:683–93. doi: 10.1016/j.mri.2008.01.015. [DOI] [PubMed] [Google Scholar]
- 37.Sakai K, Yamada K, Nagakane Y, Mori S, Nakagawa M, Nishimura T. Diffusion tensor imaging may help the determination of time at onset in cerebral ischaemia. J Neurol Neurosurg Psychiatry. 2009;80:986–90. doi: 10.1136/jnnp.2008.163584. [DOI] [PubMed] [Google Scholar]
- 38.Song SK, Sun SW, Ju WK, Lin SJ, Cross AH, Neufeld AH. Diffusion tensor imaging detects and differentiates axon and myelin degeneration in mouse optic nerve after retinal ischemia. Neuroimage. 2003;20:1714–22. doi: 10.1016/j.neuroimage.2003.07.005. [DOI] [PubMed] [Google Scholar]
- 39.Sun SW, Liang HF, Cross AH, Song SK. Evolving Wallerian degeneration after transient retinal ischemia in mice characterized by diffusion tensor imaging. Neuroimage. 2008;40:1–10. doi: 10.1016/j.neuroimage.2007.11.049. [DOI] [PMC free article] [PubMed] [Google Scholar]
- 40.Matsumoto K, Lo EH, Pierce AR, Wei H, Garrido L, Kowall NW. Role of vasogenic edema and tissue cavitation in ischemic evolution on diffusion-weighted imaging: comparison with multiparameter MR and immunohistochemistry. AJNR Am J Neuroradiol. 1995;16:1107–15. [PMC free article] [PubMed] [Google Scholar]
- 41.Thomalla G, Glauche V, Weiller C, Rother J. Time course of wallerian degeneration after ischaemic stroke revealed by diffusion tensor imaging. J Neurol Neurosurg Psychiatry. 2005;76:266–8. doi: 10.1136/jnnp.2004.046375. [DOI] [PMC free article] [PubMed] [Google Scholar]
- 42.Pierpaoli C, Basser PJ. Toward a quantitative assessment of diffusion anisotropy. Magn Reson Med. 1996;36:893–906. doi: 10.1002/mrm.1910360612. [DOI] [PubMed] [Google Scholar]
- 43.Seghier ML, Ramlackhansingh A, Crinion J, Leff AP, Price CJ. Lesion identification using unified segmentation-normalisation models and fuzzy clustering. Neuroimage. 2008;41:1253–66. doi: 10.1016/j.neuroimage.2008.03.028. [DOI] [PMC free article] [PubMed] [Google Scholar]
- 44.Lin GC, Wang WJ, Kang CC, Wang CM. Multispectral MR images segmentation based on fuzzy knowledge and modified seeded region growing. Magn Reson Imaging. 2012;30:230–46. doi: 10.1016/j.mri.2011.09.008. [DOI] [PubMed] [Google Scholar]
Associated Data
This section collects any data citations, data availability statements, or supplementary materials included in this article.