Abstract
Purpose:
To develop a method for high-resolution cardiac T1 mapping.
Methods:
A new method, accelerated and navigator-gated look-locker imaging for cardiac T1 estimation (ANGIE), was developed. An adaptive acquisition algorithm that accounts for the interplay between navigator gating and undersampling patterns well-suited for compressed sensing was used to minimize scan time. Computer simulations, phantom experiments, and imaging of the left ventricle (LV) were used to optimize and evaluate ANGIE. ANGIE’s high spatial resolution was demonstrated by T1 mapping of the right ventricle (RV). Comparisons were made to modified Look-Locker imaging (MOLLI).
Results:
Retrospective reconstruction of fully sampled datasets demonstrated the advantages of the adaptive algorithm. For the LV, ANGIE measurements of T1 were in good agreement with MOLLI. For the RV, ANGIE achieved a spatial resolution of 1.2 × 1.2 mm2 with a scan time of 157±53 s per slice, and measured RV T1 values of 980±96 ms versus 1076±157 ms for lower-resolution MOLLI. ANGIE provided lower intrascan variation in the RV T1 estimate compared with MOLLI (P<0.05).
Conclusion:
ANGIE enables high-resolution cardiac T1 mapping in clinically reasonable scan times. ANGIE opens the prospect of quantitative T1 mapping of thin cardiovascular structures such as the RV wall.
Keywords: T1 mapping, MOLLI, right ventricle, compressed sensing, cardiac MRI, navigator gating
INTRODUCTION
Gadolinium-enhanced T1 mapping is becoming increasingly important in the evaluation of various cardiovascular diseases. For example, gadolinium-enhanced T1 mapping has detected diffuse fibrosis in heart failure (1,2), hypertrophic cardiomyopathy (3,4), dilated cardiomyopathy (5), and valvular heart disease (6,7); focal fibrosis after myocardial infarction (8); inflammation in myocarditis (9); and cardiac amyloidosis (10). Modified Look-Locker inversion recovery imaging (MOLLI) (11) and shortened MOLLI (ShMOLLI) (12) are the most widely used cardiac T1 mapping methods. Employing single-shot imaging, acquisition windows of approximately 200 ms, and breath-holding to reduce respiratory artifact, these techniques typically yield in-plane spatial resolution in the range of 1.8–2.4 mm2 and are well-suited for T1 mapping of structures on the order of 1 cm2, such as the wall of the left ventricle (LV).
Whereas breath-hold techniques such as MOLLI and ShMOLLI are successfully applied for many applications, others could benefit from higher spatial resolution. For example, for the assessment of fibrosis in the peri-infarct zone, or for the walls of the right ventricle and the atria, higher spatial resolution would be needed. In the present study, we sought to develop a cardiac T1 mapping sequence capable of acquiring higher resolution images within a clinically acceptable scan time.
We performed three modifications to a standard MOLLI sequence. First, instead of using a breath-hold acquisition we used navigator gating to accept or reject the acquired data. With this modification the image acquisition time can exceed that of breath-hold methods, which provides more flexibility in sequence design. To increase spatial resolution, the second modification was to implement a segmented readout, instead of a single-shot readout, thereby acquiring the k-space data for a single image over multiple heartbeats. With a segmented readout, the limited acquisition window imposed by cardiac motion does not limit spatial resolution. However, segmenting the readout increases the total scan time. Therefore, to reduce the total scan time, the third modification was to accelerate the scan using k-t undersampling and to use compressed sensing (CS) (13-15) with parallel imaging (16) for reconstruction. CS has been shown to be well-suited for T1 mapping, and CS theory (13-15) recommends randomly acquiring the k-space data. As we propose using both navigator gating, which rejects data based on the diaphragm position, and CS, where random sampling is preferred, our study included an investigation of the interaction between navigator-based data rejection and undersampling patterns that are well-suited for CS. Specifically, we developed and implemented an adaptive data acquisition method that, in real time and based on the current k-t sampling pattern, recomputes an updated k-t sampling pattern that is well-suited for CS reconstruction and T1 estimation and reduces the total scan time.
The proposed sequence was named accelerated and navigator-gated look-locker imaging for cardiac T1 estimation (ANGIE). Computer simulations were performed to evaluate and compare the image quality that was achieved using two different k-t undersampling strategies. ANGIE, using the better undersampling strategy, was compared to MOLLI for T1 mapping of the LV in healthy volunteers. In addition, to demonstrate new capabilities of high-resolution T1 mapping with ANGIE, we compared MOLLI and ANGIE for T1 mapping of the wall of the right ventricle (RV).
THEORY
Data sampling patterns suitable for CS often use a fully sampled or nearly fully sampled central k-space region and a randomly undersampled outer k-space region. For most current CS applications, a fixed, predetermined sampling pattern is used. However, for navigator-gated methods such as ANGIE, decisions regarding acceptance and rejection of the data occur during the scan, and completing sampling patterns with associated acceleration factors determined a priori may lead to very long acquisition times. An adaptive acquisition strategy (17) that makes real-time adjustments to the k-t sampling pattern based on which data have and have not been acquired may be used to reduce the total scan time while also collecting k-t data that are well-suited to image reconstruction using CS.
In addition to an adaptive acquisition, we also investigated the use of criteria to stop the acquisition. Because ANGIE uses CS to accelerate a T1 mapping acquisition, accurate CS reconstruction and precise T1 estimation are the two crucial factors that should determine the ANGIE data sampling method. To minimize the scan time for ANGIE, a stopping criterion to halt the acquisition should also be based on the capability to perform an accurate CS reconstruction and a precise T1 estimation. The point spread function (PSF) characterizes interference in the image due to data undersampling, and the transform point spread function (TPSF) similarly characterizes interference in the transform domain. The transform side lobe-to-peak ratio (TSPR) is the normalized maximum possible interference occurring in the TPSF, defined by (15) and is a simplified measure of the incoherence and the severity of artifacts due to undersampling (15,18,19). Thus, we used the TSPR as a metric of CS reconstruction accuracy.
Another measure, the Cramer Rao lower bound (CRLB), provides the lowest achievable variance of an estimate for a particular parameter in a specific fitting model. In the case of T1 mapping, the parameter of interest is T1, and the CRLB indicates the precision in the T1 measurement given the sampled inversion time (TI) points. The CRLB has been used for the design of optimal TI sampling for T1 estimation (20,21). In cardiac applications, TI values are often governed by heart rate; thus, in ANGIE, the TI values are determined by the timing of the electrocardiography (ECG) signal, and the CRLB is used to assess the precision of the T1 estimate. Hence, the CRLB is used to measure the sufficiency of the sampled TI values. For the CRLB calculation, we used a three-parameter exponential model with an independent and identically distributed Gaussian noise model:
| [1] |
where tj is the jth inversion time, T is the apparent T1, and σ is the noise standard deviation. Based on these models, the elements of the Fisher information matrix (F) and the CLRB are given as
| [2] |
where N is the number of inversion times. The CRLB was calculated using Equation [2], the sampled TI values, and the nominal values of the parameters to be estimated (T1 and B) (20,21).
METHODS
Pulse Sequence
The ANGIE pulse sequence is illustrated in Figure 1. The basic acquisition is comprised of an inversion recovery Look-Locker experiment (22) with an inversion pulse followed by four consecutive ECG-triggered data acquisitions and a recovery period of two R-R intervals. To ensure that images are acquired at a consistent cardiac phase, the data acquisition is performed at a fixed delay time, TD, after R-wave detection. Each data acquisition block includes a navigator echo, an optional fat saturation module, a set of catalyzing radiofrequency (RF) pulses and a segmented readout module. The basic acquisition block is repeated to acquire all of the required readout segments and to acquire images at various inversion times. The navigator echo, formed using orthogonal slice-selective 90° and 180° RF pulses, is typically placed on the right hemidiaphragm (23). The navigator acceptance window was set such that data not acquired during end expiration were discarded. The readout module consisted of a segmented balanced SSFP acquisition. Each readout was preceded by a train of 10 catalyzing RF pulses with Kaiser-Bessel window ramped flip angles to dampen the transient signal oscillations (24).
FIG. 1.
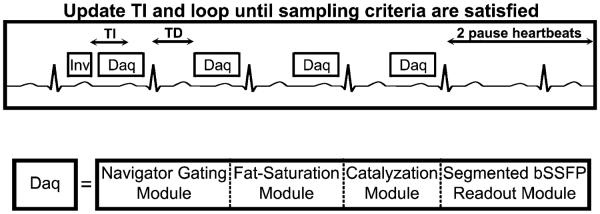
A diagram showing the ANGIE pulse sequence scheme. This instance of ANGIE uses an inversion-recovery Look-Locker experiment with four ECG-triggered data acquisition modules and a waiting period of two R-R intervals. The sequence is repeated, after updating TI, until the stopping criteria are satisfied. The data acquisition module is comprised of a navigator-gating module, fat suppression, a set of catalyzing RF pulses, and a segmented balanced SSFP readout.
Adaptive Acquisition Algorithm
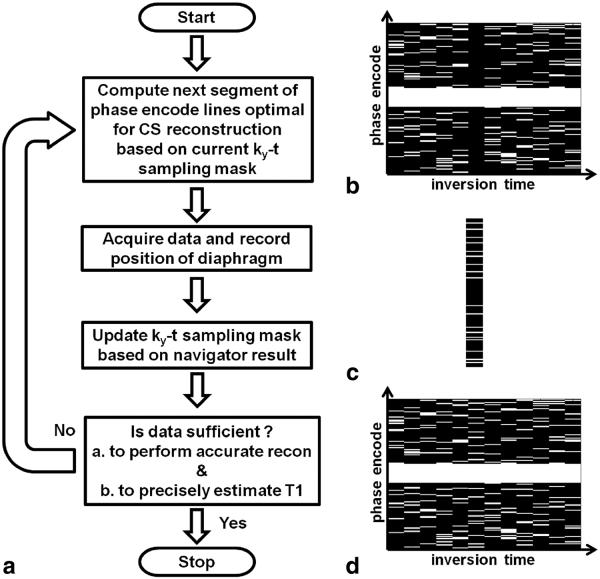
Figure 2a illustrates the flow of the adaptive acquisition algorithm. The various panels in Figure 2 assume that the ANGIE scan is in progress. Based on the current ky-t sampling pattern (Fig. 2b), which has been influenced by navigator acceptance and rejection of data, the algorithm computes the phase-encode lines that should be acquired next (Fig. 2c) in order to achieve CS-suitable sampling and reconstruction. Next, the navigator is played to record the position of the diaphragm and the data are acquired. Based on the position of the diaphragm, the acquired data are either accepted or rejected, and the current ky-t sampling pattern is updated. Suppose, for example, that the diaphragm was within the acceptance window and the acquired data were accepted; the updated ky-t sampling pattern would then appear as shown in Figure 2d. Next, the algorithm calculates the TSPR and the CRLB to measure the suitability of the entire ky-t dataset to perform accurate CS reconstruction and precise T1 estimation, respectively. The acquisition is stopped only if both the TSPR and the CRLB values are below the corresponding threshold values, to ensure that both the conditions are satisfied; otherwise, the acquisition continues. In the present implementation, the initial 12.5% of the phase-encode lines for each time point correspond to the central fully sampled region and the remaining 87.5% are selected from the higher-frequency undersampled region based on a selection strategy. The adaptive selection strategy considers the entire ky-t space, and computes the next segment of phase encoding lines to acquire by determining which lines have been acquired least often over all of the inversion times (i.e., using a probability density function, or PDF). Using computer simulations, the adaptive selection strategy was compared with a nonadaptive strategy. For the nonadaptive scheme, phase encode lines were chosen based on a predetermined acquisition order in which the lines were independently selected for each time point. Specifically, for each time point, the center fully sampled phase encode lines were acquired initially, while the outer phase encode lines were acquired later in a uniform random fashion, independent of other inversion times.
FIG. 2.
The adaptive data acquisition algorithm. a: Flow chart of the algorithm. b: Example sampled ky-t space. A white line represents an acquired ky line and a black line represents a ky line that has not been acquired. c: Example set of ky lines adaptively computed for the next acquisition. d: Example updated ky-t data space, which is a combination of ky-t space in panels b and c. Each iteration of the acquisition algorithm begins by computing optimal phase encode lines suitable for CS reconstruction (example in panel c), based on the previously sampled data in ky-t space (example in panel b). Data are acquired at the computed phase encode indices, and the diaphragm position is recorded. The acquisition is stopped if the sampled data in ky-t space are navigator-accepted and sufficient to perform accurate CS reconstruction and to precisely estimate T1. Otherwise, the iteration is continued.
For selection of the TSPR threshold value, fully sampled datasets were retrospectively undersampled at various acceleration rates, and corresponding reconstructed images were qualitatively evaluated. TSPR was computed for all these undersampled datasets, and a TSPR threshold value which distinguished images without artifact from those with artifact was selected. For selection of the CRLB threshold, we determined that the CRLB was 665 ms2 when all 12 inversion times are used, which provides a T1 precision of 25.8 ms. A 20% reduction in precision provides a CRLB value of 957 ms2. Additionally, simulations of the adaptive acquisition were performed using physiological information (ECG and respiratory data) from volunteer scans. In these simulations, acquisition times were computed for different CRLB threshold values while keeping the TSPR threshold constant. We observed that the scan time increased substantially when the CRLB threshold value was reduced to lower than 950 ms2. Based on these two results, we chose the CRLB threshold to be 950 ms2.
Image Reconstruction and Postprocessing
The proposed ANGIE method acquires a sequence of images of tissue undergoing T1 relaxation. Also, in general terms, the MR images are spatially smooth. Therefore, ANGIE images possess spatiotemporal sparsity. Accordingly, we used CS with matrix rank as the sparse domain (25). Furthermore, we used CS in conjunction with SENSE (16) parallel imaging to reconstruct ANGIE images. The reconstruction problem was formulated as the following optimization equation:
| [3] |
where m is the image after coil combination, Ci is the individual coil sensitivity profile, d is the measured k-space data, and ∥ ∥* is the nuclear norm operator. Unaliased low-resolution images were obtained using the central fully sampled region of k-space, and sensitivity maps were calculated from the low-resolution images based on an eigenvector filter approach (26). The regularization parameter, λ, was empirically determined to minimize the mean squared error (MSE) using retrospective undersampling of fully sampled datasets and an acceleration of rate 4. The optimal values of λ ranged from 2 × 10⁻⁵ to 5 × 10⁻⁵ (leading to similar MSE values). More regularization was needed when SNR was lower. Thus, datasets with in-plane resolution higher than or equal to 1.2 × 1.2 mm2 were reconstructed using λ=5 × 10⁻⁵, while datasets with in-plane resolution lower than 1.2 × 1.2 mm2 were reconstructed using λ=2 × 10⁻⁵.
The raw time-stamped k-space data were exported from the scanner to perform reconstruction offline. Each readout segment was binned to the nearest TI based on its timestamp. The inversion time of the segment with the fully sampled central k-space region was used as the inversion time of the entire bin. After binning, the data were reconstructed using a variable splitting algorithm with continuation (25) modified to incorporate parallel imaging. The reconstruction algorithm provided the complex coil-combined images. These individual images were phase-corrected using the phase of the image with the longest TI (27), and the phase-corrected images were used to generate the T1 maps. A three-parameter exponential model was used for T1 estimation using a Levenberg-Marquardt algorithm.
Computer Simulations for Sampling Scheme
To compare the performance of the adaptive and nonadaptive sampling schemes, we used computer simulations based on retrospective undersampling of a fully sampled ANGIE dataset. The simulations were performed using ECG and respiratory signals acquired from different volunteers. Undersampling was performed by assuming the same navigator acceptance pattern for both the schemes (nonadaptive and adaptive) so that the same total number of phase encodes were acquired for each scheme. The simulated acquisition was stopped for both schemes when the CRLB and the TSPR values, calculated from the ky-t sampling pattern of the adaptive scheme, were below the threshold values. This ensured that the simulated acquisition time was equivalent for both sampling schemes. Because the same physiological signals as well as the same acquisition time were used to simulate both data sampling methods, the same number of phase encode lines were accepted for each time frame for both sampling schemes. Therefore, only the phase encode indices varied from one scheme to the other. To consider variations in physiological signals, nine simulations were performed, each with a different set of physiological signals. Images were reconstructed and quantitatively evaluated using the MSE and structure similarity (SSIM). MSE measures the direct difference between the two images, whereas SSIM is a more comprehensive measurement of the similarity between two images that includes measurement of the structure, intensity, and contrast; additionally, it represents human perception more closely (28).
Phantom Study
Twelve agarose gel phantoms containing millimolar concentrations of copper sulphate (29,30) with T1 values ranging from 200 to 1500 ms and T2 values near 50 or 200 ms were used to validate T1 estimates made using ANGIE. The phantoms were scanned at heart rates ranging from 40 to 100 bpm. Additionally, phantoms were scanned with an arrhythmic ECG signal generated using an ECG simulator (750100 Rev B Simulator, SA Instruments, Stony Brook, New York, USA). The simulated arrhythmic ECG signal had a heart rate ranging from 40 to 110 bpm with a mean and standard deviation of 74.5 and 20.4 bpm, respectively. ANGIE acquisition parameters were as follows: matrix size=208 × 144; pixel size=1.4 × 1.4 mm2; slice thickness=8 mm; initial TI=190 ms; TI increment=80 ms; TSPR threshold=0.5; and CRLB threshold=950 ms2. The navigator was placed in a background region to randomly accept/reject the data. T1 estimates were computed from CS-reconstructed images. A single point inversion-recovery spin-echo sequence with 20 TI values ranging from 50 to 5500 ms was used to measure reference T1 values of the phantoms.
Volunteer Studies for T1 Mapping of the LV
All studies were performed using a 1.5T MR scanner (Avanto, Siemens, Erlangen, Germany) in accordance with protocols approved by our institutional review board. To compare ANGIE to MOLLI, we performed acquisitions using standard MOLLI (11), ANGIE with resolution similar to MOLLI, and high-resolution ANGIE in six healthy volunteers (age, 28±3 y). For each subject, a midventricular short-axis slice was imaged during late diastole. The relevant imaging parameters for MOLLI were as follows: repetition time (TR)=2.4 ms; echo time (TE)=1.0 ms; field of view (FOV) read=285–430 mm; FOV phase=69.8%; matrix size=192 × 108; pixel size=1.5–2.2 × 1.8–2.8 mm2; flip angle=35°; slice thickness=8 mm; acquisition window=155 ms; initial TI=100 ms; and TI increment=80 ms. The relevant parameters for high-resolution ANGIE were as follows: TR=3.2 ms; TE=1.6 ms; FOV read=285–430 mm; FOV phase=69.2%; matrix size=304 × 216 pixel size= 0.9–1.4 × 0.9–1.4 mm2; flip angle=35°; slice thickness=8 mm; acquisition window=115 ms; initial TI=200 ms; TI increment=80 ms; phase encodes per readout=36; navigator acceptance window=±3 mm; TSPR threshold=0.5; and CRLB threshold=950 ms2. The initial TI for ANGIE was higher than for MOLLI because ANGIE contained a navigator module and a fat saturation module prior to the readout module, which were not present in MOLLI. Furthermore, MOLLI uses partial Fourier along the phase encode and readout directions. Partial Fourier along the phase encode direction allows fewer repetitions before the center of k-space is acquired, whereas partial Fourier along the readout direction allows a lower TR value, thus reducing the initial TI. For low-resolution ANGIE, the matrix size was changed to 208 × 144, which yielded a pixel size of 1.4–2.1 × 1.4–2.1 mm2. Because MOLLI is a breath-held technique, whereas ANGIE is a free-breathing technique, there will often be a mismatch of anatomical slice location. For this reason, MOLLI was acquired at several different slice locations, and the closest anatomical slice was used for comparison. T1 maps were generated and contours were drawn to compute LV myocardial T1 and blood-pool T1.
Volunteer Studies for T1 Mapping of the RV
To evaluate ANGIE for assessment of the T1 of the wall of the RV, which is 3–5 mm thick in healthy adults (31), we used a high-resolution protocol. For comparison, we also performed acquisitions using standard MOLLI (11). Nine healthy volunteers (age 28±5 y) underwent MRI of a short-axis slice. The image acquisition was timed to occur at end systole to take advantage of the thicker RV wall and greater separation of the RV wall from the liver and the chest wall (32). The relevant imaging parameters for MOLLI were as follows: TR=2.6 ms; TE=1.16 ms; FOV read=390–440 mm; FOV phase=68.8%; matrix size=192 × 106; pixel size=2.0–2.3 × 2.5–2.9 mm2; flip angle=35°; slice thickness=4 mm; acquisition window-=164 ms; initial TI=100 ms; and TI increment=80 ms. The relevant parameters for high-resolution ANGIE were as follows: TR=3.2 ms; TE=1.6 ms; FOV read=270–315 mm; FOV phase=100%; matrix size=224 × 224; pixel size=1.2–1.3 × 1.2–1.3 mm2; flip angle=35°; slice thickness=4 mm; acquisition window=76 ms; initial TI=160 ms; TI increment=80 ms; phase encodes per readout=24; navigator acceptance window=±3 mm; TSPR threshold=0.25; and CRLB threshold=950 ms2. A slice thickness of 4 mm was used to reduce through-plane partial volume effects, which also reduces the SNR. Therefore, a lower TSPR threshold value was used compared with the TSPR threshold value used for the LV acquisition. T1 maps were generated from the reconstructed images, and RV contours were drawn using magnitude images (not T1 maps) to compute RV myocardial T1. The contours were drawn in a conservative manner to exclude trabeculations and were forced to have continuous coverage from the anterior RV insertion point to the inferior RV insertion point. A quantitative comparison of image sharpness between ANGIE and MOLLI was performed using the average edge width sharpness metric (33). This sharpness metric computes the mean of the edge width over all the edges in the image detected after applying a Sobel filter (33). The metric measurement was confined to a rectangular region covering only the heart to avoid biases from other regions.
RESULTS
Computer Simulations to Compare Sampling Schemes
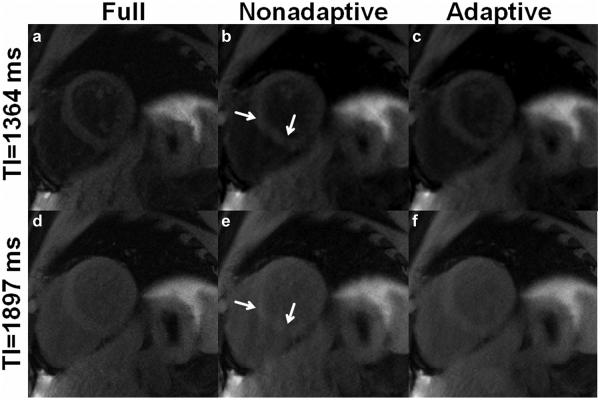
Figure 3 shows example results from simulations comparing the adaptive and the nonadaptive acquisition schemes (34). Specifically, example CS-reconstructed images at two inversion times, generated from identical fully sampled raw datasets retrospectively undersampled using the nonadaptive and the adaptive schemes are shown in Figure 3b and 3e and Figure 3c and 3f, respectively. Fully sampled reference images are shown in the first column (Figure 3a, d). Visual inspection shows that the results generated using the adaptive scheme most closely resemble the fully sampled images. Results using the nonadaptive scheme showed residual aliasing artifacts. A quantitative comparison of the sampling schemes from nine sets of simulations, each using different physiological signals, evaluated MSE and SSIM (Figure 4). SSIM and MSE from the adaptive scheme were significantly better than the nonadaptive scheme (P<0.05) (34).
FIG. 3.
Comparison of ANGIE images acquired using two different undersampling schemes, adaptive and nonadaptive. a,d: Fully sampled images. b,e: Images reconstructed from data using a nonadaptive scheme. c,f: Images reconstructed from data using an adaptive scheme. Panels c and f have reduced aliasing artifacts compared with b and e (arrows), demonstrating that adaptive sampling performs better than nonadaptive sampling.
FIG. 4.
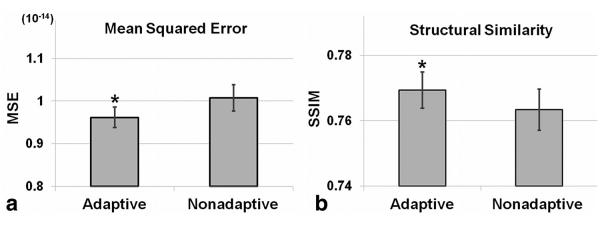
Quantitative analysis of two sampling schemes, adaptive and nonadaptive. Mean squared error (mean±standard error) (a) and structural similarity (mean±standard error) (b), averaged over time, of the CS-reconstructed images compared with the fully sampled reference images. Results show that the adaptive method achieved a lower MSE and higher SSIM compared with the nonadaptive method. *P<0.05 versus nonadaptive.
Phantom Study
The T1 estimates obtained using ANGIE imaging of phantoms were related to reference T1 values with a slope of 0.92±0.03 and a bias of 22±16 ms over all the simulated ECG patterns using a linear model (T1ANGIE=slope*-T1ref+bias). Figure 5a displays the correlation between ANGIE T1 estimates using a simulated ECG signal with an irregular heart rate and reference T1 estimates. Figure 5b displays the percentage error in measuring T1 using ANGIE for all 12 phantoms at five different ECG patterns, including a simulated irregular heart rate. The maximum error under these conditions was <10%.
FIG. 5.
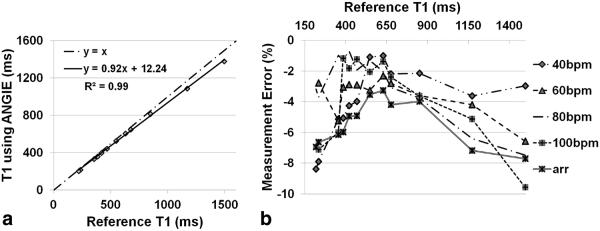
Phantom results. a: Using simulated arrhythmic ECG, a good correlation of T1 estimates is achieved comparing ANGIE to the reference inversion-recovery (IR) spin echo method. b: Percentage error in T1 estimates using ANGIE, as compared with the IR spin echo reference method, for 12 phantoms at five different simulated ECG patterns.
Volunteer Studies for T1 Mapping of the LV
Example T1 maps acquired from a healthy volunteer are shown in Figure 6. Figure 6a, 6b, and 6c show T1 maps generated from high-resolution ANGIE, low-resolution ANGIE, and MOLLI, respectively. All three T1 maps appear similar and contain T1 estimates that are in good agreement with the literature (35-37). Because the slice thickness is 8 mm for all of these T1 maps, through-plane partial volume effects obscure the ability of ANGIE to demonstrate sharper edges using this protocol (the benefits are readily appreciated below, where a 4-mm slice thickness was used for the RV protocol). Nonetheless, Table 1 summarizes the T1 values of the LV myocardium and the blood, the scan time, the acceleration rate and the navigator efficiency. The variations in blood T1 values among the three acquisitions (P value not significant) are within 6%, which is in agreement with our phantom results and our estimated errors given the effects of variations in heart rate. The mean scan time for high-resolution ANGIE T1 mapping from six volunteers was 70±37s per slice with a navigator efficiency of 59±23%.
FIG. 6.
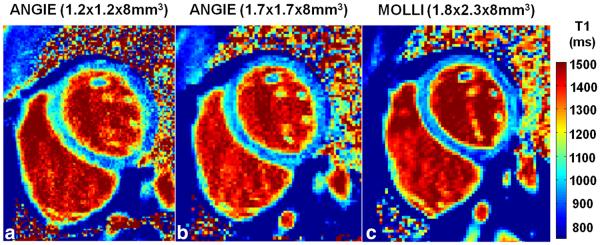
Example T1 maps acquired from a healthy volunteer for LV wall imaging. a: T1 map using high-resolution ANGIE (1.2 × 1.2 × 8 mm3). b: T1 map using lower-resolution ANGIE (1.7 × 1.7 × 8 mm3). c: T1 map using MOLLI (1.8 × 2.3 × 8 mm3). The ANGIE are in good agreement with the MOLLI T1 map in this healthy volunteer.
Table 1.
Scan Time and T1 Mapping Results from Healthy Volunteers for LV Wall Imaging
| MOLLI | High-Resolution Adaptive ANGIE | Low-Resolution Adaptive ANGIE | |
|---|---|---|---|
| Scan time | 17 hb | 70 ± 37 s | 41 ± 15 s |
| Myocardial T1 (ms) | 975 ± 100 | 979 ± 82 | 954 ± 71 |
| Blood T1 (ms) | 1459 ± 59 | 1419 ± 73 | 1376 ± 54 |
| Acceleration rate | 1.7 (Parallel) | 3.2 ± 0.4 (CS) | 3.3 ± 0.8 (CS) |
| Navigator efficiency (%) | – | 59 ± 23 | 59 ± 17 |
Volunteer Studies for T1 Mapping of the RV
Example T1 maps acquired using the RV protocol from a healthy volunteer are shown in Figure 7. Specifically, Figure 7a and 7b are end-systolic T1 maps generated from high-resolution ANGIE and lower-resolution MOLLI datasets, respectively. The RV wall is better delineated (arrows) in ANGIE compared with MOLLI due to its higher spatial resolution and shorter acquisition window. Table 2 summarizes the scan time, the T1 values of both LV and RV myocardium, the acceleration rate, and the navigator efficiency. Figure 8 shows the results from quantitative comparisons of ANGIE and MOLLI. In particular, Figures 8a and 8b show box and whisker plots comparing the mean and standard deviation of T1 estimates of pixels within the RV wall contour, respectively, for ANGIE and MOLLI. ANGIE provided significantly lower intrascan variation in the RV T1 estimate compared with MOLLI (P<0.05). Figure 8c shows a bar chart comparing the average edge width between MOLLI and ANGIE, which was significantly lower for ANGIE (P<0.01).
FIG. 7.
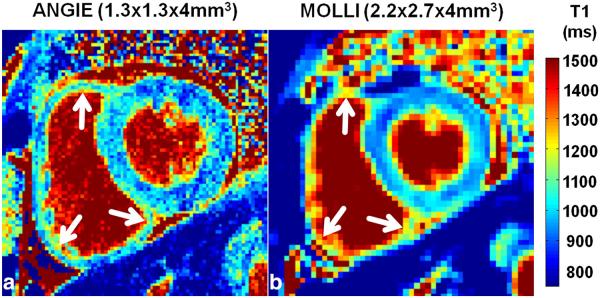
Example T1 maps acquired from a healthy volunteer for RV wall imaging. a: High-resolution ANGIE (1.3 × 1.3 × 4 mm3). b: Lower-resolution MOLLI and (2.2 × 2.7 × 4 mm3). The T1 maps illustrate the ability of ANGIE to achieve high resolution and resolve (arrows)the RV wall compared with MOLLI.
Table 2.
Scan Time and T1 Estimates from Healthy Volunteers for RV Wall Imaging
| MOLLI | ANGIE | |
|---|---|---|
| Scan time | 17 hb | 157 ± 53 s |
| Left ventricular wall T1 (ms) | 974 ± 58 | 942 ± 90 |
| Right ventricular wall T1 (ms) | 1076 ± 157 | 980 ± 96 |
| Acceleration rate | 1.7 (Parallel) | 2 ± 0.1 (CS) |
| Navigator efficiency (%) | – | 59 ± 18 |
FIG. 8.
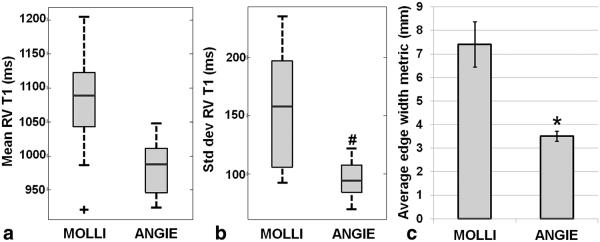
Quantitative comparison between high-resolution ANGIE and lower-resolution MOLLI in nine healthy volunteers from the RV wall imaging study. a: Box plot comparing mean T1 estimates of pixels within the RV contours. b: Box plot comparing the standard deviations of T1 estimates of pixels within the RV contours. c: Bar chart comparing the average edge width, an image sharpness metric, for MOLLI and ANGIE. ANGIE showed lower intrascan variation in the RV T1 estimates compared with MOLLI (#P<0.05 versus MOLLI). The average edge width of ANGIE was significantly smaller compared with MOLLI (*P<0.01 versus MOLLI).
DISCUSSION
We developed an improved method, ANGIE, to perform high-resolution cardiac T1 mapping within a clinically reasonable scan time. ANGIE makes use of a segmented readout strategy, navigator gating, adaptive data undersampling, and parallel-CS image reconstruction. The accuracy of cardiac T1 estimation using ANGIE was evaluated by performing comparisons with MOLLI in phantoms and healthy volunteers. The use of high-resolution ANGIE T1 mapping for assessment of thin structures such as the RV wall was demonstrated in healthy volunteers.
In this study, we developed an acquisition algorithm that adapts to the navigator rejection of data by recalculating, in real time, a sampling pattern that is well-suited for CS image reconstruction. We also developed stopping criteria to halt data acquisition when the ky-t sampling is sufficient for an accurate CS reconstruction and a precise T1 estimation. The adaptive acquisition was crucial in reducing the scan time. Specifically, the scan time for adaptive low-resolution ANGIE was 41±15 s with a navigator efficiency of 59±17%, whereas for nonadaptive low-resolution ANGIE, the scan time was 81±28 s with a navigator efficiency of 45±15% (38), illustrating an improvement of 49% in acquisition time due to the adaptive method. Generally, in CS the acquisition is stopped based on the acceleration rate. For ANGIE, if a simple stopping criterion based on the acceleration rate is used, it may lead to undesirable ky-t sampling patterns or long acquisition times. Using the CRLB ensures that the acquisition is only long enough to sample time points crucial to meet a specific precision for the T1 estimate, and using the TSPR ensures that the data for the sampled time points is sufficient to perform high-quality reconstruction. The selection of the phase encode lines using the adaptive acquisition scheme provided better image quality for the same amount of data, minimizing the scan time needed to achieve good image quality.
In the adaptive acquisition algorithm, the selection of phase encode lines was performed based on a probability density function metric. It is possible that selection of the phase encode lines based on a TSPR metric may provide even better results. However, optimal selection of phase encode lines based on a TSPR metric would require minimization of TSPR over all possible combinations of unacquired phase encode lines. Depending on the number of phase encode lines per segment and the number of unacquired phase encode lines, the set of possible combinations can contain a large number of elements, and minimizing TSPR over this large set is computationally intensive. Thus, with our current hardware, real-time selection of phase encode lines based on a TSPR metric is not feasible. For this reason, our selection of phase encode lines was based on a probability density function metric.
Most of the recently published cardiac T1 mapping techniques (11,12,39-41) make use of a single shot readout, limiting spatial resolution due to the small acquisition window imposed by cardiac motion. ANGIE uses a segmented readout, which enables higher spatial resolution. However, using a segmented readout might raise the concern that ANGIE T1 estimates may be more sensitive to variations in heart rate. By design, ANGIE uses a variable density sampling scheme where the fully sampled central k-space region, which primarily determines image contrast, is acquired in a single readout segment for each TI. Furthermore, the time stamp of the central portion of k-space defines the inversion time for each image. Employing this methodology, our phantom study demonstrated the accuracy of ANGIE T1 estimation with different simulated ECG patterns, including an arrhythmic pattern, and the volunteer study showed in vivo agreement of the ANGIE T1 estimates with MOLLI and previous studies (35-37). We observed that our phantom results showed greater errors for phantoms with longer T1 values. This is primarily attributed to the use of only two recovery heartbeats. These errors can be substantially reduced by using four recovery heartbeats, which would increase the total scan time by a factor of 1.33. Additionally, because ANGIE uses a segmented readout and free breathing, it can be extended to perform a three-dimensional acquisition (42,43). In that case, higher acceleration rates may be feasible due to higher SNR and redundancy along the third dimension. The development of three-dimensional ANGIE will be investigated in the future.
In Figure 6, the higher spatial resolution of ANGIE is not readily apparent, even though the in-plane pixel size is smaller. These data were used for assessment of the LV and for comparing ANGIE and MOLLI T1 values. However, due to through-plane partial volume effects resulting from a slice thickness of 8 mm, the images and T1 maps do not clearly demonstrate the benefits of higher in-plane resolution. In contrast, the RV imaging study used a slice thickness of 4 mm. The improvement in in-plane spatial resolution is very clear in these datasets (see Fig. 7), and this benefit was quantified using the average edge width metric.
In Figure 7, ANGIE and MOLLI show very different T1 values for mediastinal fat. Whereas MOLLI measures the fat T1 properly, ANGIE yields very high values for the T1 of fat. This occurs because our ANGIE scans employed fat suppression to more clearly delineate the borders of the RV wall. With the use of fat suppression, the fat signal is unchanged from one inversion time to the next, resulting in an apparent long T1 for fat. However, when fat suppression is ineffective due to magnetic field inhomogeneity, we attain incomplete suppression and a low T1 estimate, as seen in the examples shown in Figure 6. Thus, for ANGIE with fat suppression, the user should be aware that the fat T1 value will not be correct. This may be an issue in patients with fatty infiltration of myocardium. However, the use of fat suppression is by no means a requirement for ANGIE, and it can be switched off easily.
Assessment of RV fibrosis may be important in diseases such as arrhythmogenic RV dysplasia (44), congenital heart disease, and pulmonary hypertension. To the best of our knowledge, the present study is the first report of T1 mapping of the RV wall. We measured an RV wall T1 of 980±96 ms using high-resolution ANGIE imaging, which is similar to typical T1 estimates of the LV wall. A few prior studies have suggested that the RV wall has shorter postcontrast T1 compared with the LV wall based on the inversion time required to null healthy myocardium in LGE MRI (45,46). However, Grosse-Wortmann et al. proposed that the apparent difference in the T1 relaxation of the RV and LV walls is due to partial volume effects on the thin RV (32). The T1 value (1076±157 ms) of the RV wall that we measured using low-resolution MOLLI trended higher compared with the T1 (974±58 ms) of the LV wall. Thus, our observations are consistent with the partial volume effect conjecture proposed by Grosse-Wortmann et al. (32) and suggest the RV T1 value measured using high-resolution ANGIE is more accurate compared with low-resolution MOLLI.
For high-resolution T1 mapping of the RV using ANGIE, a conservative degree of acceleration (rate 2) was used. In practice, this acceleration rate was achieved by selecting a particular value for the TSPR threshold. A conservative approach was chosen because the aim was to achieve T1 mapping of the RV, which requires excellent image quality with minimal artifact. Future work will aim to further accelerate the acquisition and reduce scan time.
This study on developing and applying ANGIE has some limitations. First, reconstruction of ANGIE images was performed offline, where reconstruction of high-resolution datasets took ∼13.25 min on a standard desktop PC (3.4 GHz Intel i7 CPU with 12 GB RAM). Improving the speed of reconstruction is currently an active area of research. Second, ANGIE has a relatively long scan time compared with existing techniques. A third limitation of this study is that the ANGIE protocol used fat suppression while the MOLLI protocol did not. This difference may have affected both the visualization and edge sharpness comparisons between the two techniques. Although ANGIE has these limitations, its capability to perform high-resolution T1 mapping may open up new avenues of investigation by detecting myocardial fibrosis in thin structures.
In conclusion, we developed the ANGIE method that can acquire high spatial resolution (∼1.1 × 1.1 mm2) cardiac T1 maps within a clinically acceptable scan time by applying navigator gating, compressed sensing and an adaptive acquisition algorithm to a segmented inversion recovery Look-Locker sequence. As a result, ANGIE opens the prospect of performing a quantitative assessment of thin structures such as the RV wall and, possibly in the future, the left atrial walls and subtle features of the peri-infarct zone.
Acknowledgments
NIH National Institute of Biomedical Imaging and Bioengineering
R01 EB 001763
National Heart Lung and Blood Institute
K23 HL 112910-02
American Heart Association
Grant-in-Aid 12GRNT12050301
Siemens Medical Solutions
References
- 1.Iles L, Pfluger H, Phrommintikul A, Cherayath J, Aksit P, Gupta SN, Kaye DM, Taylor AJ. Evaluation of diffuse myocardial fibrosis in heart failure with cardiac magnetic resonance contrast-enhanced T1 mapping. J Am Coll Cardiol. 2008;52:1574–1580. doi: 10.1016/j.jacc.2008.06.049. [DOI] [PubMed] [Google Scholar]
- 2.Marzluf BA, Bonderman D, Pfaffenberger S, et al. Cardiac magnetic resonance T1 mapping for the assessment of diffuse myocardial fibrosis. Circulation. 2011;124:A12360. [Google Scholar]
- 3.Ismail TF, Mistry N, Jabbour A, Ettles C, He T, Wage R, Gulati A, Clark S, Pennell DJ, Prasad SK. Detection of interstitial fibrosis in hypertrophic cardiomyopathy by post-gadolinium bolus CMR T1 mapping. Circulation. 2011;124:A15065. [Google Scholar]
- 4.Flett AS, Hayward MP, Ashworth MT, Hansen MS, Taylor AM, Elliott PM, McGregor C, Moon JC. Equilibrium contrast cardiovascular magnetic resonance for the measurement of diffuse myocardial fibrosis: preliminary validation in humans. Circulation. 2010;122:138–144. doi: 10.1161/CIRCULATIONAHA.109.930636. [DOI] [PubMed] [Google Scholar]
- 5.Jerosch-Herold M, Sheridan DC, Kushner JD, Nauman D, Burgess D, Dutton D, Alharethi R, Li D, Hershberger RE. Cardiac magnetic resonance imaging of myocardial contrast uptake and blood flow in patients affected with idiopathic or familial dilated cardiomyopathy. Am J Physiol Heart Circ Physiol. 2008;295:H1234–H1242. doi: 10.1152/ajpheart.00429.2008. [DOI] [PMC free article] [PubMed] [Google Scholar]
- 6.Jabboour A, Ettles C, Ismail T, et al. Bolus administration T1 mapping as a marker of interstitial myocardial fibrosis in severe aortic stenosis. Circulation. 2011;124:A17191. [Google Scholar]
- 7.Sparrow P, Messroghli DR, Reid S, Ridgway JP, Bainbridge G, Sivananthan MU. Myocardial T1 mapping for detection of left ventricular myocardial fibrosis in chronic aortic regurgitation: pilot study. Am J Roentgenol. 2006;187:W630–W635. doi: 10.2214/AJR.05.1264. [DOI] [PubMed] [Google Scholar]
- 8.Messroghli DR, Walters K, Plein S, Sparrow P, Friedrich MG, Ridgway JP, Sivananthan MU. Myocardial T1 mapping: application to patients with acute and chronic myocardial infarction. Magn Reson Med. 2007;58:34–40. doi: 10.1002/mrm.21272. [DOI] [PubMed] [Google Scholar]
- 9.Radunski UK, Lund G, Nariman MD, Schnackenburg B, Stehning C, Adam G, Blankenberg S, Muellerleile K. Extracellular volume imaging by T1 mapping cardiovascular magnetic resonance in patients with clinically suspected myocarditis. J Cardiovasc Magn Reson. 2013;15(suppl. 1):P116. [Google Scholar]
- 10.Pozo E, Castellano JM, Deochand R, Kanwar A, Ramachandran S, Arias T, Cham M, Narula J, Fuster V, Sanz J. Diagnostic accuracy of myocardial T1-mapping to detect cardiac amyloidosis. Circulation. 2012;126:A17540. [Google Scholar]
- 11.Messroghli DR, Radjenovic A, Kozerke S, Higgins DM, Sivananthan MU, Ridgway JP. Modified Look-Locker inversion recovery (MOLLI) for high-resolution T1 mapping of the heart. Magn Reson Med. 2004;52:141–146. doi: 10.1002/mrm.20110. [DOI] [PubMed] [Google Scholar]
- 12.Piechnik SK, Ferreira VM, Dall’Armellina E, Cochlin LE, Greiser A, Neubauer S, Robson MD. Shortened modified Look-Locker inversion recovery (ShMOLLI) for clinical myocardial T1-mapping at 1.5 and 3 T within a 9 heartbeat breathhold. J Cardiovasc Magn Reson. 2010;12:69–79. doi: 10.1186/1532-429X-12-69. [DOI] [PMC free article] [PubMed] [Google Scholar]
- 13.Candès E, Romberg J, Tao T. Robust uncertainty principles: exact signal reconstruction from highly incomplete frequency information. IEEE Trans Inf Theory. 2006;52:489–509. [Google Scholar]
- 14.Donoho DL. Compressed sensing. IEEE Trans Inf Theory. 2006;52:1289–1306. [Google Scholar]
- 15.Lustig M, Donoho D, Pauly JM. Sparse MRI: the application of compressed sensing for rapid MR imaging. Magn Reson Med. 2007;58:1182–1195. doi: 10.1002/mrm.21391. [DOI] [PubMed] [Google Scholar]
- 16.Pruessmann KP, Weiger M, Scheidegger MB, Boesiger P. SENSE: sensitivity encoding for fast MRI. Magn Reson Med. 1999;42:952–962. [PubMed] [Google Scholar]
- 17.Barral J, Nishimura D. Compressed sensing for motion artifact reduction; Proceedings of the 17th Annual Meeting of ISMRM, Honolulu, Hawaii, USA; 2009. p. p. 4593. [Google Scholar]
- 18.Donoho DL, Elad M. Optimally sparse representation in general (non-orthogonal) dictionaries via l minimization. Proc Natl Acad Sci U S A. 2003;100:2197–2202. doi: 10.1073/pnas.0437847100. [DOI] [PMC free article] [PubMed] [Google Scholar]
- 19.Jung H, Ye JC. Motion estimated and compensated compressed sensing dynamic magnetic resonance imaging: what we can learn from video compression techniques. Int J Imaging Syst Technol. 2010;20:81–98. [Google Scholar]
- 20.Karlsen OT, Verhagen R, Bovee WM. Parameter estimation from Rician-distributed data sets using a maximum likelihood estimator: application to T1 and perfusion measurements. Magn Reson Med. 1999;41:614–623. doi: 10.1002/(sici)1522-2594(199903)41:3<614::aid-mrm26>3.0.co;2-1. [DOI] [PubMed] [Google Scholar]
- 21.Zhang Y, Yeung HN, O’Donnell M, Carson PL. Determination of sample time for T1 measurement. J Magn Reson Imaging. 1998;8:675–681. doi: 10.1002/jmri.1880080324. [DOI] [PubMed] [Google Scholar]
- 22.Look DC, Locker DR. Time saving in measurement of NMR and EPR relaxation times. Rev Sci Instrum. 1970;41:250–251. [Google Scholar]
- 23.Taylor AM, Jhooti P, Wiesmann F, Keegan J, Firmin DN, Pennell DJ. MR navigator-echo monitoring of temporal changes in diaphragm position: implications for MR coronary angiography. J Magn Reson Imaging. 1997;7:629–636. doi: 10.1002/jmri.1880070404. [DOI] [PubMed] [Google Scholar]
- 24.Le Roux P. Simplified model and stabilization of SSFP sequences. J Magn Reson. 2003;163:23–37. doi: 10.1016/s1090-7807(03)00115-0. [DOI] [PubMed] [Google Scholar]
- 25.Lingala S, Hu Y, Dibella E, Jacob M. Accelerated dynamic MRI exploiting sparsity and low-rank structure: k-t SLR. IEEE Trans Med Imaging. 2011;30:1042–1054. doi: 10.1109/TMI.2010.2100850. [DOI] [PMC free article] [PubMed] [Google Scholar]
- 26.Walsh DO, Gmitro AF, Marcellin MW. Adaptive reconstruction of phased array MR imagery. Magn Reson Med. 2000;43:682–690. doi: 10.1002/(sici)1522-2594(200005)43:5<682::aid-mrm10>3.0.co;2-g. [DOI] [PubMed] [Google Scholar]
- 27.Kellman P, Arai AE, McVeigh ER, Aletras AH. Phase-sensitive inversion recovery for detecting myocardial infarction using gadolinium-delayed hyperenhancement. Magn Reson Med. 2002;47:372–383. doi: 10.1002/mrm.10051. [DOI] [PMC free article] [PubMed] [Google Scholar]
- 28.Wang Z, Bovik AC, Sheikh HR, Simoncelli EP. Image quality assessment: from error visibility to structural similarity. IEEE Trans Image Process. 2004;13:600–612. doi: 10.1109/tip.2003.819861. [DOI] [PubMed] [Google Scholar]
- 29.Mitchell MD, Kundel HL, Axel L, Joseph PM. Agarose as a tissue equivalent phantom material for NMR imaging. Magn Reson Imaging. 1986;4:263–266. doi: 10.1016/0730-725x(86)91068-4. [DOI] [PubMed] [Google Scholar]
- 30.Kato H, Kuroda M, Yoshimura K, Yoshida A, Hanamoto K, Kawasaki S, Shibuya K, Kanazawa S. Composition of MRI phantom equivalent to human tissues. Med Phys. 2005;32:3199–3208. doi: 10.1118/1.2047807. [DOI] [PubMed] [Google Scholar]
- 31.Mertens LL, Friedberg MK. Imaging the right ventricle—current state of the art. Nature Rev Cardiol. 2010;7:551–563. doi: 10.1038/nrcardio.2010.118. [DOI] [PubMed] [Google Scholar]
- 32.Grosse-Wortmann L, Macgowan CK, Vidarsson L, Yoo SJ. Late gadolinium enhancement of the right ventricular myocardium: is it really different from the left? J Cardiovasc Magn Reson. 2008;10:20. doi: 10.1186/1532-429X-10-20. [DOI] [PMC free article] [PubMed] [Google Scholar]
- 33.Marziliano P, Dufaux F, Winkler S, Ebrahimi T. Perceptual blur and ringing metrics: applications to JPEG2000. Signal Processing: Image Communication. 2004;19:163–172. [Google Scholar]
- 34.Mehta BB, Chen X, Salerno M, Kramer CM, Epstein FH. High resolution cardiac T1 mapping using an adaptive data acquisition algorithm combining navigator gating and compressed sensing; Proceedings of the 21st Annual Meeting of ISMRM, Salt Lake City, Utah, USA; 2013. p. 4570. [Google Scholar]
- 35.Barth M, Moser E. Proton NMR relaxation times of human blood samples at 1.5 T and implications for functional MRI. Cell Mol Biol. 1997;43:783–791. [PubMed] [Google Scholar]
- 36.Spees WM, Yablonskiy DA, Oswood MC, et al. Water proton MR properties of human blood at 1.5 Tesla: magnetic susceptibility, T(1), T(2), T*(2), and non-Lorentzian signal behavior. Magn Reson Med. 2001;45:533–542. doi: 10.1002/mrm.1072. [DOI] [PubMed] [Google Scholar]
- 37.Flacke SJ, Fischer SE, Lorenz CH. Measurement of the gadopentetate dimeglumine partition coefficient in human myocardium in vivo: normal distribution and elevation in acute and chronic infarction. Radiology. 2001;218:703–710. doi: 10.1148/radiology.218.3.r01fe18703. [DOI] [PubMed] [Google Scholar]
- 38.Mehta BB, Chen X, Salerno M, Kramer CM, Epstein FH. Accelerated and navigator-gated Look-Locker imaging for cardiac T1 estimation (ANGIE) with reduced motion artifact. J Cardiovasc Magn Reson. 2012;14(suppl. 1):O110. [Google Scholar]
- 39.Song T, Stainsby JA, Ho VB, Hood MN, Slavin GS. Flexible cardiac T1 mapping using a modified Look-Locker acquisition with saturation recovery. Magn Reson Med. 2012;67:622–627. doi: 10.1002/mrm.24137. [DOI] [PubMed] [Google Scholar]
- 40.Chow K, Flewitt JA, Pagano JJ, Green JD, Friedrich MG, Thompson RB. MOLLI T1 values have systematic T2 and inversion efficiency dependent errors; Proceedings of the 20th Annual Meeting of ISMRM, Melbourne, Australia; 2012. p. 395. [Google Scholar]
- 41.Fitts M, Breton E, Kholmovski EG, Dosdall DJ, Vijaykumar S, Hong KP, Ranjan R, Marrouche NF, Axel L, Kim D. Arrhythmia insensitive rapid cardiac T1 mapping pulse sequence. Magn Reson Med. 2013;70:1274–1282. doi: 10.1002/mrm.24586. [DOI] [PubMed] [Google Scholar]
- 42.Voigt T, Schaeffter T, Botnar R, Smink J, Henningsson M. Three-dimensional MOLLI for myocardial T1 mapping using respiratory navigation and inversion time gating; Proceedings of the 21st Annual Meeting of ISMRM, Salt Lake City, Utah, USA; 2013. p. 258. [Google Scholar]
- 43.Henningsson M, Botnar R, Voigt T. 3D saturation recovery imaging for free-breathing myocardial T1 mapping; Proceedings of the 21st Annual Meeting of ISMRM, Salt Lake City, Utah, USA; 2013. p. 4520. [Google Scholar]
- 44.Tandri H, Saranathan M, Rodriguez ER, Martinez C, Bomma C, Nasir K, Rosen B, Lima JA, Calkins H, Bluemke DA. Noninvasive detection of myocardial fibrosis in arrhythmogenic right ventricular cardiomyopathy using delayed-enhancement magnetic resonance imaging. J Am Coll Cardiol. 2005;45:98–103. doi: 10.1016/j.jacc.2004.09.053. [DOI] [PubMed] [Google Scholar]
- 45.Kim RJ, Shah DJ, Judd RM. How we perform delayed enhancement imaging. J Cardiovasc Magn Reson. 2003;5:505–514. doi: 10.1081/jcmr-120022267. [DOI] [PubMed] [Google Scholar]
- 46.Desai MY, Gupta S, Bomma C, Tandri H, Foo TK, Lima JA, Bluemke DA. The apparent inversion time for optimal delayed enhancement magnetic resonance imaging differs between the right and left ventricles. J Cardiovasc Magn Reson. 2005;7:475–479. doi: 10.1081/jcmr-200053534. [DOI] [PubMed] [Google Scholar]


