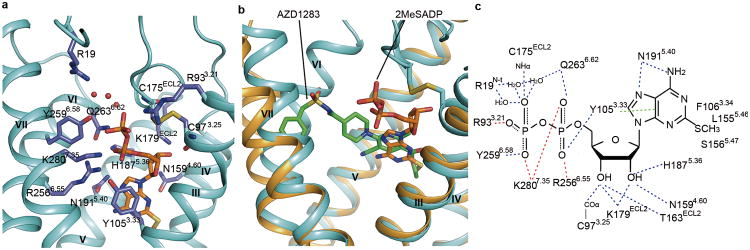
Fig. 3.

P2Y12R ligand binding pocket for 2MeSADP. (a) The receptor is shown in cyan cartoon representation. The ligand 2MeSADP (orange carbons) and receptor residues (slate carbons) involved in ligand binding are shown in stick representation. Other elements are colored as follows: oxygen, red; nitrogen, dark blue; sulfur, yellow; phosphorus, orange. The water molecules interacting with 2MeSADP are shown as red spheres. (b) Comparison of the 2MeSADP and AZD1283 binding poses in the overlaid P2Y12R complexes. Color scheme as in Fig. 2. (c) Summary of receptor interactions of 2MeSADP. Hydrogen bonds are displayed as blue dashed lines and the salt bridges as red dashed lines. The π-π interaction between 2MeSADP and Y1053.33 is indicated as green dashed lines. The NHα and COα indicate the main chain amine and carbonyl groups of the corresponding residue.
