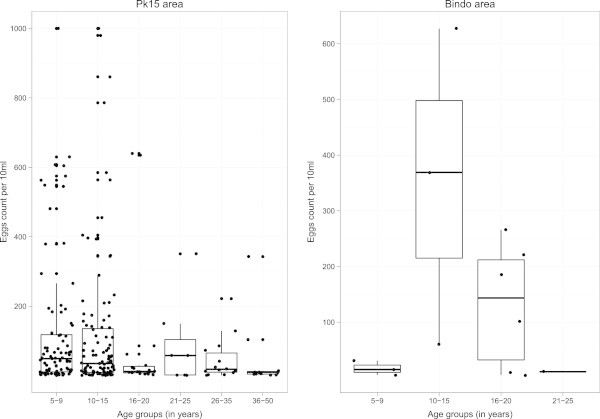
Figure 5.

Intensity of Schistosoma haematobium infection per age group in the different study area. Boxplot represent the median eggs count (median horizontal line) as well as the first (lower horizontal line) and the third (upper horizontal line) interquartile. Each dot is representative of the eggs count of a single subject.
