

Abstract
This study was to examine whether mast cell chymase exists in human keloids and exerts its profibrotic effect via transforming growth factor-β1/Smad signaling pathway. The number of mast cells and the expression levels of chymase in keloids and normal skin were examined by immunohistochemistry assays. The mRNA expression and activity changes of chymase in keloids and normal skin were determined by real-time quantitative PCR and radioimmunoassay. After keloid fibroblasts were treated with different concentrations of chymase (0, 15, 30, 60, and 120 ng/mL) for various time periods, the proliferation of keloid fibroblasts, collagen synthesis, mRNA and protein expression of TGF-β1, and the protein expression of phosphorylated Smad2/3, Smad2/3 and Smad7 were investigated using MTT assay, ELISA and Western blotting. Mast cells and chymase exist in keloid. Gene expression and activity of mast cell chymase in keloid are significantly higher than those in normal skin. Chymase promotes keloid fibroblast proliferation and collagen synthesis by activating TGF-β1. The activation of Smad protein signaling pathway by chymase is related to the elevated P-Smad protein expression in keloid fibroblasts. Our data demonstrated that mast cell chymase plays an important role in keloid formation through TGF-β1/Smad signaling pathway.
Keywords: Mast cell chymase, keloid, fibroblast, transforming growth factor-β1, Smad
Introduction
Keloid is a kind of benign tumor specific for human skin, without potential characteristics for becoming malignant. It cannot regress automatically or grow outside of its original wound edge, but can affect appearance or cause organ deformity and dysfunction. One of the key characteristics of keloid is abnormal elevation of fibroblast activities, which cause a great amount of connective tissue proliferation and hyaline degeneration and hence, leading to the overgrowth of keloid. However, the mechanism is still unclear.
Studies indicated that transforming growth factor (TGF)-β1/Smad signaling pathway is playing an important role during the formation of keloid [1] and the inhibition of TGF-β1-Smad signaling pathway markedly reduces the formation of keloid [2]. TGF-β1 is one of the most important cytokines that promote the proliferation of fibroblast and induce the production of extracellular matrix. TGF-β1 and TGF-β1/Smad signaling pathway are involved in the occurrence and development of several fibrotic diseases in liver [3], the lungs, and skin [2,4], etc. Smad proteins are downstream signaling molecules of TGF-β that mediate the intracellular signaling transduction of TGF-β. Smad protein is a family of signaling protein that participates in the intracellular signal transduction of TGF-β superfamily [5] and is the only known substrate for TGF-βR cytoplasmic kinase [6]. Smad family proteins can be classified into receptor-activated Smad (R-Smad: Smad1, 2, 3, 5 and 8), common mediator Smad (Co-Smad: Smad4) and inhibitory Smad (I-Smad: Smad6 and 7) [7]. After TGF-β binds to its receptors as a ligand, Smad2 and Smad3 are activated to form a trimer with Smad4 and the trimer is dislocated into the nucleus to regulate the transcription of target genes [8]. Inhibitory Smad6 and Smad7 can bind tightly to the activated TGF-β-I receptor to prevent R-Smad from phosphorylation. In addition, Smad6 can inhibit signal transduction by inhibiting the binding of Smad4 and R-Smad [9]. As a result, the biological effects of TGF-β under physiological and pathological conditions are achieved by the precise cooperation among the various types of Smad proteins in the TGF-β/Smad signaling pathway.
Chymase is a kind of serine protease that exists in the secretory granules of mast cells. The release and activation of chymase promote the activation of TGF-β1 by extremes of pH and by plasmin [10]. Taipale et al. [11] showed that chymase in human epithelial and endothelial cells facilitated the release of TGF-β1 from the protein where it bound to. After human fibroblasts were cultured with mast cell chymase, the concentration of TGF-β1 increased significantly, but the increased TGF-β1 can be inhibited by chymase inhibitors. In addition, anti-TGF-β1 neutralizing antibodies completely inhibited the proliferation of fibroblasts induced by chymase, indicating that chymase induced cell proliferation by the activation of TGF-β1 [12]. TGF-β1 is involved in several fibrotic diseases and chymase-dependent activation of TGF-β1 facilitates the development of fibrotic diseases [2-4].
The present study is to determine whether mast cell chymase exists in keloid and to investigate its function in TGF-β1/Smad signaling pathway.
Materials and methods
Tissue sample collection
Fresh keloid and normal skin samples were obtained from 5 healthy subjects with keloid and another 5 healthy subjects that needed reconstruction of body surface defects. All the subjects were patients of the Department of Burns and Plastic Surgery of The First Affiliated Hospital of Xinjiang Medical University. This study was approved by Ethics Committee of Xinjiang Medical University and the informed consent forms were signed by all the subjects. The sources of human keloid and normal skin tissues are listed in Table 1.
Table 1.
Sources of human keloid and normal skin tissues
| Patients | Age (years) | Sex | Site of biopsy | Family history | Medical history |
|---|---|---|---|---|---|
| KFs | 25 | F | Chest | - | 12 months |
| 33 | F | Ear | + | 10 months | |
| 23 | F | Ear | - | 25 months | |
| 28 | F | Chest | + | 9 months | |
| 22 | F | Neck | - | 10 months | |
| NFs | 20 | F | Abdomen | - | 2 years |
| 25 | F | Abdomen | - | 1 year | |
| 27 | M | Crus | - | 3 years | |
| 40 | F | Forearm | - | 6 months | |
| 24 | F | Forearm | - | 8 months |
Note: Keloid in chest and ear. Keloid is prone to occur in earlobe, shoulder, chest and neck. In this study, most of the keloid samples were obtained from earlobe and chest by piercing.
Immunohistochemical staining of mast cells and mast cell chymase
The immunohistochemical staining of mast cells and mast cell chymase was performed with rabbit anti-human CD117 (C-Kit) polyclonal antibody and mouse anti-chymase polyclonal antibody as the primary antibodies (both antibodies were purchased from Gene Company Ltd.). The expression of CD117 and chymase was determined by testing CD117 and chymase antibodies in keloid and normal skin using EnVision+ [13], in which the primary antibody is diluted 1:500, and the secondary antibody is anti-rabbit EnVision+ antibody. Brown staining of cell membrane and cytoplasm under the microscope is considered as positive staining. The negative control is performed with phosphate-buffered saline (PBS) in place of primary antibodies.
Real-time quantitative PCR analysis of mast cell chymase in keloid and normal skin
For the analysis of human keloid and skin mast cell chymase gene expression, we synthesized specific primer pairs and evaluated the levels of mRNA by real-time quantitative reverse transcription PCR procedure. The human mast cell chymase primers used in this study are: forward, 5’-CTG AGA GGA TGC TTC TTC CTG C-3’, and reverse, 5’-AGA TCT TAT TGA TCC AGG GCC G-3’. GAPDH primers are: forward, 5’-AAC TCC ATC ATG AAG TGT GA-3’, and reverse, 5’-ACT CCT GCT TGC TGA TCC AC-3’. Total RNA was extracted using Trizol reagent, treated with chloroform/isopropyl alcohol/75% ethyl alcohol, and then stored in electrical refrigerators at -80°C. For reverse transcription, 1.5 μg of total RNA from each RNA preparation was added to 20 μL of reaction mixture containing 1 μL oligo (dT) primer, 1 μL reverse transcriptase and 4 μL buffer. The reaction mixture was incubated at 37°C for 1 hour before being terminated by heating at 85°C for 5 minutes. Then, 5 μL of the reaction solution was used for amplification in 20 μL real-time PCR reaction mixture containing 10 μL SYBR Premix Ex Taq, 0.25 μL target primer/0.25 μL β-actin primer, and 4.5 μL ddH2O (Takara Biotechnology (Dalian) CO. LTD., China). PCR was performed using Thermal Cycler Dice Real Time System (Bio-Rad, USA). Cycling conditions of chymase were 95°C for 3 minutes, 35 cycles at 95°C for 45 seconds, 55°C for 45 seconds and 72°C for 45 seconds with a final elongation at 72°C for 5 minutes. Cycling conditions of β-actin were 95°C for 4 minutes, 35 cycles at 95°C for 30 seconds, 60°C for 30 seconds and 72°C for 2 minutes with a final elongation at 72°C for 7 minutes. The specificity of the PCR product was examined by dissociation curve analysis, and the relative quantification of gene expression was normalized to GAPDH that served as internal standard.
Radioimmunoassay
Chymase activities in keloid and normal skin tissues were determined by radioimmunoassay [14]. The tissue samples (0.1 g) were rinsed with saline before being cut into small pieces. The tissues were then homogenized in liquid nitrogen, put into 10 mL cooled sodium dihydrogen phosphate (50 mmol/L, pH 7.4) and centrifuged at 4°C at 9,000 rpm. Supernatant was discarded and the deposit was put into 10 mL cooled sodium dihydrogen phosphate (50 mmol/L, pH 7.4). Buffer solution was centrifuged at 4°C at 30,000 rpm after ultrasound homogenization, and the supernatant containing chymase was collected. The above procedure was repeated for three times. Subsequently, each tissue suspension was divided into three groups (500 μL/group). Ang I (6 ng) was added into each group, lisinopril (ACE inhibitor, 50 μmol/L) was added into group 2 and aprotinin (20 μmol/L) was added in group 3. The three groups were incubated at 37°C for 10 minutes and the reaction was terminated by adding 1.5 mL 4°C ethanol. The amount of Ang II in each group was determined using radioimmunoassay according to the manufacturer’s instructions (Beijing North Institute of Biotechnology, China). After the reaction, the enzymatic activities were calculated based on the increase of Ang II. The enzymatic activity in the reaction without any inhibitor was total activity, whereas the activity inhibited by lisinopril was considered to be ACE activity and the residual activity after inhibition by aprotinin was considered to be chymase activity. The amount of enzymes required for producing 1 nmol AngII per minute was defined as unit (U). Chymase activity was expressed as U/mg.
Keloid cell culture
Keloid samples were treated with PBS containing ampicillin and streptomycin sulfate. The epidermis and subcutaneous fat were rinsed off from the keloid samples with PBS. The small pieces of keloid samples (about 1 mm3) were incubated in the culture flasks containing DMEM, 200 U/ml collagenase and 300 U/ml hyaluronidase at 4°C overnight. Cells were treated with PBS containing 0.25% trypsinase and 0.02% EDTA at 37°C, terminated by the addition of FBS, and then collected by centrifugation at 1,000 g for 10 min. The collected cells were incubated in 20% FBS (Sigma Chemical Co., St. Louis, MO, USA) at 37°C for 6-8 h, followed by continued culture in DMEM medium containing 10% FBS. The medium was changed every 2-3 days. Cell growth and morphological developments were observed under an inverted microscope. Cells cultured for 3-6 passages were used for further studies.
Cell proliferation assay
Cells in the logarithmic phase were prepared as single-cell suspension for inoculation into 96-well plates. Cell density was adjusted to 3×10⁴/mL, and 200 mL of the suspension was added to each well. Upon cell adherence, DMEM containing 10% FBS was used instead. The cells were divided into five groups. Chymase (cat#: C8118, Sigma Chemicals Co., Ltd., USA) dissolved in DMEM was added to five groups at 0, 15, 30, 60 and 120 ng/mL, respectively. DMEM alone was added to the control group. There were six parallel samples for each group. Cells were cultured for another 24, 48, 72 and 96 h before analyses. At the end of incubation, 20 μL of 0.5% 3-(4,5-Dimethylthiazol-2-yl)-2,5-diphenyltetrazolium bromide (MTT) were added to each well, followed by incubation at 37°C for 4 h. The supernatant was discarded, and 150 μL of DMSO were added into each well. The plates were shaken for 10 min to dissolve blue formazan crystals. The growth status and morphological changes of the cells were detected under an inverted microscope. The absorbance was determined at 490 nm (optical density value) using a Synergy HT microplate reader (Thermo Fisher Scientific, USA).
ELISA assay for type I collagen expression
Cells were cultured for 6, 12 and 24 h with chymase in different concentrations. The levels of type I collagen in the medium was determined using ELISA kit according to the manufacturer’s instructions (USCN, China). Briefly, ELISA plates were coated with type I collagen antibody (1:500; cat#: sc-8784-R, Santa Cruz Biotechnology, USA), and the non-specific binding sites were blocked with PBS-bovine serum albumin. Type I collagen standards or medium samples were then added to the wells (100 μL/well) and incubated for 2 h at room temperature. All samples and standards were measured in triplicate.
RNA isolation and real-time quantitative PCR
The expression of TGF-β1 and type I collagen mRNA was determined by real-time quantitative PCR. At the end of the incubation, total RNA was extracted following the established method using Trizol reagent (Invitrogen, USA). Complementary DNA was synthesized from 2 μg of total RNA with AMV reverse transcriptase kit (Promega, USA) according to the manufacturer’s instructions. Real-time quantitative PCR amplification was carried out on an IQ5 real-time PCR system (Bio-Rad, USA) using a SYBR Premix Ex Taq kit (TAKARA BIOTECHNOLOGY (DALIAN) CO., LTD., China) following the manufacturer’s instructions. Briefly, all real-time PCR reactions were performed in a total reaction volume of 20 μl. The experiment protocol consists of 1 cycle of initial denaturation for 30 s at 95°C, 40 cycles of amplification for 5 s at 95°C, 30 s at 55°C and 60 s at 72°C, followed by melting curve analysis in which the temperature was increased from 65 to 95°C at 0.5°C increments. Relative gene expression was calculated using the 2-ΔΔCT method with initial normalization of TGF-β1 and type I collagen against GAPDH. The sequences of the specific primers were as follows: TGF-β1 (158 bp), 5’-ACA CCA ACT ATT GCT TCA G-3’ (sense) and 5’-TGT CCA GGC TCC AAA TG-3’ (antisense); COL1A1 (147 bp), 5’-CCC GGG TTT CAG AGA GAC AAC TTC-3’ (sense) and 5’-TCC ACA TGC TTT ATT CCA GCA ATC-3’ (antisense); ANG (197 bp), 5’-CAA GGT GGA GGG TCT CAC-3’ (sense) and 5’-CTG ATG CGG TCA TTG CTC-3’ (antisense); GAPDH (137 bp), 5’-GCA CCG TCA AGG CTG AGA AC-3’ (sense) and 5’-TGG TGA AGA CGC CAG TGGA-3’ (antisense). In all cases, each PCR trial was performed with triplicate samples and repeated for least three times.
Protein extraction and assay
Cells seeded on 6-well plates at a density of 5×10⁴ cells/well were untreated or treated with different reagents for indicated periods. At the end of the incubation, cells were rinsed with ice cold PBS and lysed in 500 μL radioimmunoprecipitation (RIPA) buffer (BioTeke Corporation, China) in the presence of protease inhibitor cocktail (1 μg/mL phosphatase inhibitors, and 1 mM phenylmethanesulfonyl fluoride) for 30 min on ice. Total lysates were centrifuged (12,000 g, 4°C, 10 min) to pellet cell debris. The supernatant fraction was stored at -80°C and used for the protein determination of TGF-β1, p-Smad2/3, Smad2/3, Smad7 and GAPDH. Protein concentrations were determined with BCA protein assay kit (BioTeke Corporation, China).
Western blotting analysis
Prestained low molecular weight marker and 30 μg protein samples were subject to 12% SDS-PAGE. Separated protein was transferred onto polyvinylidene fluoride membranes that were blocked in TBS-T (10 mM Tris [pH 7.6], 150 mM NaCl, and 0.1% Tween-20) containing 5% skim milk powder for 1 h at room temperature, followed by incubation with primary antibodies TGF-β1 (1:300, cat#: sc-146, Santa Cruz Biotechnology, USA), P-Smad2/3 (phosphorylated Smad2/3, 1:1000, cat#: 8828s, Cell Signaling Technology, USA), Smad2/3 (1:300, cat#: sc-8332, Santa Cruz Biotechnology, USA), Smad7 (1:300, cat#: sc-11392, Santa Cruz Biotechnology, USA), GAPDH (1:300, cat#: sc-25778, Santa Cruz Biotechnology, USA) overnight at 4°C. The blots were rinsed with TBS-T, and incubated with alkaline phosphatase conjugated secondary antibodies (1:1000, cat#: 77054s, Cell Signaling Technology, USA) for 2 h at room temperature. Bands on Western blots were visualized by BCIP/NBT kit (Life technologies, USA) according to the manufacturer’s protocol. Optical densities of the bands were scanned and quantified with image analysis software, Quantity One (Bio-Rad, USA).
Statistical analysis
The data are presented as means ± SD. Statistical differences between groups were assessed by one-way ANOVA, followed by LSD post hoc test. Differences were considered statistically significant when P < 0.05.
Results
Mast cells and chymase exist in keloid
To test whether mast cell and mast cell chymase exist in keloid, immunohistochemical staining was performed. Our results showed that the number of mast cells whose membrane was stained into brown in keloid and the brown granules that represented mast cell chymase in the cytoplasm of keloid were both more than those of normal skin tissues (Figure 1). This observation suggested that mast cell and chymase existed in keloid and that mast cells in keloid degranulated to release chymase to exert effects.
Figure 1.

Staining of the mast cells. A and B: Mast cell anti-CD117 antibody staining. Mast cell membrane staining is brown. A: Keloid, 400×, bar = 50 μm; B: Normal skin, 400×, bar = 50 μm. C and D: Mast cell chymase staining. Cytoplasm staining is brown. 400×, bar = 50 μm. A: Keloid, showing strong positive expression, 400×, bar = 50 μm; B: Normal skin, 400×, bar = 50 μm.
Gene expression and activity of mast cell chymase in keloid are significantly higher than those in normal skin
To measure the expression and activities of mast cell chymase in keloid, real-time quantitative PCR and radioimmunoassay were used. The data demonstrated that the gene expression and activity of mast cell chymase in keloid were significantly higher than those in normal skin (P < 0.05) (Figure 2). The changes of the number and activities of mast cells are important in the abnormal healing process of the wounded skin [15], in which chymase released by mast cell activation and degranulation might play some roles.
Figure 2.
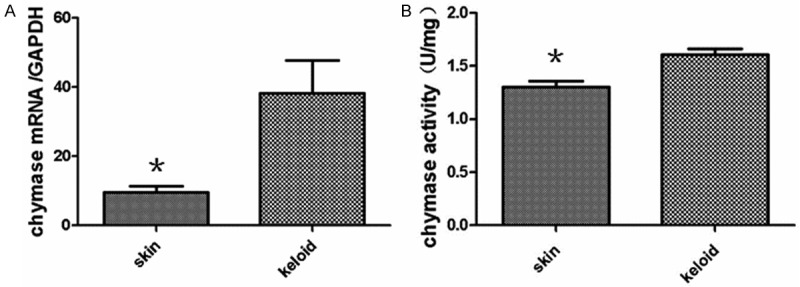
A: Quantitative analysis of chymase mRNA levels between keloid and normal skin. Real-time quantitative PCR data are expressed as means ± SD (n = 10). Asterisks indicate values that are significantly different from those for normal skin (P < 0.05). B: Chymase activity in keloid and normal skin tissues as determined by radioimmunoassay. Data are expressed as means ± SD (n = 10).
Fibroblast proliferation in keloid exhibits different response to mast cell chymase compared with that in normal skin
To determine cell proliferation, MTT assay was employed. Data indicated that keloid fibroblast proliferation was significantly increased after being treated with 15 and 30 ng/mL mast cell chymase compared with the control group (P < 0.01), and showed a time-dependent manner. However, keloid fibroblast proliferation was decreased as the increase of chymase concentration (Figure 3). By contrast, previous reports [16] showed that the fibroblast proliferation of normal skin had concentration and time dependent manners to the treatment of mast cell chymase. This suggested that fibroblast proliferation in keloid had different response to mast cell chymase compared with that in normal skin.
Figure 3.
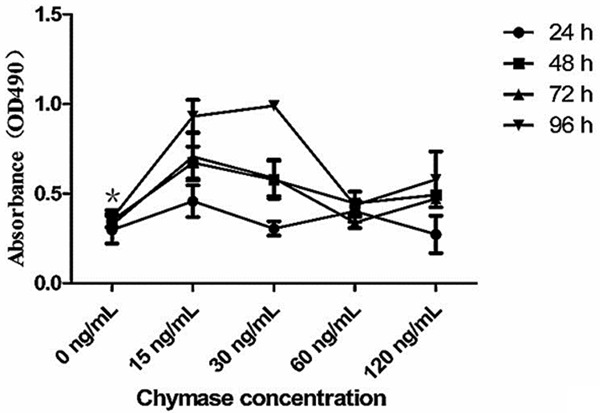
The effects of chymase on keloid fibroblast proliferation. Cells were treated with chymase (0, 15, 30, 60 and 120 ng/ml) for 24, 48, 72 or 96 h. Cell proliferation was determined by MTT assay. Data are means ± SD. Asterisks indicate significant differences (P < 0.05).
Mast cell chymase promotes the production of type I collagen, but the production decreases after longer time of treatment
To test the expression of type I collagen, ELISA assay was employed. The gene expression of type I collagen in the groups treated with different concentrations of mast cell chymase for 12 hours, was significantly higher than that in the control group (P < 0.05). In the treatment groups of 15 ng/mL and 120 ng/mL chymase, the highest mRNA expression of type I collagen appeared after 6 and 24 hours, respectively. After being treated with different concentrations of chymase for 6 hours, the concentration of type I collagen produced by keloid fibroblasts in the treatment group of 120 ng/mL was higher than that in the control group, whereas that of other treatment groups were lower than that in the control group. The concentration of type I collagen in all groups were higher than that in the control group after treatment for 12 hours (P < 0.05), but were lower than that in the control group after treatment for 24 hours (Figure 4). Our data suggested that mast cell chymase promoted the production of type I collagen, but the production decreased after longer time of treatment.
Figure 4.
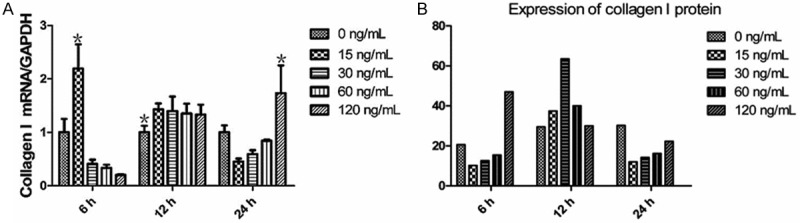
A: The effects of chymase (0, 15, 30, 60 and 120 ng/ml) on type I collagen mRNA expression in keloid fibroblasts. Data are means ± SD. Asterisks indicate significant differences (P < 0.05). B: The effects of chymase (0, 15, 30, 60 and 120 ng/ml) on type I collagen protein expression in keloid fibroblasts. Data are means ± SD. Asterisks indicate significant differences (P < 0.05).
TGF-β1 expression in keloid fibroblasts is affected by different concentrations of mast cell chymase and different lengths of treatment time
To examine the mRNA and protein expression of TGF-β1, real-time quantitative PCR and Western blotting assays were used. After 24 hours of treatment with different concentrations of mast cell chymase, the mRNA expression of TGF-β1 in keloid fibroblasts was significantly higher than the control group (P < 0.05) with the 15 ng/mL group being the highest. By contrast, the mRNA expression of TGF-β1 after 6 and 12 hours of treatment with different concentrations of chymase was lower than the control group. These data indicated that the mRNA expression of TGF-β1 was significantly promoted by longer time of mast cell chymase treatment. Western blotting analysis showed that TGF-β1 protein expression in keloid fibroblasts being treated with 60 and 120 ng/mL chymase was significantly higher than that in the control group (P < 0.05) for the time points of 6, 12 and 24 hours, with the effect at 12 hour time point being the most significant. By contrast, TGF-β1 protein expression in keloid fibroblasts being treated with 15 and 30 ng/mL chymase was lower than that in the control group (Figure 5). These data suggested treatment with 60 and 120 ng/mL mast cell chymase promoted TGF-β1 protein expression in keloid fibroblasts.
Figure 5.
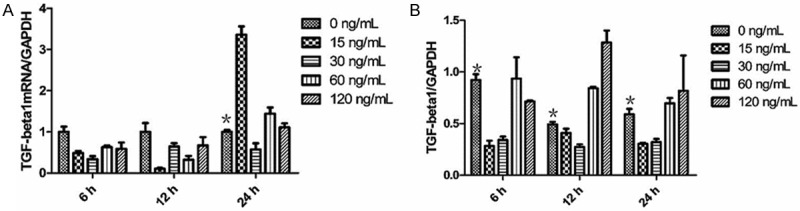
A: The effects of chymase (0, 15, 30, 60 and 120 ng/ml) on TGF-β1 mRNA expression in keloid fibroblasts. Data are means ± SD. Asterisks indicate significant differences (P < 0.05). B: The effects of chymase (0, 15, 30, 60 and 120 ng/ml) on TGF-β1 protein expression in keloid fibroblasts. Data are means ± SD. Asterisks indicate significant differences (P < 0.05).
Mast cell chymase upregulates Smad proteins in keloid fibroblasts
To understand the effect of Smad proteins on the TGF-β1 expression and collagen synthesis in keloid fibroblasts induced by mast cell chymase, we investigated the protein expression of phorphorylated Smad2/3 (P-Smad2/3) and cytoplasmic Smad2/3 and Smad7 by Western blotting. Western blotting analysis indicated that, after being treated with 60 and 120 ng/mL mast cell chymase for 6, 12 and 24 hours, the levels of P-Smad2/3 in keloid fibroblasts increased over treatment time and were all higher than that of the control group (P < 0.05) (Figures 6A and 7). By contrast, the levels of P-Smad2/3 in keloid fibroblasts treated with 15 and 30 ng/mL mast cell chymase for 6, 12 and 24 hours were all lower than the control group. After being treated with 60 and 120 ng/mL mast cell chymase for 6, 12 and 24 hours, the protein expression of Smad2/3 in keloid fibroblasts were significantly increased compared with the control group (P < 0.05). For the treatment with 60 ng/mL chymase, Smad2/3 protein expression reached the peak after 24 hours; for the treatment with 120 ng/mL chymase, Smad2/3 protein expression reached the peak after 12 hours (Figures 6B and 7). For the treatment with 60 ng/mL chymase, Smad7 protein expression in keloid fibroblasts reached the highest point after 6 hours and the lowest point after 12 hours; for the treatment with 120 ng/mL chymase, Smad7 protein expression reached the peak after 12 hours. For both 60 and 120 ng/mL treatment groups, Smad7 protein expression was higher than the control group after 24 hours (Figures 6C and 7). These data suggested that 60 and 120 ng/mL mast cell chymase upregulated proteins related to Smad signal transduction in keloid fibroblasts.
Figure 6.
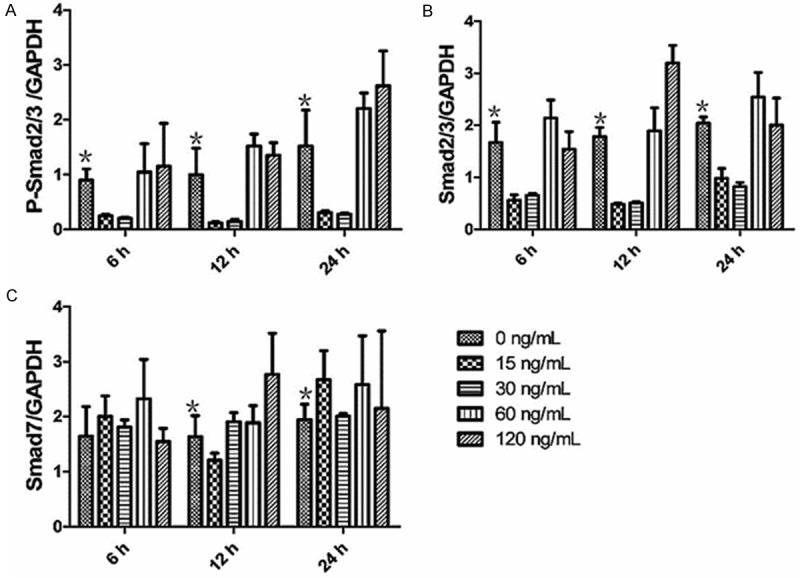
A: The effects of chymase (0, 15, 30, 60 and 120 ng/ml) on P-Smad2/3 protein expression in keloid fibroblasts. Data are means ± SD. Asterisks indicate significant differences (P < 0.05). B: The effects of chymase (0, 15, 30, 60 and 120 ng/ml) on Smad2/3 protein expression in keloid fibroblasts. Data are means ± SD. Asterisks indicate significant differences (P < 0.05). C: The effects of chymase (0, 15, 30, 60 and 120 ng/ml) on Smad7 protein expression in keloid fibroblasts. Data are means ± SD. Asterisks indicate significant differences (P < 0.05).
Figure 7.
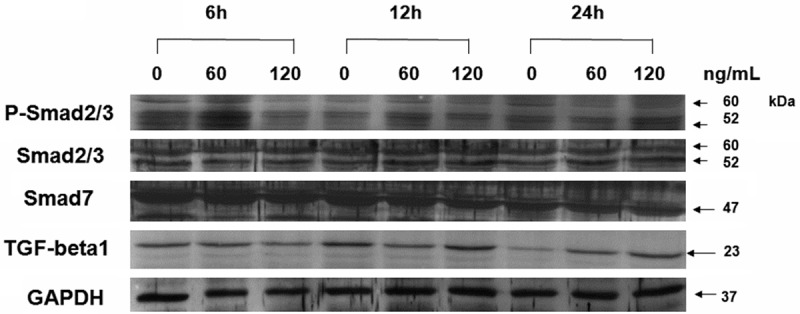
Western blots showing the levels of TGF-β1, P-Smad2/3, Smad2/3, Smad7 and GAPDH in human keloid fibroblasts treated with various concentrations of chymase (0, 60 and 120 ng/ml) for 6, 12 or 24 h.
Discussion
Keloid is a kind of chronic inflammatory fibrotic disease with distinct histological features such as abnormal increase of extracellular matrix, inflammatory cell (e.g. mast cells) infiltration, and aggregation of a large amount of cytokines [17]. The inflammatory part of keloid is usually red in color, with accompanied inflammatory cells including mast cells and macrophages [18]. Mast cells are considered to be the main cells participating in the allergic skin inflammation [19], and their quantity and quality change during abnormal skin wound healing, indicating that mast cells play an important role in pathological keloid formation [20]. After the activation of mast cells by degranulation, several kinds of histamine, heparin and enzymes are secreted [21]. Among the enzymes, chymase is closely related to the fibrosis of tissues. Chymase was first found in mast cells, but was also found in human heart and vein tissues later [22]. The most important function of chymase is to regulate the production of AngII. In addition, chymase promotes fibroblast proliferation in cardiac muscle and skin [23,24], facilitates the release of TGF-β1 that was bound to extracellular matrix [25], degradates collagen, and participates in inflammatory responses [26]. Mast cell chymase exists in liver phospholipids proteoglycan macromolecular complexes. Chymase in mast cells is usually very stable, but can be released upon stimulation of mast cells and hence, playing a central role in the pathophysiological status of the cardiovascular system [27] and an important role in the fibrotic development of the lungs and cardiac muscles [28].
It was reported that the proliferation ability, anti-apoptotic ability and collagen synthesis ability of keloid fibroblasts were higher than that of normal skin fibroblasts, and that 15% genes in keloid fibroblasts were upregulated [29,30]. This suggests that the abnormality of keloid fibroblasts is the main reason for keloid proliferation and that keloid fibroblasts are distinct from normal skin fibroblasts [31]. Previous studies indicated that mast cell chymase facilitated the proliferation of normal skin fibroblasts in time and dose-dependent manners but had no obvious effect on collagen synthesis [16]. Our study showed that 15 and 30 ng/mL mast cell chymase promoted keloid fibroblast proliferation, with 15 ng/mL chymase being the most significant. However, 60 and 120 ng/mL mast cell chymase showed no significant effect on the proliferation of keloid fibroblasts. Collagen synthesis in keloid fibroblasts was significantly increased compared with the control group after being treated with different concentrations of chymase for 12 hours, but was decreased after 24 hours of treatment. This result concurs with previous reports that keloid fibroblasts are distinct from normal skin fibroblasts.
TGF-β1, a molecule closely related to the deposition of extracellular matrix and fibrotic diseases, is a key factor in wound healing and keloid formation [32,33]. Our study showed that, after being treated with different concentrations of mast cell chymase, gene expression of TGF-β1 in keloid fibroblast was elevated over time, with the effect with 15 ng/mL chymase being the most significant. In addition, TGF-β1 protein expression in keloid fibroblasts treated with 60 and 120 ng/mL mast cell chymase was significantly higher than the control (P < 0.05) with the expression after 12 hour treatment being the highest. Mast cell chymase promoted the production of type I collagen but the production was reduced after being treated for a longer time. This might be caused by the degradation of extracellular matrix by chymase [34]. Thus, our study indicates that mast cell chymase promotes the production of TGF-β1 that facilitates keloid fibroblast proliferation and collagen synthesis.
In cultured fibroblasts, chymase facilitates the release of TGF-β1 from the proteins it binds to. In the skin fibroblasts, chymase significantly increases fibroblast proliferation, which can be inhibited by chymase inhibitors, but cannot be inhibited by angiotensin II receptor blockers [25]. Chymase promotes protein expression of TGF-β1 in fibroblasts, but the increased TGF-β1 can be inhibited by chymase inhibitor Suc-Val-Pro-Phep (OPH)2. In addition, anti-TGF-β1 neutralizing antibody totally inhibits proliferation induced by chymase, indicating that chymase induces cell proliferation through the activation of TGF-β1. Previous studies showed that chymase (< 60 ng/mL) promotes the expression of TGF-β1 in normal skin fibroblasts in a dose dependent manner [16].
The present study also showed that mast cell chymase significantly increased the protein expression of P-Smad2/3, Smad2/3 and Smad7, and higher doses of chymase only enhanced the protein expression of P-Smad2/3, Smad2/3 and Smad7 over a longer treatment time. The expression of Smad2/3 protein is lower than that of P-Smad2/3, but lower concentration of chymase can promote the expression of Smad2/3. The phosphorylation of Smad2/3 protein is a key step in the activation of Smad signaling pathway [5]. The amount of P-smad2/3 protein expression indicates the degrees of the activation of Smad signaling pathway. Thus, the above results demonstrated that chymase can activate Smad signaling pathway.
Smad7 is a key inhibitory protein in TGF-β1 signaling pathway. It competitively binds to the activated TGF-βR-I, inhibits the phosphorylation of R-Smad, and exerts negative regulatory effect on Smad signaling pathway. Our finding that chymase increases Smad7 protein expression, concurs with the report that TGF-β1 induces Smad7 protein expression in skin fibroblast [19]. Chymase not only activates Smad2/3, but also induces the expression increase of Smad7 to form an autocrine negative feedback loop. However, the levels of endogenous Smad7 expression induced by chymase are much lower than the levels of P-Smad2/3 and are not enough to antagonize the positive regulation mediated by Smad2/3.
Chymase upregulates gene and protein expression of TGF-β1 and promotes the phosphorylation of Smad2/3 protein. This suggests that chymase activates TGF-β1 and its intracellular signal transduction molecule Smad proteins, and that the activation of the TGF-β1/Smad signaling pathway plays an important role in keloid fibrosis induced by chymase.
In conclusion, our study demonstrated that mast cell chymase is active in keloid, and promotes fibroblast proliferation and collagen synthesis. TGF-β1/Smad signaling pathway plays an important role in the profibrotic response mediated by chymase. This will be helpful for the further research and development of keloid therapeutics.
Acknowledgements
This study was supported by the National Natural Science Foundation of China (No. 81260291) and the Youth Science Foundation of the First Affi liated Hospital of Xinjiang Medical University (No. 2012QN02).
Disclosure of conflict of interest
None.
References
- 1.Yu H, Bock O, Bayat A, Ferguson MW, Mrowietz U. Decreased expression of inhibitory SMAD6 and SMAD7 in keloid scarring. J Plast Reconstr Aesthet Surg. 2006;59:221–229. doi: 10.1016/j.bjps.2005.06.010. [DOI] [PubMed] [Google Scholar]
- 2.Bran GM, Sommer UJ, Goessler UR, Hörmann K, Riedel F, Sadick H. TGF-β1 antisense impacts the SMAD signalling system in fi broblasts from keloid scars. Anticancer Res. 2010;30:3459–3463. [PubMed] [Google Scholar]
- 3.Xu L, Zheng N, He Q, Li R, Zhang K, Liang T. Puerarin, isolated from Pueraria lobata (Willd. ), protects against hepatotoxicity via specifi cinhibition of the TGF-β1/Smad signaling pathway, thereby leading to anti-fi brotic effect. Phytomedicine. 2013;20:1172–1179. doi: 10.1016/j.phymed.2013.06.008. [DOI] [PubMed] [Google Scholar]
- 4.Shimizu J, Izumi T, Arimitsu N, Fujiwara N, Ueda Y, Wakisaka S, Yoshikawa H, Kaneko F, Suzuki T, Takai K, Suzuki N. Skewed TGFβ/Smad signalling pathway in T cells in patients with Behçet’s disease. Clin Exp Rheumatol. 2012;30:S35–39. [PubMed] [Google Scholar]
- 5.Attisano L, Wrana JL. Signal transduction by the TGF-β superfamily. Science. 2012;296:1646–1647. doi: 10.1126/science.1071809. [DOI] [PubMed] [Google Scholar]
- 6.Derynck R, Zhang Y, Feng XH. Smads: transcriptional activators of TGF-beta responses. Cell. 1998;95:737–740. doi: 10.1016/s0092-8674(00)81696-7. [DOI] [PubMed] [Google Scholar]
- 7.Tao S, Sampath K. Alternative splicing of SMADs in differentiation and tissue homeostasis. Dev Growth Differ. 2010;52:335–342. doi: 10.1111/j.1440-169X.2009.01163.x. [DOI] [PubMed] [Google Scholar]
- 8.Inman GJ. Linking Smads and transcriptional activation. Biochem J. 2005;386:e1–e3. doi: 10.1042/BJ20042133. [DOI] [PMC free article] [PubMed] [Google Scholar]
- 9.Nakao A, Afrakhte M, Morén A, Nakayama T. Identifi cation of Smad7, a TGFbeta-inducible antagonist of TGF-beta signalling. Nature. 1997;389:631–635. doi: 10.1038/39369. [DOI] [PubMed] [Google Scholar]
- 10.Lyons RM, Gentry LE, Purchio AF, Moses HL. Mechanism of activation of latent recombinant transforming growth factor beta 1 by plasmin. J Cell Biol. 1990;110:1361–1367. doi: 10.1083/jcb.110.4.1361. [DOI] [PMC free article] [PubMed] [Google Scholar]
- 11.Taipale J, Lohi J, Saarinen J, Kovanen PT, Keski-Oja J. Human mast cell chymase and leukocyte elastase release latent transforming growth factor-beta 1 from the extracellular matrix of cultured human epithelial and endothelial cells. J Biol Chem. 1995;270:4689–4696. doi: 10.1074/jbc.270.9.4689. [DOI] [PubMed] [Google Scholar]
- 12.Okamoto Y, Takai S, Miyazaki M. Effect of chymase-dependent transforming growth factor beta on peritoneal adhesion formationin a rat model. Surg Today. 2004;34:865–867. doi: 10.1007/s00595-004-2836-z. [DOI] [PubMed] [Google Scholar]
- 13.Vosse BA, Seelentag W, Bachmann A, Bosman FT, Yan P. Background staining of visualization systems in immunohistochemistry: comparison of the Avidin-Biotin Complex system and the EnVision+ system. Appl Immunohistochem Mol Morphol. 2007;15:103–107. doi: 10.1097/01.pai.0000213102.33816.13. [DOI] [PubMed] [Google Scholar]
- 14.Chen PM, Leng XG, Fan LL, Ma J, Wang YF, Chen LY. Changes of chymase, angiotensin converting enzyme and angiotensin II type 1 receptor expressions in the hamster heart during the development of heart failure. Chin Med J (Engl) 2005;118:1886–1892. [PubMed] [Google Scholar]
- 15.Choi KL, Claman HN. Mast cells, fi broblasts and fi brosis: new clues to the riddle of mast cells. Immunol Res. 1987;6:145–152. doi: 10.1007/BF02918088. [DOI] [PubMed] [Google Scholar]
- 16.Dong X, Chen J, Zhang Y, Cen Y. Mast cell chymase promotes cell proliferation and expression of certain cytokines in a dose-dependent manner. Mol Med Rep. 2012;5:1487–1490. doi: 10.3892/mmr.2012.851. [DOI] [PubMed] [Google Scholar]
- 17.Zhang Q, Oh CK, Messadi DV, Duong HS, Kelly AP, Soo C, Wang L, Le AD. Hypoxia-induced HIF-1 alpha accumulation is augmented in a co-culture of keloid fi broblasts and human mast cells: involvement of ERK1/2 and PI-3K/Akt. Exp Cell Res. 2006;312:145–155. doi: 10.1016/j.yexcr.2005.10.006. [DOI] [PubMed] [Google Scholar]
- 18.Le AD, Zhang Q, Wu Y, Messadi DV, Akhondzadeh A. Elevated vascular endothelial growth factor in keloids: relevance to tissue fi brosis. Cells Tissues Organs. 2004;176:87–94. doi: 10.1159/000075030. [DOI] [PubMed] [Google Scholar]
- 19.McNeil HP. The mast cell and inflammation. Aust N Z J Med. 1996;26:216–225. doi: 10.1111/j.1445-5994.1996.tb00887.x. [DOI] [PubMed] [Google Scholar]
- 20.Lee YS, Vijayasingam S. Mast cells and myofi broblasts in keloid: a light microscopic, immunohistochemical andultrastructural study. Ann Acad Med Singapore. 1995;24:902–905. [PubMed] [Google Scholar]
- 21.Kovanen PT. Mast cells: multipotent local effector cells in atherothrombosis. Immunol Rev. 2007;217:105–122. doi: 10.1111/j.1600-065X.2007.00515.x. [DOI] [PubMed] [Google Scholar]
- 22.Richard V, Hurel-Merle S, Scalbert E, Ferry G, Lallemand F, Bessou JP, Thuillez C. Functional evidence for a role of vascular chymase in the production of angiotensin II in isolated human arteries. Circulation. 2001;104:750–752. doi: 10.1161/hc3201.094971. [DOI] [PubMed] [Google Scholar]
- 23.Maruichi M, Takai S, Sugiyama T, Ueki M, Oku H, Sakaguchi M, Okamoto Y, Muramatsu M, Ikeda T, Miyazaki M. Role of chymase on growth of cultured canine Tenon’s capsule fi broblasts and scarring in a canine conjunctival flap model. Exp Eye Res. 2004;79:111–118. doi: 10.1016/j.exer.2004.02.009. [DOI] [PubMed] [Google Scholar]
- 24.Zhao XY, Zhao LY, Zheng QS, Su JL, Guan H, Shang FJ, Niu XL, He YP, Lu XL. Chymase induces profi brotic response via transforming growth factor-β1/Smad activation in rat cardiac fi broblasts. Mol Cell Biochem. 2008;310:159–166. doi: 10.1007/s11010-007-9676-2. [DOI] [PubMed] [Google Scholar]
- 25.Takai S, Jin D, Sakaguchi M, Katayama S, Muramatsu M, Sakaguchi M, Matsumura E, Kim S, Miyazaki M. A novel chymase inhibitor, 4-[1-([bis-(4-methyl-phenyl)-methyl] -carbamoyl)3-(2-ethoxy-benzyl)-4-oxo-azetidine-2-yloxy] -benzoic acid (BCEAB), suppressed cardiac fi brosis in cardiomyopathic hamsters. J Pharmacol Exp Ther. 2003;305:17–23. doi: 10.1124/jpet.102.045179. [DOI] [PubMed] [Google Scholar]
- 26.Doggrell SA, Wanstall JC. Vascular chymase: pathophysiological role and therapeutic potential of inhibition. Cardiovasc Res. 2004;61:653–662. doi: 10.1016/j.cardiores.2003.11.029. [DOI] [PubMed] [Google Scholar]
- 27.Li P, Chen PM, Wang SW, Chen LY. Time-dependent expression of chymase and angiotensin converting enzyme in the hamster heart under pressure overload. Hypertens Res. 2002;25:757–762. doi: 10.1291/hypres.25.757. [DOI] [PubMed] [Google Scholar]
- 28.Akgul A. Can cardiac fi brosis be prevented? Mast cell inhibition versus anti-chymase activity. Eur J Cardiothorac Surg. 2009;35:553–554. doi: 10.1016/j.ejcts.2008.11.021. [DOI] [PubMed] [Google Scholar]
- 29.Fujiwara M, Muragaki Y, Ooshima A. Keloid-derived fi broblasts show increased secretion of factors involved in collagen turnover and depend on matrix metalloproteinase for migration. Br J Dermatol. 2005;153:295–300. doi: 10.1111/j.1365-2133.2005.06698.x. [DOI] [PubMed] [Google Scholar]
- 30.Nedelec B, Shankowsky H, Scott PG, Ghahary A, Tredget EE. Myofi broblasts and apoptosis in human hypertrophic scars: The effect of interferon-alpha2b. Surgery. 2001;130:798–808. doi: 10.1067/msy.2001.116453. [DOI] [PubMed] [Google Scholar]
- 31.Dong X, Mao S, Wen H. Upregulation of proinflammatory genes in skin lesions may be the cause of keloid formation (Review) Biomed Rep. 2013;1:833–836. doi: 10.3892/br.2013.169. [DOI] [PMC free article] [PubMed] [Google Scholar]
- 32.Liang CJ, Yen YH, Hung LY, Wang SH, Pu CM. Thalidomide inhibits fi bronectin production in TGF-β1-treated normal and keloid fi broblastsvia inhibition of the p38/Smad3 pathway. Biochem Pharmacol. 2013;85:1594–1602. doi: 10.1016/j.bcp.2013.02.038. [DOI] [PubMed] [Google Scholar]
- 33.Park SY, Park JY, Kim CH, Kang SU, Kim JH, Bark KM, Kim TH, Shin SC, Kang HY. Effects of Xanthium stramarium and Psoralea corylifolia Extracts Combined with UVA1 Irradiation on the Cell Proliferation and TGF-β1 Expression of Keloid Fibroblasts. Ann Dermatol. 2013;25:304–309. doi: 10.5021/ad.2013.25.3.304. [DOI] [PMC free article] [PubMed] [Google Scholar]
- 34.Caughey GH, Raymond WW, Wolters PJ. Angiotensin II generation by mast cell alpha- and beta-chymases. Biochim Biophys Acta. 2000;1480:245–257. doi: 10.1016/s0167-4838(00)00076-5. [DOI] [PubMed] [Google Scholar]