

Summary
Germ cell tumors (GCTs) are cancers of the testis, ovary or extragonadal sites that occur in infants, children and adults. Testicular GCT is the most common cancer in young men aged 15–40. Abnormalities in developmental signaling pathways such as wnt/β-catenin, TGF-β/BMP and Hedgehog have been described in many childhood tumors. To date, however, the status of BMP signaling in germ cell tumors has not been described. Here, we examine BMP-SMAD signaling in a set of clinically-annotated pediatric germ cell tumors. We find that BMP signaling activity is absent in undifferentiated tumors such as seminomas and dysgerminomas, but robustly present in most yolk sac tumors, a differentiated tumor type. Gene expression profiling of TGF-β/BMP pathway genes in germinomas and yolk sac tumors reveals a set of genes that distinguish the two tumor types. There is significant intertumoral heterogeneity between tumors of the same histologic subclass, implying that the BMP pathway can be differentially regulated in individual tumors. Finally, through miRNA expression profiling, we identify differential regulation of a set of miRNAs predicted to target the TGF-β/BMP pathway at multiple sites. Taken together, these results suggest that the BMP signaling pathway may represent a new therapeutic target for childhood germ cell tumors.
Introduction
Germ cell tumors (GCTs) are cancers occurring in the testis, ovary or extragonadal sites in infants, children and adults. Although overall rare, germ cell tumors account for 15% of malignancies diagnosed during childhood and adolescence, and testicular GCT is the most common cancer in young men aged 15–40 (Oosterhuis & Looijenga, 2005). The incidence of GCT in adolescents and young adults is rapidly increasing for unclear reasons (Frazier & Amatruda, 2009). While cisplatin-based combination chemotherapy has been very successful in the treatment of GCTs (Einhorn & Donohue, 1977; Williams, et al., 1987), survival is still suboptimal for patients in high-risk groups and those whose tumors are not susceptible to cisplatin (Frazier & Amatruda, 2009). Furthermore, significant therapy-related toxicity occurs in many patients treated with cisplatin, etoposide and bleomycin, including pulmonary fibrosis (Osanto, et al., 1992), renal insufficiency (Bokemeyer, et al., 1996; Bosl, et al., 1986; Hansen, et al., 1988) and ototoxicity (Bokemeyer, et al., 1996; Strumberg, et al., 2002). Children are particularly vulnerable to late effects of therapy, especially ototoxicity and pulmonary abnormalities (Hale, et al., 1999). Better understanding of the biology of childhood GCTs potentially offers a route to improved or alternative therapy (Coffey, et al., 2005; Frazier & Amatruda, 2009; Kuczyk, et al., 2004; Oosterhuis & Looijenga, 2005).
The cell of origin of GCTs appears to be the early germline progenitor known as Primordial Germ Cells (PGCs). While both childhood and adolescent/adult GCTs originate from PGCs, important differences exist (Oosterhuis & Looijenga, 2005). Type I GCTs occur in infants and children and consist of benign teratomas and malignant yolk sac tumors (YSTs). In contrast, Type II tumors in adolescents and adults have more diverse histology, and include germinomas (seminomas in males, dysgerminomas in females; hereafter all referred to as germinomas or GER), embryonal carcinoma, teratoma, yolk sac tumor and choriocarcinoma. Little is known about the genetic changes in PGCs that underlie germ cell tumorigenesis. Two recent Genome-Wide Association Studies implicated KITLG (the kit ligand), DMRT1 and SPRY4 in familial testicular cancer (Kanetsky, et al., 2009; Rapley, et al., 2009; Turnbull, et al., 2010). Mutations in the kit tyrosine kinase have been described in GCTs (Coffey, et al., 2008; Goddard, et al., 2007; Kemmer, et al., 2004). However, a Phase II trial of imatinib in chemoresistant testicular GCTs that expressed kit did not produce any remissions (Einhorn, et al., 2006).
Germ cell tumors can be classed with embryonal tumors such as Wilms Tumor, hepatoblastoma and medulloblastoma, in which misregulation of embryonic signaling pathways appears to play an important role in tumorigenesis (Abbott, et al., 2007; Baryawno, et al., 2010). Previous results have established a role for the Notch and Hedgehog pathways in germ cell development and spermatogenesis (Morichika, et al., 2010; Szczepny, et al., 2006; Szczepny, et al., 2009). Fritsch and co-workers demonstrated that the wnt/β-catenin pathway is differentially activated in subsets of childhood germ cell tumors (Fritsch, et al., 2006), and recent results indicate that the APC tumor suppressor, a key regulator of wnt signaling, may be inactivated by methylation or loss-of heterozygosity in yolk sac tumors (Okpanyi, et al., 2010). The importance of the TGF-β/BMP (Transforming Growth Factor β /Bone Morphogenetic Protein) pathway in germline development and gonadogenesis has been demonstrated in organisms from Drosophila to humans (Hime, et al., 2007; Itman, et al., 2006; Loveland & Hime, 2005). Multiple components of the TGF-β superfamily are expressed in developing germ cells and somatic cells of the gonad (Itman, et al., 2006). In this pathway, ligands such as activin, TGF-β and BMPs bind to cell-surface receptors that are heterotetramers of Type I and Type II receptors. Activation and phosphorylation of the Type I receptor leads to the recruitment and phosphorylation of receptor-SMADS (SMAD 2/3 in TGF-β signal transduction; SMAD1/5/8 in BMP signal transduction), which in turn bind co-SMAD4; the phosphoSMAD/co-SMAD complex enters the nucleus to regulate target gene expression (Gouedard, et al., 2000; Liu, et al., 1996; Shi & Massague, 2003). TGF-β/BMP signaling can be negatively modulated by secreted extracellular factors (NOG, CHRD, FST), membrane-bound proteins (BAMBI), and intracellular proteins (SMAD6 and SMAD 7) (Mehra & Wrana, 2002).
The TGF-β family member, Activin A, is expressed during mouse germline development after sex determination, a time of widespread phospho-SMAD2/3 expression in the developing testis, and influences both the proliferation of Sertoli cells and the differentiation of germ cells (Itman, et al., 2009; Mendis, et al., 2010; Mithraprabhu, et al., 2010). BMP signaling is required for proper germline development and regulation of proliferation and differentiation of germ cells during spermatogenesis. The initial specification of primordial germ cells requires BMP signaling (Saitou, et al., 2002; Surani, et al., 2004). BMPs and the related family member, GDNF, have been implicated in spermatogonial stem cell self-renewal (Meng, et al., 2000; Puglisi, et al., 2004). In mouse models, BMP8b was shown to be necessary for PGC specification and for germ cell proliferation and differentiation during spermatogenesis (Ying, et al., 2000; Zhao, et al., 1996) Both BMP7 and BMP8a also play a role in maintenance of spermatogenesis (Zhao, et al., 2001; Zhao, et al., 1998). These studies have established the TGF-β and BMP signaling pathways as important components in germline specification and the initiation and maintenance of spermatogenesis.
The TGF-β pathway has been investigated in human germ cell tumors. The ligands TGF-β1, TGF-β2 and TGF-β3, as well as Inhibin and Activin, have been shown to be expressed in malignant germ cell tumors (Cardillo, et al., 1998; Cobellis, et al., 2001). Specific snp variants in the TGFB1 gene are associated with elevated risk of developing testicular germ cell tumor (Purdue, et al., 2007). Dias and co-workers examined Activin/TGF-β signaling modulators including phosphorylated SMAD 2 and 3 (pSMAD2/3), SMAD6, Inhibin A, MAN-1 and beta-glycan in adult testicular germ cell tumors. They found uniform expression of pSMAD2/3 in seminomas and in non-seminomas, indicating that the Activin/TGF-β pathway is active in these tumors. Interestingly, expression of beta-glycan, INHA and MAN-1 differed between different seminomas, suggesting possible intertumoral heterogeneity in the regulation of Activin/TGF-β signaling (Dias, et al., 2009). Bouras and co-workers described a mutation in SMAD4 in 2 of 20 seminomas (Bouras, et al., 2000), a finding with potential implications for both Activin/TGF-β and BMP signaling pathways. To date, however, the status of BMP signaling in germ cell tumors has not been described. Here, we examine BMP-SMAD signaling in a set of clinically-annotated pediatric germ cell tumors. We find that BMP signaling activity is absent in undifferentiated tumors such as seminomas and dysgerminomas, but robustly present in most yolk sac tumors, a differentiated tumor type. Gene expression profiling of TGF-β/BMP pathway genes in germinomas and yolk sac tumors reveals a set of genes that distinguish the two tumor types. There is significant intertumoral heterogeneity between tumors of the same histologic subclass, implying that the BMP pathway can be differentially regulated in individual tumors. Finally, through miRNA expression profiling, we identify differential regulation of a set of miRNAs predicted to target the TGF-β/BMP pathway at multiple sites.
Materials and Methods
Tumor samples
Fresh frozen tumor specimens and accompanying formalin-fixed, paraffin-embedded blocks were acquired from Children’s Medical Center of Dallas (CMC). Informed, written consent was obtained from the patients’ parents prior to the study and assent was obtained from patients greater than 10 years of age. All studies were performed with the approval of The University of Texas Southwestern Medical Center and CMC Institutional Review Boards. Diagnosis was verified by a pediatric pathologist and only samples with >70% tumor cellularity of pure histological subtypes were included. Clinical demographic data are shown in Table 1. For gene expression analysis, we analyzed 7 yolk sac tumors (designated YST1 through YST7) and 4 germinomatous tumors (designated GER1 through GER4). Clinical demographic data for these tumors are shown in Table 2. Here, we use the term “germinoma” generically to include dysgerminomas, seminomas, and central nervous system germinomas. Specimens from patients YST1, YST3, YST4, GER1, GER2, and GER3 were included in the custom tissue microarray analysis.
Table 1.
Patient demographics and results for immunohistochemistry studies.
| Tumor Characteristics | pSMAD3 | pSMAD1/5/8 | ||||||
|---|---|---|---|---|---|---|---|---|
| Histology | Site | Age (y) | Sex | Clinical Stage at Initial Presentation | Location | Score | Location | Score |
| Yolk Sac Tumor | Testis | 2.1 | M | I | N | 2+ | C, M | 1+ |
| Yolk Sac Tumora | Testis | 3 | M | I | N | 2+ | N, C | 2+ |
| Yolk Sac Tumor | Testis | 1.3 | M | (R), I | N | 2+ | 0+ | |
| Yolk Sac Tumor | Testis | 2.1 | M | I | N | 2+ | N, C | 2+ |
| Yolk Sac Tumor | Ovary | 11 | F | (R) II | N, C | 3+ | N, C, M | 2+ |
| Yolk Sac Tumor | Ovary | 13 | F | I | N | 3+ | N, C | 2+ |
| Yolk Sac Tumor | Testis | 1.3 | M | I | N | 2+ | N | 3+ |
| Yolk Sac Tumor | Testis | 2.3 | M | I | N | 3+ | N | 1+ |
| Yolk Sac Tumor | Ovary | 11 | F | I | N | 3+ | N | 3+ |
| Yolk Sac Tumor | Ovary | 11 | F | III | N | 3+ | N | 2+ |
| Yolk Sac Tumor | Testis | 1.3 | M | III | N | 2+ | C | 1+ |
| Yolk Sac Tumorb | Liver | 1.4 | M | I, (E) | N | 2+ | 0+ | |
| Yolk Sac Tumorc | Testis | 0.3 | M | I | N | 2+ | N | 3+ |
| Yolk Sac Tumor | Sacrum | 4 | M | (R), stage unknown | N | 3+ | N, C | 2+ |
| Dysgerminomad | Ovary | 11 | F | I | N, C | 3+ | C | 1+ |
| Dysgerminoma | Gonad# | 8 | F | I | N | 3+ | 0+ | |
| Dysgerminoma | Ovary | 7 | F | IV | N | 2+ | C | 1+ |
| Dysgerminomae | Ovary | 10 | F | III | N, C | 3+ | 0+ | |
| Dysgerminoma | Ovary | 14 | F | III | N, C | 3+ | 0+ | |
| Dysgerminoma | Ovary | 13 | F | I | N | 2+ | N, C | 2+ |
| Seminoma | Testis | 14 | M | III | N, M | 3+ | 0+ | |
| Germinoma | Pineal Body | 12 | M | Intracranial | NE | NE | 0+ | |
| Germinoma | Mediastinum | 13 | M | II, (E) | N | 2+ | N, C | 1+ |
| Dysgerminomaf | Ovary | 17 | F | III | N | 2+ | 0+ | |
All patients were from Children’s Medical Center of Dallas and diagnosis was verified by a pediatric pathologist. Only samples with >80% tumor cellularity of pure histological subtypes were included. a–f correspond to frozen tissue specimens used in gene expression arrays.
YST4,
YST1,
YST3,
GER2,
GER1,
GER3.
x,y reversal incidentally discovered. R: Recurrent, E: Extragonadal. For tumors defined as recurrent, the tissue was obtained from the recurrence and stage at original presentation is given. NE: Not evaluated. IHC was done for phospho-SMAD1/5/8 and phospho-SMAD3 (shown in Figure 1) and scored based on intensity and frequency from 0+ to 3+, where 0+ indicates absence of staining and 3+ indicates very prominent staining. In addition, cellular localization of staining is reported-N: nuclear, C: Cytoplasmic, M: Membranous.
Table 2.
Patient demographics for gene expression studies.
| Tumor | Site | Age (y) | Sex | Clinical Stage |
|---|---|---|---|---|
| YST1*# | Liver | 1.4 | M | I, (E) |
| YST2 | Peri-rectal | 16 | F | I, (R) |
| YST3*# | Testis | 0.3 | M | I |
| YST4*# | Testis | 3 | M | I |
| YST5 | Testis | 0.9 | M | I |
| YST6# | Testis | 0.5 | M | I |
| YST7 | Ovary | 16 | F | IV |
| GER1*# | Ovary | 10 | F | III |
| GER2*# | Ovary | 11 | F | I |
| GER3*# | Ovary | 17 | F | III |
| GER4 | CNS | 10 | F | Intracranial |
Fresh frozen tumor specimens were acquired from Children’s Medical Center of Dallas. For gene expression analysis, we performed real-time quantitative PCR on 84 genes involved TGF-β/BMP signaling. Samples included 7 yolk sac tumors (designated YST1 through YST7) and 4 germinomatous tumors (designated GER1 through GER4). R: Recurrent, E: Extragonadal. For tumors defined as recurrent, the tissue was obtained from the recurrence and stage at original presentation is given.
Included in tissue microarray for immunohistochemistry studies.
Used for micro-RNA profiling studies.
Custom tissue microarray preparation
Tissue blocks were obtained from Children’s Medical Center of Dallas. Tissue microarray (TMA) consisted of paraffin-embedded tissue from 14 yolk sac tumors, 10 germinomatous tumors, 3 normal testis, and 3 normal ovaries. Frozen tissue specimens YST1, YST3, YST4, GER1, GER2, and GER3 used in quantitative qPCR arrays were included in the custom tissue microarray analysis. The TMA was constructed using Tissue-Tek Quick-Ray tissue microarray instrument (Sakura Finetek, Torrance, CA). All hematoxylin-eosin stained sections of each case were reviewed and representative sections were selected. 2 mm cores from the corresponding formalin-fixed/paraffin-embedded (FFPE) tissue blocks were punched out and pushed into the recipient TMA block. Two representative cores from each tumor were included in the TMA. In addition, one core each of 3 FFPE normal testicular tissues and 3 FFPE normal ovarian tissues were included in the TMA. A map was maintained to record the order of the cases in the TMA. Once complete, the recipient TMA block was placed face-down in a basemold and baked for 40 minutes at 66°C, and then paraffin-embedded at the embedding center (Thermo Electron Corporation, Waltham, MA). Once solidified, 4 micron sections of the TMA block were cut for staining. Median age of patients included was 8 years (range 3 months to 17 years). Sex distribution showed 13 males and 11 females. Anatomic location showed 9 tumors of testicular origin, 10 ovarian, 1 indeterminate gonadal, 1 sacrococcygeal, 1 CNS, 1 mediastinal and 1 hepatic. Among gonadal tumors, staging at initial diagnosis showed 11 stage I, 6 stage III, 1 stage IV tumor, and 2 specimens represented recurrences.
Preparation of total RNA
Total RNA was prepared from fresh frozen tumor tissue and cell lines. 30–50 mg of tissue was homogenized using Tissue Miser (Fisher Scientific, Pittsburgh, PA) in TRIzol® Reagent (Invitrogen, Carlsbad, CA); approximately 1 mL TRIzol® per 50 mg of tissue was used. After incubation for 30 minutes at room temperature, phase separation was done using chloroform (200 μL/1 mL Trizol®). Sample was shaken vigorously, centrifuged at 13000 rpm at 4°C, and aqueous phase removed. RNA precipitation was done using 70% ethanol. To prepare total RNA for miRNA analysis, after initial homogenization, sample was incubated for 5 minutes at room temperature, followed by the same chloroform separation, and centrifuged at 15000 rpm for 15 minutes at 4°C. 1.5 volumes of 100% ethanol were then added prior to on-column preparation. To remove contaminant genomic DNA, on-column DNase digestion was done using RNase-Free DNase Digestion Kit (Qiagen, Valencia, CA). RNA isolation was done per manufacturer’s instructions using RNeasy® Mini Kit (Qiagen, Valencia, CA) and final elution performed in 15–20 μL H2O. Quantity and purity was assessed using NanoDrop™ 1000 spectrophotometer (Thermo Fisher Scientific, Wilmington, DE). Absorbance ratios at 260/280 nm and 260/230 nm were used to verify purity. Quality was further assessed by visualization of 28S and 18S bands after performing gel electrophoresis (1% Tris-Acetate Buffer and 1mM EDTA).
Quantitative RT-PCR
Total RNA was prepared as above from frozen tumor specimens. cDNAs were synthesized from 1 μg of RNA using RT2 First Strand Kit (SABiosciences, Frederick, MD). Real-time quantitative PCR gene expression profiling was done using BMP/TGF-β pathway specific arrays (SABiosciences, Frederick, MD). Arrays profiled 84 pathway-specific genes with validated primers and contained internal control primers to assess genomic DNA contamination, RNA quality, and PCR amplification efficacy. RT-qPCR was performed on Applied Biosystems 7500 Real-Time PCR System (Carlsbad, CA) using RT2 SYBR® Green qPCR Master Mix (SABiosciences, Frederick, MD) as a fluorophore for amplicon detection. PCR conditions were as follows: 95°C x 10 minutes, 95°C for 15 seconds then 60°C for 1 minute x 40 cycles, followed by a dissociation stage per manufacturer’s protocol. Gene expression was normalized to endogenous β-actin (ACTB) and glyceraldehyde-3-phosphate dehydrogenase (GAPDH), as these internal reference genes exhibited the least variation among the five internal reference genes evaluated. Even when other potential combintations of reference genes were evaluated, variations in gene-of-interest expression were minimal. Fold regulation of gene expression was determined using the 2(−ΔΔCt) method, and compared yolk sac tumors (n=7) to germinomas (n=4). We performed unsupervised hierarchical cluster analysis on 7 yolk sac tumors and 4 germinomas using web-based PCR data analysis software (www.sabiosciences.com/pcrarraydataanalysis.php). Raw gene expression data and calculations are shown in Supplementary Tables 1–5. Differentially expressed genes were those for which the log2-transformed fold regulation was >2 or <−2. Quantitative PCR for SMAD6 and SMAD7 (not included in arrays) was performed in quadruplicate using validated primers (SABiosciences, Frederick, MD). SMAD6 Primer sequence corresponds to RefSeq Accession NM_005585.3 and SMAD7 primer sequence corresponds to RefSeq NM_005904.2. Gene expression was determined as described above. Gene expression among histologic subtypes was compared using a type 3 t-test (Supplementary Table 6).
Immunohistochemistry
Anti-phospho-SMAD3 (Ser423/425) antibody (rabbit polyclonal, ab51451) was purchased from Abcam (Cambridge, MA) and used at a dilution of 1:150. The manufacturer reports specificity for the phosphorylated form of the protein although minimal reactivity with nonphosphorylated human Smad3 can be observed by ELISA and WB. ab51451 also exhibits some reactivity with phosphorylated Smad1 and Smad5 on Western blot but negligible reactivity is seen against other phosphorylated Smad family members. Anti-phospho-SMAD1/5/8 (Ser463/465, Ser463/465, Ser426/428, respectively) antibody (rabbit polyclonal, #9511) was purchased from Cell Signaling (Beverly, MA) and used at a dilution of 1:100. The antibody is reported by the manufacturer to detect endogenous Smad1 only when dually phosphorylated at Ser463 and Ser465, as well as Smad5 and Smad8 only when phosphorylated at the equivalent sites. The manufacturer reports this antibody does not exhibit cross-reactivity with other Smad-related proteins. Immunoblotting against lysates prepared from primary tumor tissue revealed the expected single band at approximately 58 kDa for both anti-Smad antibodies (Supplementary Figure 1). Rabbit polyclonal anti-human Noggin antibody ab16054 was from Abcam. Immunohistochemistry was performed on a Ventana Discovery automated immunostainer (Ventana, Tucson, AZ) using standard immunoperoxidase techniques and hematoxylin counterstaining. The same lot of antibody was used for all immunohistochemistry and immunoblotting experiments. The immunohistochemical staining was scored by both the intensity of staining (0 – no staining, 1 – mild staining, 2 – moderate staining, 3 – strong staining) and the percentage of positively staining cells (0 – no staining, 1 – <10% cells staining, 2 – 10–50% cells staining, 3 – >50% cells staining). For each tumor, the intensity score and the percentage positivity score were an average of the scores for each of two cores in the TMA. A combined immunohistochemical score was calculated as the product of the average intensity score and the average percentage positivity score. Based on the combined score, results are reported as 0 (combined score <1); 1+ (score 1–2.99); 2+ (score 3–6.99); or 3+ (score 7–9). Sections were scored by two of the authors independently. The kappa statistic for interobserver variation with nominal data(Cohen, 1960)was calculated according to http://department.obg.cuhk.edu.hk/ResearchSupport/Cohen_Kappa_data.asp and was 0.84 for pSMAD1/5/8 and 0.85 for pSMAD3.
Immunoblotting
Approximately 30 mg fresh frozen tumor tissue was ground with mortar and pestle in 300 μL ice-cold radio-immunoprecipitation assay (RIPA) buffer containing Complete, Mini Protease Inhibitor Cocktail Tablet (Roche diagnostics, Indianapolis, IN) and 10mM.10 mM sodium orthovanadate (FIVEPhoton Biochemicals, San Diego, CA). Lysate was incubated on ice for 10 minutes, frozen in liquid nitrogen, thawed on ice, and further lysed using Sonicator Ultrasonic Processor XL (Heat Systems Inc., Farmingdale, CT). The lysate was centrifuged at 13000 rpm for 12 minutes at 4°C. Supernatant was isolated, aliquotted, and stored at −80°C. Protein concentrations were determined using the Bradford method (Bio-Rad, Hercules, CA). Samples were separated on SDS-PAGE, transferred to nitrocellulose membrane (Bio-Rad, Hercules, CA) and blocked in 1% casein in phosphate buffered saline. Mouse monoclonal anti-β-actin (Sigma-Aldrich, St. Louis, MO) was used as a loading control (concentration 1:1000). All primary antibodies were diluted in 1% casein in PBS with 0.1% Tween 20 (Fisher Scientific, Fair Lawn, NJ). A protein standard ladder (Precision Plus Protein Standard, Bio-Rad, Hercules, CA) was used to ensure appropriate identification of intended bands. Goat-anti-mouse and goat-anti-rabbit horse-radish peroxidase secondary antibodies were purchased from Jackson Immunoresearch (West Grove, PA). We performed band detection using Amersham ECL plus detection reagents (GE Healthcare, Piscataway, NJ).
MicroRNA analysis
Total RNA enriched for miRNA was prepared as described above from four yolk sac tumors (YST1, YST3, YST4, YST6) and 3 dysgerminomas (GER1, GER2, GER3). Clinical demographic data is shown in Table 2. Processing, hybridization using 3Paraflo© microfluidic chip technology (based on Sanger miRBase release 14.0), and labeling of miRNA with Cy3 or Cy5 was performed by LC Sciences, Inc. (Houston, TX). Log2 ratios were determined (Supplemental Table 7) and miRNAs differentially expressed in YSTs relative to GERs were determined by a paired t-test (p<0.05, minimum signal threshold >500) and shown in Table 4. A positive log2 ratio indicates higher expression in YSTs, and a negative log2 ratio indicates higher expression in GER. Differentially expressed miRNAs (p<0.05) were arranged using unsupervised cluster analysis as shown in Figure 5.
Table 4.
Micro-RNAs differentially expressed in yolk sac tumors and dysgerminomas.
| microRNA | Log2 fold change | p-value |
|---|---|---|
| miR-375 | 7.66 | 0.0002 |
| miR-200b | 5.94 | 0.001 |
| miR-302c* | 4.84 | 0.004 |
| miR-194 | 2.71 | 0.006 |
| miR-126 | 2.13 | 0.007 |
| miR-122 | 9.81 | 0.008 |
| miR-487b | 2.67 | 0.008 |
| miR-454 | 2.16 | 0.009 |
| miR-494 | 2.77 | 0.011 |
| miR-192 | 2.01 | 0.014 |
| miR-27b | 1.55 | 0.022 |
| miR-130b | 2.65 | 0.030 |
| miR-302a | 5.17 | 0.032 |
| miR-302c | 2.89 | 0.034 |
| miR-432 | 3.14 | 0.035 |
| miR-99b | 0.95 | 0.035 |
| miR-638 | 0.93 | 0.036 |
| miR-302a* | 4.09 | 0.043 |
| miR-382 | 1.87 | 0.046 |
| miR-200c | 3.9 | 0.047 |
| miR-1305 | −2.16 | 0.046 |
| miR-1280 | −0.89 | 0.045 |
| miR-222 | −1.61 | 0.042 |
| miR-105 | −2.97 | 0.036 |
| miR-155 | −4.21 | 0.036 |
| miR-320a | −1.07 | 0.035 |
| miR-184 | −2.93 | 0.033 |
| miR-195 | −1.78 | 0.026 |
| miR-221 | −1.63 | 0.018 |
| miR-182 | −3.03 | 0.015 |
| miR-146b-5p | −4.26 | 0.014 |
| miR-320d | −2.19 | 0.014 |
| miR-320c | −1.87 | 0.006 |
| miR-320b | −2.1 | 0.006 |
We determined the miRNA profiles of 4 yolk sac tumors (YST1, YST3, YST4, YST6) and 3 dysgerminomas (GER1, GER2, GER3). Log2 ratios were determined and miRNAs differentially expressed in YSTs relative to GERs were determined by a paired t-test (p<0.05, minimum signal threshold >500). A positive log2 ratio indicates higher expression in YSTs, and a negative log2 ratio indicates higher expression in GER.
Figure 5. Micro-RNAs differentially expressed in yolk sac tumors and dysgerminomas.
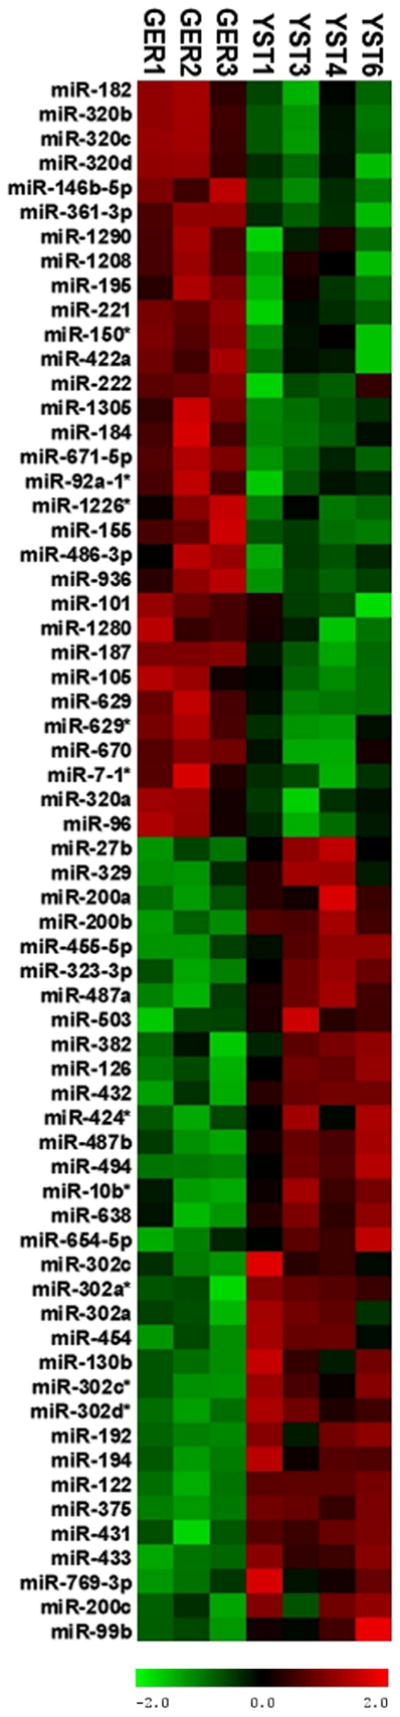
We profiled 782 miRNAs and differential expression was determined between yolk sac tumors (n=4) and dysgerminomas (n=3). Supervised clustering of tumors is shown here, with red indicating high levels of expression and green indicating low levels of expression.
We used DIANA-microT-4.0 (http://diana.cslab.ece.ntua.gr/pathways/), a web-based miRNA target prediction software (Maragkakis, et al., 2009a; Papadopoulos, et al., 2009), to determine potential interactions among differentially expressed miRNAs with pathways relevant to cancer biology. We simultaneously evaluated all miRNAs upregulated in YSTs (shown in Table 4) with the exception of miR-302a* and miR302c* which were not included in the algorithm. We performed the same analysis on all miRNAs upregulated in GERs (shown in Table 4). We chose to perform enrichment analysis of all co-expressed miRNAs simultaneously in order to determine the combinatorial effect in pathway modulation. Predicted targets of canonical BMP signaling are shown in Figure 6.
Figure 6. Higher levels of miR-200 expression correlate with lower Noggin protein expression in GCTs.

A, Noggin mRNA, Noggin protein and miR-200b expression in YSTs. 2−ΔCt of Noggin mRNA expression (blue bars); miR-200b signal from microRNA microarray (red bars); and corresponding tumor immunohistochemistry for Noggin protein. B, Noggin mRNA, Noggin protein and miR-200c expression in GERs. 2−ΔCt of Noggin mRNA expression (blue bars); miR-200c signal from microRNA microarray (green bars); and corresponding tumor immunohistochemistry for Noggin protein. C, miRNAs highly expressed in YSTs are shown in white boxes and predicted to target NOG, a BMP inhibitor. miRNAs upregulated in GERs (grey boxes) target multiple BMP pathway components. BMP: bone morphogenetic protein, GDF6: growth differentiation factor 6, BMPR2: BMP receptor 2, BMPR1B: BMP receptor 1B; NOG: Noggin.
Results
TGF-β signaling
To assess the state of TGF-β/BMP pathway signaling in childhood germ cell tumors, we created a custom tissue microarray containing 14 pediatric yolk sac tumors and 10 germinomas (seminomas or dysgerminomas). We chose to study these tumor classes because they represent by far the most common types of malignant germ cell tumors in patients less than 18 years of age (Frazier & Amatruda, 2009). We performed immunohistochemistry for phosphorylated SMAD3 (pSMAD3) as a readout of TGF-β signaling activity, and for phosphorylated SMAD1/5/8 (pSMAD1/5/8) as a readout of BMP signaling activity (Figure 1). All pediatric yolk sac tumors (14 of 14) and germinomatous tumors (9 of 9) showed prominent staining for pSMAD3. Staining was localized in the nucleus, though some tumors showed cytoplasmic and membranous pSMAD3 as well. In contrast, BMP signaling was differentially regulated between the two tumor types. The majority of pediatric yolk sac tumors (9 of 14) showed high levels of pSMAD1/5/8 (2+ or greater), whereas only 1 of 10 germinomas showed high levels of phospho-SMAD1/5/8 (Figure 1). In yolk sac tumors, staining was primarily localized to the nucleus and, to a lesser extent, the cytoplasm. Table 1 summarizes clinical information and results of immunohistochemical studies for each of the tumors. Differences in the degree of active BMP signaling did not clearly correlate with differences in clinical stage or site of presentation (Table 1).
Figure 1. Immunohistochemical detection of TGF-β and BMP pathway signaling in pediatric germ cell tumors.

Representative images from a tissue microarray containing 14 yolk sac tumors (A–F) and 10 germinomatous tumors (seminomas, dysgerminomas or CNS germinomas) (G–L). C, D, I, J: Phosphorylated-SMAD3 immunohistochemistry as a readout of TGF-β signaling activity. E, F, K, L: Phosphorylated-SMAD1/5/8 immunohistochemistry as a readout of BMP signaling activity. Scoring results for individual tumors are summarized in Table 1. Scale bar: 100 microns.
Expression profiling of TGF-β/BMP pathway genes
To further delineate the state of the TGF-β/BMP pathway in germ cell tumors, we performed quantitative RT-PCR to evaluate the relative expression of 84 genes involved in TGF-β/BMP signaling in seven yolk sac tumors and four germinomatous tumors. Clinical characteristics of these tumors (some of which were also represented on the tissue microarray) are shown in Table 2. The analyzed genes included TGF-β /BMP ligands, receptors, intracellular SMADs, target genes and pathway modulators. 34 genes were differentially expressed between yolk sac tumors and germinomas (Figure 2). In agreement with the immunohistochemistry results (Figure 1), TGF-β/BMP pathway genes were more likely to show higher transcript levels in yolk sac tumors; of the differentially regulated genes, 29 genes were higher in yolk sac tumors and 5 genes were higher in germinomas. Genes differentially expressed are listed and classified based on their function in Table 3. Unsupervised clustering of the differentially regulated genes grouped tumors by histologic subtype (Figure 2). Among the gene transcripts expressed at higher levels in YSTs, despite the active BMP signaling in these tumors, were negative regulators of the pathway, including NOG and FST. This expression likely represents a feedback response, as many negative regulators of TGF-β/BMP signaling are also direct transcriptional targets of the pathway (Bartholin, et al., 2002; Sela-Donenfeld & Kalcheim, 2002).
Figure 2. Clustergram analysis of TGF-β/BMP pathway gene expression.
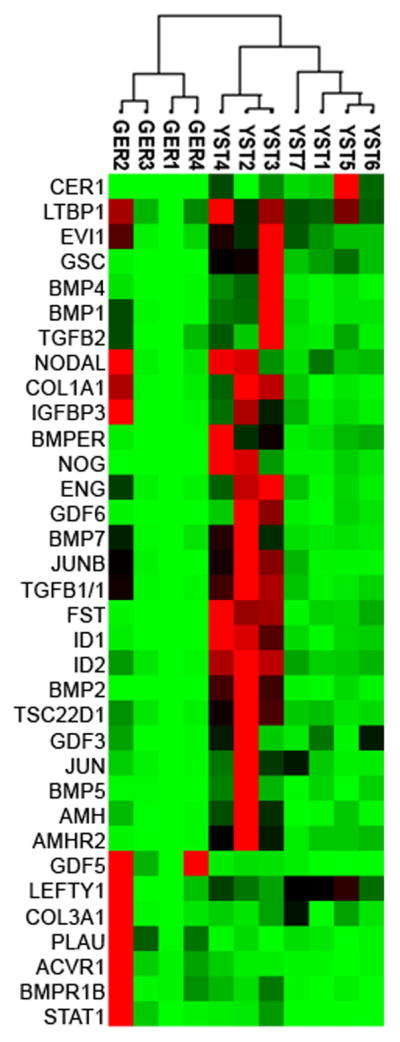
Yolk sac tumors (n=7) and germinomas (n=4) were profiled using Real-time quantitative PCR of 84 BMP/TGF-β pathway genes. Expression was normalized to endogenous β-actin and glyceraldehyde-3-phosphate dehydrogenase (GAPDH) expression. Unsupervised clustering of tumors is shown, with red indicating high levels of expression and green indicating low levels of expression.
Table 3.
Genes differentially expressed in yolk sac tumors and germinomas.
| Genes with higher expression in Yolk Sac Tumors | |
| Ligand | NODAL, AMH, TGFB2, LEFTY1, BMP7, BMP4, GDF3, GDF6, BMP5, BMP2 |
| Extracellular matrix | COL3A1, COL1A1 |
| Regulator | LTBP1, BMP1, NOG, FST, CER1 |
| Transcriptional Target (BMP) | ID1, ID2, JUNB |
| Transcriptional Target (TGF-β) | IGFBP3, JUNB, TSC22D1, COL3A1, COL1A1, JUN, GSC |
| Transcription factor/regulator | EVI1, TGFB1/1 |
| Receptor | AMHR2, BMPER, ENG |
| Genes with higher expression in Germinomas | |
| Ligand | GDF5 |
| Extracellular regulator | PLAU |
| Receptor | BMPR1B, ACVR1 |
| Transcription factor/regulator | STAT1 |
34 genes are differentially expressed, consisting of ligands, extracellular modulators, transcriptional targets/regulators, and receptors associated with TGF-β/BMP signaling.
We also noted heterogeneity in the gene expression profile within histologic subtypes. For example, three yolk sac tumors (YST2, YST3, YST4) appear to form a subclass with relatively greater expression of TGF-β/BMP pathway genes (Figure 2). YST3 and YST4, which were included in the immunohistochemical analysis, exhibited a robust phospho-SMAD1/5/8 signal, indicating the presence of active BMP signaling in these tumors (Table 1). In contrast, YST1, which showed relatively lower TGF-β/BMP gene expression, showed no phospho-SMAD1/5/8 staining by IHC (Table 1). In general, germinomas exhibited lower TGF-β/BMP gene expression relative to YSTs, with the exception of GER2, which showed higher expression of a subset of genes: COL1A2, COL1A1, BAMBI, COL3A1, LEFTY1, IGFBP3, NODAL, and BMPR2 (Figure 3). GER2, a stage I germinoma, did not exhibit pSMAD1/5/8 staining, indicating that greater expression of a subset of genes was not sufficient to activate BMP signaling. These intraclass differences in BMP signaling activity and gene expression do not obviously correlate with any clinical parameters such as sex, age, anatomic location, or clinical stage. However, the small number of tumors analyzed might prevent detection of such an association.
Figure 3. Individual germinomas display heterogeneous gene expression profiles.

Tumor G2, a stage I dysgerminoma, showed elevated expression of a subset of genes: BAMBI, COL1A, COL3A1, STAT1, IGF1, SMAD3, SERPINE1, CDC25A, RUNX1.
Differential regulation of inhibitory SMADS
The results of immunohistochemistry and transcriptional profiling experiments suggested that the TGF-β/BMP pathway is differentially regulated in yolk sac tumors and germinomas. However, owing to heterogeneity within a given class, it was not possible to identify specific genes that discriminated the two tumor types. We hypothesized that the high degree of active BMP signaling present in yolk sac tumors might result in a feedback inhibition response. Therefore we assessed the relative expression in the tumors of two inhibitory SMADs: SMAD6, which inhibits BMP signaling (Wang, et al., 2007) and SMAD7, which inhibits both the TGF-β and BMP arms of the pathway (Casellas & Brivanlou, 1998; Nakao, et al., 1997; Zhao, et al., 2000). We performed quantitative RT-PCR to evaluate expression of SMAD6 and SMAD7 in YST1-7, GER1-3, and two embryonal carcinoma cell lines; NCCIT and NTERA-2 cl.D1[NT2/D1] (Figure 4 and Supplementary Table 6). Yolk sac tumors showed significantly higher expression of both SMAD6 (p=0.048) and SMAD7 (p=0.019) compared to germinomas (Supplementary Table 6). Compared to embryonal carcinoma cell lines yolk sac tumors showed significantly greater expression of both SMAD6 (p=0.035) and SMAD7 (p=0.004) expression as well. Within the GER class, SMAD7 expression was more heterogeneous, perhaps reflecting the influence of the TGF-β pathway, which is active in germinomas as well as YSTs. SMAD6 expression was higher in all YSTs tested compared to GERs, thus distinguishing between these two tumor subtypes. Differential expression and the observed heterogeneity was not likely due to low transcript levels as almost all Ct values were between 20 and 30 cycles (Supplementary Table 6).
Figure 4. Expression levels of inhibitory SMAD6 and SMAD7 distinguish YSTs and GERs.

Quantitative mRNA expression of SMAD6 and SMAD7. We performed quantitative RT-PCR to evaluate mRNA expression of SMAD6 and SMAD7: transcriptional targets of TGF-β/BMP transduction and inhibitors of TGF-β/BMP signaling. EC1: NCCIT, EC2:NTERA-2 cl.D1[NT2/D1]. Error bars indicate 95% confidence intervals.
microRNA Expression Profiling
As with other multi-component biochemical pathways, TGF-β/BMP signaling can be fine-tuned by the action of micro-RNAs (miRNAs) (Yin, et al., 2010). miRNAs have been intensively investigated in many cancers including leukemias, lymphomas, and lung, breast, and colon cancers (Croce, 2009; Iorio & Croce, 2009). In germ cell tumors, miR-372 and miR-373 have been suggested to play a role in tumorigenesis, likely through dampening of p53-mediated tumor suppression in testicular GCTs of young adults and adolescents via inhibition of Large Tumor Suppressor homolog 2 (LATS2) (Voorhoeve, et al., 2006). In a high-throughput screen by Gillis et al., the miR 371-373 cluster was found to be highly expressed in type II and III malignant germ cell tumors of adolescents and young adults (Gillis, et al., 2007; Looijenga, et al., 2007). In pediatric central nervous system tumors, Wang et al. have shown distinguishing miRNA profiles among germinomas and non-germinomatous malignant germ cell tumors (Wang, et al., 2010). More recently, Palmer et al. profiled 32 pediatric GCTs in comparison to normal gonadal specimens and identified the highest degree of differential expression to occur among the miR-371-373 and miR-302 clusters (Palmer, et al., 2010). In a subsequent analysis, miRNA expression in pediatric yolk sac tumors and germinomas were directly compared. Murray et al. identified 66 miRNA differentially expressed; 29 with greater expression in YSTs and 37 with greater expression in GER (p<0.01) (Murray, et al., 2010). To understand whether differential miRNA expression could account for the disparity of BMP signaling in GERs and YSTs, we profiled 782 miRNAs in the tumors (Supplementary Table 7). In agreement with previous results, all of the tumors expressed high levels of miR-373 (Supplementary Table 8). 65 miRNAs were differentially expressed comparing GERs to YSTs (Figure 5), of which 34 miRNAs were expressed above a manufacturer-defined signal threshold of 500. Of these, 20 miRNAs were significantly greater (p<0.05) in YSTs, and 14 miRNAs were significantly greater (p<0.05) in dysgerminomas (Table 4). Using a target prediction algorithm (Maragkakis, et al., 2009b), we conducted a pathway analysis of miRNAs expressed at a higher level in YSTs and a separate analysis of those expressed more highly in GERs. Of the 30 differentially-expressed miRNAs evaluable with the algorithm, 23 are predicted to target components of the TGF-β/BMP signaling pathway (Supplementary Table 9). We performed a secondary analysis, which increases specificity by taking into account the calculated p-value of the union of all co-expressed microRNAs predicted to target a given pathway (Papadopoulos, et al., 2009). This analysis identified TGF-β/BMP signaling as one of the two pathways most highly targeted by the set of differentially expressed miRNAs.
Among the top targets of the miR-200 family, which are highly expressed in YSTs, is the BMP inhibitor Noggin (Figure 6C). To determine whether the mir-200 expression level might impact Noggin protein expression, we performed immunohistochemistry for Noggin and compared the results to noggin mRNA and miR-200 expression (Figure 6A). Tumor YST4 exhibited high relative noggin mRNA expression but lower noggin protein, compared to YST1 and YST3. Strikingly, YST4 also showed the highest relative expression of miR-200b. This tumor also showed 3+ positivity for pSMAD1/5/8 (Table 1). To further test this correlation, we examined the relative expressions of Noggin mRNA and protein in germinomas. Germinomas did not express miR-200b, but did express the related family member, miR-200c. GER2 expressed relatively high levels of Noggin mRNA but lower levels of protein, compared with GER3 (Figure 6B). As with YST4, tumor GER2 also expressed higher levels of miR-200c. Like Noggin itself, miR-200 expression is induced by BMPs (Samavarchi-Tehrani, et al., 2010). Our results suggest that miR-200 expression may inhibit Noggin protein expression to fine-tune the negative-feedback effects of BMP-induced Noggin mRNA expression. The correlation between high miR-200 expression and low Noggin protein is intriguing, however further mechanistic studies will be required to validate the model, as well as the potential role of other miRNAs, more highly expressed in GERs, that are predicted to target BMP signaling at the level of ligands, receptors or intracellular SMADs (Figure 6C).
Discussion
As a group, germ cell tumors present interesting scientific and clinical challenges. Reflecting their origin in a pluripotent primordial or embryonic germ cell, these tumors can take on a remarkable range of histologic appearances. Germinomatous tumors (seminomas in males, dysgerminomas in females and germinomas in the CNS) retain appearance and gene expression characteristic of primitive germ cells. On the other hand, differentiation of these primitive germ cells gives rise to tumors that exhibit characteristics of all three germ layers (teratomas) or even of extra-embryonic tissues (yolk sac tumor and choriocarcinoma). The ability of embryonic stem cells or induced pluripotent stem cells (iPS) to form teratomas is in fact a criterion used to judge pluripotency. Therefore, studies in germ cell tumors have the potential to illuminate fundamental questions of stem cell biology. Beyond the interesting biology of germ cell tumors, these different differentiation states can be clinically significant. For example, in children mature teratomas are benign, whereas yolk sac tumors are uniformly malignant (Frazier & Amatruda, 2009), and choriocarcinomas tend to be more metastatic and aggressive than other types of GCTs (Bahrami, et al., 2007; Suita, et al., 2002). For these reasons, a better understanding of the molecular mechanisms that drive differentiation patterns in germ cell tumors is needed.
Biochemical pathways important in embryonic development, such as wnt/β-catenin, TGF-β, Notch and Hedgehog, have increasingly been found to be misregulated in a wide variety of cancers (Baryawno, et al., 2010; Bolos, et al., 2007; Miele, et al., 2006; Reya & Clevers, 2005; Rubin & Rowitch, 2002), including pediatric tumors such as medulloblastoma, hepatoblastoma and lymphoblastic leukemia. Using cDNA expression profiling and immunohistochemistry of childhood germ cell tumors, Fritsch and colleagues demonstrated differential activity of wnt/β-catenin signaling (Fritsch, et al., 2006). Undifferentiated tumors such as germinomas and embryonal carcinomas lacked nuclear β-catenin, indicating absence of active canonical wnt signaling. In contrast, differentiated tumor types such as immature teratoma, yolk sac tumor and choriocarcinoma displayed activity of the wnt/β-catenin pathway. These results are similar to our findings of differential BMP signaling activity in childhood GCTs, suggesting that both wnt and BMP may mediate differentiation in germ cell tumors. Studies in other systems have revealed extensive cross-talk between the BMP pathway and other embryonic signaling pathways, including wnt, Notch, Hedgehog and Ras-MAP Kinase (Guo & Wang, 2009; Katoh, 2007; Miyazono, et al., 2005). Determining whether the BMP and wnt pathways directly modulate one another, or instead act in parallel to mediate differentiation, will require further studies. These results stand in contrast to the ubiquitous nature of TGF-β/SMAD3 signaling, which is active in all histologic types of GCTs, both in our studies and in those of Dias et al. (Dias, et al., 2009). The anti-pSMAD3 antibody used in the present study has some cross-reactivity to pSMAD1 and pSMAD5; therefore we cannot rule out that some of the pSMAD3 signal in YSTs is due to pSMAD1/5. However, the pSMAD3 results agree with those obtained by Dias et al. using a different antibody. Interestingly, phosphorylated SMAD2/3 is ubiquitously present during development of the fetal mouse testis, as early as E13.5 (Mendis, et al., 2010). In contrast, whereas BMP-SMAD signaling is required for primordial germ cell specification (Tsang, et al., 2001; Ying, et al., 2000; Ying, et al., 2001), the pathway is inactive at later stages of testis development: SMADs 1, 5 and 8, the BMP responsive SMADs, are not expressed in the prenatal testis (Itman & Loveland, 2008; Itman, et al., 2006). Because germ cell tumors are thought to arise from primitive, embryonic germ cells (Frazier & Amatruda, 2009), the lack of BMP signaling in germinomatous tumors may reflect the developmental stage of the GCT cell of origin. Alternatively, the BMP pathway may be aberrantly downregulated in germinomas due to mutation or other pathogenic mechanisms.
While expression profiling of TGF-β/BMP pathway genes clearly separates YSTs and GERs in unsupervised clustering analysis, we also noted heterogeneity between tumors within the same histologic class. Within YSTs, one tumor (YST1), which exhibited relatively low expression of TGF-β/BMP pathway genes, was also negative for pSMAD1/5/8 on immunohistochemistry, suggesting that the low level of pathway gene expression was functionally significant. This tumor was a primary hepatic yolk sac tumor, an unusual tumor that is notable for highly elevated AFP expression (Gunawardena, et al., 2002; Hart, 1975; Mann, et al., 1990). The other YST on the tissue microarray that was negative for pSMAD1/5/8 was a recurrent tumor (Table 1). More studies will be needed to ascertain whether absence of BMP signaling in YSTs is associated with less common clinical presentations.
The inhibitory SMADs, SMAD6 and SMAD7, were differentially expressed in our dataset. Yolk sac tumors uniformly exhibited higher levels of expression of both SMAD6 and SMAD7 than did germinomas. Both SMAD6 and SMAD7 can be induced by both TGF-β and BMP ligands (Afrakhte, et al., 1998; Benchabane & Wrana, 2003; Wang, et al., 2007). Whereas SMAD7 inhibits both TGF-β/SMAD3 and BMP/SMAD1 signaling, SMAD6 is a relatively specific inhibitor of BMP signaling (Hata, et al., 1998; Imamura, et al., 1997; Itoh & Ten Dijke, 2007). SMAD6 is more strongly induced by BMPs than by TGF-β in most cell types (Li, et al., 2003), which likely accounts for the relatively greater SMAD6 expression that we found in YSTs compared to GERs. SMAD7 was also more highly expressed in YSTs, which could reflect induction by BMPs. Another possibility is that, although both YSTs and GERs displayed nuclear pSMAD3, indicating active TGF-β signaling, the TGF-β pathway may be more highly activated overall in YSTs. Supporting this idea is our finding of higher expression of several TGF-β target genes in YSTs, including GSC, TGFB1/1, COL31A1, IGFBP3, TSC22D1 and JUNB. Interestingly, GER2, which of germinomatous tumors displayed the most “YST-like” gene expression, also had the highest levels of SMAD7 expression. Taken together, these results suggest that SMAD6 expression may serve as a useful diagnostic marker for yolk sac tumors. More studies will be needed to clarify the role of inhibitory SMADs in germ cell tumor differentiation. A recent study revealed non-canonical effects of SMAD7 on expression of Chordin (a BMP inhibitor) and T/Brachyury (De Almeida, et al., 2008), further highlighting the complex interplay of proteins within the TGF-β/BMP pathway.
In our miRNA analysis, we profiled 782 miRNAs and identified 20 miRNAs to be significantly higher (p<0.05) in YSTs. Eight of these (miR-375, miR-302 cluster, miR-638, miR-122, miR-200b, and miR-200c) were previously identified by Murray and coworkers to be expressed at a greater level in YSTs (Murray, et al., 2010) Our data further support the findings of others (Murray, et al., 2010; Palmer, et al., 2010; Scheel, et al., 2009) suggesting the misregulation of the miR-302 cluster in germ cell tumorigenesis. In germinomas, we identified 14 miRNAs to be expressed at significantly greater levels compared to YSTs (p<0.05) ; 3 of which (miR-182, miR-146b-5p, miR-155) were shown to be differentially expressed by Murray et al. as well (Murray, et al., 2010). The differences between our results and those of Murray et al. could be due to variations among individual tumors, or due to differences in sample size, microRNA preparation or in the platforms used for profiling.
Our results suggest that the miR-200 family may modulate negative feedback due to BMP-induced Noggin expression. It is likely that many other miRNAs contribute as well. In normal development, miRNAs modulate TGF-β/BMP driven embryonic differentiation in a gradient fashion, often with multiple miRNAs targeting several components of the signaling pathway in concert, including SMADs (Inui, et al.). Yin and coworkers recently reported that miR-155 inhibits BMP signaling during Epstein-Barr virus reactivation in B cells (Yin, et al., 2010). In our dataset, miR-155 was one of the most highly expressed micro-RNAs in germinomas, suggesting that miR-155 may inhibit BMP signaling in this tumor type. Strikingly, the differentially-regulated group of miRNAs that we identified is specifically predicted to target TGF-β/BMP pathway signaling, using a pathway-centered target prediction algorithm that takes coexpression into account (Figure 6C). Recently, SMADs have been shown to augment Drosha cleavage and regulate up to 20 different miRNAs, including miR-21 (Davis, et al., 2008; Davis, et al., 2010; Hata & Davis, 2009), suggesting the possibility that complex feedback mechanisms centered on micro-RNAs may modulate BMP signaling in GCTs.
Taken together, our results highlight the potential importance of BMP signaling in the development of germ cell tumors. In particular, BMP/SMAD signaling correlates with the differentiation state of germ cell tumors, being mostly absent in undifferentiated germinomas, and highly active in differentiated yolk sac tumors. Whether BMP signaling activity also contributes to proliferation and survival of yolk sac tumor cells remains to be determined. These data suggest that the BMP pathway may represent a fruitful area for the development of novel, targeted therapies for refractory germ cell tumors.
Supplementary Material
Acknowledgments
We thank Shama Khokhar, MS for making construction of the tissue microarray and for performing immunohistochemistry experiments. Supported by a grant from the Children’s Medical Center Dallas Clinical Research Advisory Committee and grant 1R01CA135731 from the National Cancer Institute to JFA.
Footnotes
Author contributions: NF, JCN, DR and JFA planned the experiments. NF, JCN, CSA and DR carried out the experiments. NF and JFA wrote the manuscript.
References
- Abbott DE, Postovit LM, Seftor EA, Margaryan NV, Seftor RE, Hendrix MJ. Exploiting the convergence of embryonic and tumorigenic signaling pathways to develop new therapeutic targets. Stem Cell Rev. 2007;3:68–78. doi: 10.1007/s12015-007-0010-x. [DOI] [PubMed] [Google Scholar]
- Afrakhte M, Moren A, Jossan S, Itoh S, Sampath K, Westermark B, Heldin CH, Heldin NE, ten Dijke P. Induction of inhibitory smad6 and smad7 mrna by tgf-beta family members. Biochem Biophys Res Commun. 1998;249:505–511. doi: 10.1006/bbrc.1998.9170. [DOI] [PubMed] [Google Scholar]
- Bahrami A, Ro JY, Ayala AG. An overview of testicular germ cell tumors. Arch Pathol Lab Med. 2007;131:1267–1280. doi: 10.5858/2007-131-1267-AOOTGC. [DOI] [PubMed] [Google Scholar]
- Bartholin L, Maguer-Satta V, Hayette S, Martel S, Gadoux M, Corbo L, Magaud JP, Rimokh R. Transcription activation of flrg and follistatin by activin a, through smad proteins, participates in a negative feedback loop to modulate activin a function. Oncogene. 2002;21:2227–2235. doi: 10.1038/sj.onc.1205294. [DOI] [PubMed] [Google Scholar]
- Baryawno N, Sveinbjornsson B, Kogner P, Johnsen JI. Medulloblastoma: A disease with disorganized developmental signaling cascades. Cell Cycle. 2010;9 doi: 10.4161/cc.9.13.12170. [DOI] [PubMed] [Google Scholar]
- Benchabane H, Wrana JL. Gata- and smad1-dependent enhancers in the smad7 gene differentially interpret bone morphogenetic protein concentrations. Mol Cell Biol. 2003;23:6646–6661. doi: 10.1128/MCB.23.18.6646-6661.2003. [DOI] [PMC free article] [PubMed] [Google Scholar]
- Bokemeyer C, Berger CC, Kuczyk MA, Schmoll HJ. Evaluation of long-term toxicity after chemotherapy for testicular cancer. J Clin Oncol. 1996;14:2923–2932. doi: 10.1200/JCO.1996.14.11.2923. [DOI] [PubMed] [Google Scholar]
- Bolos V, Grego-Bessa J, de la Pompa JL. Notch signaling in development and cancer. Endocr Rev. 2007;28:339–363. doi: 10.1210/er.2006-0046. [DOI] [PubMed] [Google Scholar]
- Bosl GJ, Leitner SP, Atlas SA, Sealey JE, Preibisz JJ, Scheiner E. Increased plasma renin and aldosterone in patients treated with cisplatin-based chemotherapy for metastatic germ-cell tumors. J Clin Oncol. 1986;4:1684–1689. doi: 10.1200/JCO.1986.4.11.1684. [DOI] [PubMed] [Google Scholar]
- Bouras M, Tabone E, Bertholon J, Sommer P, Bouvier R, Droz JP, Benahmed M. A novel smad4 gene mutation in seminoma germ cell tumors. Cancer Res. 2000;60:922–928. [PubMed] [Google Scholar]
- Cardillo MR, Petrangeli E, Ravenna L, Salvatori L, Di Silverio F. Transforming growth factor-beta expression in human testicular neoplasms. Anal Quant Cytol Histol. 1998;20:461–469. [PubMed] [Google Scholar]
- Casellas R, Brivanlou AH. Xenopus smad7 inhibits both the activin and bmp pathways and acts as a neural inducer. Dev Biol. 1998;198:1–12. doi: 10.1006/dbio.1998.8893. [DOI] [PubMed] [Google Scholar]
- Cobellis L, Cataldi P, Reis FM, De Palo G, Raspagliesi F, Pilotti S, Arcuri F, Petraglia F. Gonadal malignant germ cell tumors express immunoreactive inhibin/activin subunits. Eur J Endocrinol. 2001;145:779–784. doi: 10.1530/eje.0.1450779. [DOI] [PubMed] [Google Scholar]
- Coffey J, Birtle AJ, Cogill G, Christmas TJ, Rapley EA, Huddart RA. A discussion of the biology of testicular cancer and current concepts in the management of stage i and bilateral disease. Clin Oncol (R Coll Radiol) 2005;17:441–447. doi: 10.1016/j.clon.2005.05.008. [DOI] [PubMed] [Google Scholar]
- Coffey J, Linger R, Pugh J, Dudakia D, Sokal M, Easton DF, Timothy Bishop D, Stratton M, Huddart R, Rapley EA. Somatic kit mutations occur predominantly in seminoma germ cell tumors and are not predictive of bilateral disease: Report of 220 tumors and review of literature. Genes Chromosomes Cancer. 2008;47:34–42. doi: 10.1002/gcc.20503. [DOI] [PubMed] [Google Scholar]
- Cohen J. A coefficient of agreement for nominal scales. Educ Psych Meas. 1960;20:37–46. [Google Scholar]
- Croce CM. Causes and consequences of microrna dysregulation in cancer. Nat Rev Genet. 2009;10:704–714. doi: 10.1038/nrg2634. [DOI] [PMC free article] [PubMed] [Google Scholar]
- Davis BN, Hilyard AC, Lagna G, Hata A. Smad proteins control drosha-mediated microrna maturation. Nature. 2008;454:56–61. doi: 10.1038/nature07086. [DOI] [PMC free article] [PubMed] [Google Scholar]
- Davis BN, Hilyard AC, Nguyen PH, Lagna G, Hata A. Smad proteins bind a conserved rna sequence to promote microrna maturation by drosha. Mol Cell. 2010;39:373–384. doi: 10.1016/j.molcel.2010.07.011. [DOI] [PMC free article] [PubMed] [Google Scholar]
- de Almeida I, Rolo A, Batut J, Hill C, Stern CD, Linker C. Unexpected activities of smad7 in xenopus mesodermal and neural induction. Mech Dev. 2008;125:421–431. doi: 10.1016/j.mod.2008.02.002. [DOI] [PMC free article] [PubMed] [Google Scholar]
- Dias VL, Rajpert-De Meyts E, McLachlan R, Loveland KL. Analysis of activin/tgfb-signaling modulators within the normal and dysfunctional adult human testis reveals evidence of altered signaling capacity in a subset of seminomas. Reproduction. 2009;138:801–811. doi: 10.1530/REP-09-0206. [DOI] [PubMed] [Google Scholar]
- Einhorn LH, Brames MJ, Heinrich MC, Corless CL, Madani A. Phase ii study of imatinib mesylate in chemotherapy refractory germ cell tumors expressing kit. Am J Clin Oncol. 2006;29:12–13. doi: 10.1097/01.coc.0000195086.47548.ef. [DOI] [PubMed] [Google Scholar]
- Einhorn LH, Donohue JP. Improved chemotherapy in disseminated testicular cancer. J Urol. 1977;117:65–69. doi: 10.1016/s0022-5347(17)58338-x. [DOI] [PubMed] [Google Scholar]
- Frazier AL, Amatruda JF. Germ cell tumors. In: Fisher DE, Nathan D, Look AT, editors. Nathan and oski’s textbook of pediatric hematology-oncology. Elsevier; London: 2009. [Google Scholar]
- Fritsch MK, Schneider DT, Schuster AE, Murdoch FE, Perlman EJ. Activation of wnt/beta-catenin signaling in distinct histologic subtypes of human germ cell tumors. Pediatr Dev Pathol. 2006;9:115–131. doi: 10.2350/08-05-0097.1. [DOI] [PubMed] [Google Scholar]
- Gillis AJ, Stoop HJ, Hersmus R, Oosterhuis JW, Sun Y, Chen C, Guenther S, Sherlock J, Veltman I, Baeten J, van der Spek PJ, de Alarcon P, Looijenga LH. High-throughput micrornaome analysis in human germ cell tumours. J Pathol. 2007;213:319–328. doi: 10.1002/path.2230. [DOI] [PubMed] [Google Scholar]
- Goddard NC, McIntyre A, Summersgill B, Gilbert D, Kitazawa S, Shipley J. Kit and ras signalling pathways in testicular germ cell tumours: New data and a review of the literature. Int J Androl. 2007;30:337–348. doi: 10.1111/j.1365-2605.2007.00769.x. discussion 349. [DOI] [PubMed] [Google Scholar]
- Gouedard L, Chen YG, Thevenet L, Racine C, Borie S, Lamarre I, Josso N, Massague J, di Clemente N. Engagement of bone morphogenetic protein type ib receptor and smad1 signaling by anti-mullerian hormone and its type ii receptor. J Biol Chem. 2000;275:27973–27978. doi: 10.1074/jbc.M002704200. [DOI] [PubMed] [Google Scholar]
- Gunawardena SA, Siriwardana HP, Wickramasinghe SY, Madurawe MN, Fernando R. Primary endodermal sinus (yolk sac) tumour of the liver. Eur J Surg Oncol. 2002;28:90–91. doi: 10.1053/ejso.2001.1187. [DOI] [PubMed] [Google Scholar]
- Guo X, Wang XF. Signaling cross-talk between tgf-beta/bmp and other pathways. Cell Res. 2009;19:71–88. doi: 10.1038/cr.2008.302. [DOI] [PMC free article] [PubMed] [Google Scholar]
- Hale GA, Marina NM, Jones-Wallace D, Greenwald CA, Jenkins JJ, Rao BN, Luo X, Hudson MM. Late effects of treatment for germ cell tumors during childhood and adolescence. J Pediatr Hematol Oncol. 1999;21:115–122. doi: 10.1097/00043426-199903000-00007. [DOI] [PubMed] [Google Scholar]
- Hansen SW, Groth S, Daugaard G, Rossing N, Rorth M. Long-term effects on renal function and blood pressure of treatment with cisplatin, vinblastine, and bleomycin in patients with germ cell cancer. J Clin Oncol. 1988;6:1728–1731. doi: 10.1200/JCO.1988.6.11.1728. [DOI] [PubMed] [Google Scholar]
- Hart WR. Primary endodermal sinus (yolk sac) tumor of the liver. First reported case. Cancer. 1975;35:1453–1458. doi: 10.1002/1097-0142(197505)35:5<1453::aid-cncr2820350533>3.0.co;2-u. [DOI] [PubMed] [Google Scholar]
- Hata A, Davis BN. Control of microrna biogenesis by tgfbeta signaling pathway-a novel role of smads in the nucleus. Cytokine Growth Factor Rev. 2009;20:517–521. doi: 10.1016/j.cytogfr.2009.10.004. [DOI] [PMC free article] [PubMed] [Google Scholar]
- Hata A, Lagna G, Massague J, Hemmati-Brivanlou A. Smad6 inhibits bmp/smad1 signaling by specifically competing with the smad4 tumor suppressor. Genes Dev. 1998;12:186–197. doi: 10.1101/gad.12.2.186. [DOI] [PMC free article] [PubMed] [Google Scholar]
- Hime GR, Loveland KL, Abud HE. Drosophila spermatogenesis: Insights into testicular cancer. Int J Androl. 2007;30:265–274. doi: 10.1111/j.1365-2605.2007.00767.x. discussion 274. [DOI] [PubMed] [Google Scholar]
- Imamura T, Takase M, Nishihara A, Oeda E, Hanai J, Kawabata M, Miyazono K. Smad6 inhibits signalling by the tgf-beta superfamily. Nature. 1997;389:622–626. doi: 10.1038/39355. [DOI] [PubMed] [Google Scholar]
- Inui M, Martello G, Piccolo S. Microrna control of signal transduction. Nat Rev Mol Cell Biol. 11:252–263. doi: 10.1038/nrm2868. [DOI] [PubMed] [Google Scholar]
- Iorio MV, Croce CM. Micrornas in cancer: Small molecules with a huge impact. J Clin Oncol. 2009;27:5848–5856. doi: 10.1200/JCO.2009.24.0317. [DOI] [PMC free article] [PubMed] [Google Scholar]
- Itman C, Loveland KL. Smad expression in the testis: An insight into bmp regulation of spermatogenesis. Dev Dyn. 2008;237:97–111. doi: 10.1002/dvdy.21401. [DOI] [PubMed] [Google Scholar]
- Itman C, Mendis S, Barakat B, Loveland KL. All in the family: Tgf-beta family action in testis development. Reproduction. 2006;132:233–246. doi: 10.1530/rep.1.01075. [DOI] [PubMed] [Google Scholar]
- Itman C, Small C, Griswold M, Nagaraja AK, Matzuk MM, Brown CW, Jans DA, Loveland KL. Developmentally regulated smad2 and smad3 utilization directs activin signaling outcomes. Dev Dyn. 2009;238:1688–1700. doi: 10.1002/dvdy.21995. [DOI] [PMC free article] [PubMed] [Google Scholar]
- Itoh S, ten Dijke P. Negative regulation of tgf-beta receptor/smad signal transduction. Curr Opin Cell Biol. 2007;19:176–184. doi: 10.1016/j.ceb.2007.02.015. [DOI] [PubMed] [Google Scholar]
- Kanetsky PA, Mitra N, Vardhanabhuti S, Li M, Vaughn DJ, Letrero R, Ciosek SL, Doody DR, Smith LM, Weaver J, Albano A, Chen C, Starr JR, Rader DJ, Godwin AK, Reilly MP, Hakonarson H, Schwartz SM, Nathanson KL. Common variation in kitlg and at 5q31.3 predisposes to testicular germ cell cancer. Nat Genet. 2009;41:811–815. doi: 10.1038/ng.393. [DOI] [PMC free article] [PubMed] [Google Scholar]
- Katoh M. Networking of wnt, fgf, notch, bmp, and hedgehog signaling pathways during carcinogenesis. Stem Cell Rev. 2007;3:30–38. doi: 10.1007/s12015-007-0006-6. [DOI] [PubMed] [Google Scholar]
- Kemmer K, Corless CL, Fletcher JA, McGreevey L, Haley A, Griffith D, Cummings OW, Wait C, Town A, Heinrich MC. Kit mutations are common in testicular seminomas. Am J Pathol. 2004;164:305–313. doi: 10.1016/S0002-9440(10)63120-3. [DOI] [PMC free article] [PubMed] [Google Scholar]
- Kuczyk M, Bokemeyer C, Hartmann JT. Advances in our understanding of the biology, new diagnostic approaches and recent treatment strategies for testicular germ cell cancer. World J Urol. 2004;22:1. doi: 10.1007/s00345-004-0401-4. [DOI] [PubMed] [Google Scholar]
- Li X, Ionescu AM, Schwarz EM, Zhang X, Drissi H, Puzas JE, Rosier RN, Zuscik MJ, O’Keefe RJ. Smad6 is induced by bmp-2 and modulates chondrocyte differentiation. J Orthop Res. 2003;21:908–913. doi: 10.1016/S0736-0266(03)00008-1. [DOI] [PubMed] [Google Scholar]
- Liu F, Hata A, Baker JC, Doody J, Carcamo J, Harland RM, Massague J. A human mad protein acting as a bmp-regulated transcriptional activator. Nature. 1996;381:620–623. doi: 10.1038/381620a0. [DOI] [PubMed] [Google Scholar]
- Looijenga LH, Gillis AJ, Stoop H, Hersmus R, Oosterhuis JW. Relevance of micrornas in normal and malignant development, including human testicular germ cell tumours. Int J Androl. 2007;30:304–314. doi: 10.1111/j.1365-2605.2007.00765.x. discussion 314–305. [DOI] [PubMed] [Google Scholar]
- Loveland KL, Hime G. Tgfbeta superfamily members in spermatogenesis: Setting the stage for fertility in mouse and drosophila. Cell Tissue Res. 2005;322:141–146. doi: 10.1007/s00441-005-0008-0. [DOI] [PubMed] [Google Scholar]
- Mann JR, Kasthuri N, Raafat F, Pincott JR, Parkes SE, Muir KR, Ingram LC, Cameron AH. Malignant hepatic tumours in children: Incidence, clinical features and aetiology. Paediatr Perinat Epidemiol. 1990;4:276–289. doi: 10.1111/j.1365-3016.1990.tb00651.x. [DOI] [PubMed] [Google Scholar]
- Maragkakis M, Alexiou P, Papadopoulos GL, Reczko M, Dalamagas T, Giannopoulos G, Goumas G, Koukis E, Kourtis K, Simossis VA, Sethupathy P, Vergoulis T, Koziris N, Sellis T, Tsanakas P, Hatzigeorgiou AG. Accurate microrna target prediction correlates with protein repression levels. BMC Bioinformatics. 2009a;10:295. doi: 10.1186/1471-2105-10-295. [DOI] [PMC free article] [PubMed] [Google Scholar]
- Maragkakis M, Reczko M, Simossis VA, Alexiou P, Papadopoulos GL, Dalamagas T, Giannopoulos G, Goumas G, Koukis E, Kourtis K, Vergoulis T, Koziris N, Sellis T, Tsanakas P, Hatzigeorgiou AG. Diana-microt web server: Elucidating microrna functions through target prediction. Nucleic Acids Res. 2009b;37:W273–276. doi: 10.1093/nar/gkp292. [DOI] [PMC free article] [PubMed] [Google Scholar]
- Mehra A, Wrana JL. Tgf-beta and the smad signal transduction pathway. Biochem Cell Biol. 2002;80:605–622. doi: 10.1139/o02-161. [DOI] [PubMed] [Google Scholar]
- Mendis SH, Meachem SJ, Sarraj MA, Loveland KL. Activin a balances sertoli and germ cell proliferation in the fetal mouse testis. Biol Reprod. 2010 doi: 10.1095/biolreprod.110.086231. [DOI] [PubMed] [Google Scholar]
- Meng X, Lindahl M, Hyvonen ME, Parvinen M, de Rooij DG, Hess MW, Raatikainen-Ahokas A, Sainio K, Rauvala H, Lakso M, Pichel JG, Westphal H, Saarma M, Sariola H. Regulation of cell fate decision of undifferentiated spermatogonia by gdnf. Science. 2000;287:1489–1493. doi: 10.1126/science.287.5457.1489. [DOI] [PubMed] [Google Scholar]
- Miele L, Golde T, Osborne B. Notch signaling in cancer. Curr Mol Med. 2006;6:905–918. doi: 10.2174/156652406779010830. [DOI] [PubMed] [Google Scholar]
- Mithraprabhu S, Mendis S, Meachem SJ, Tubino L, Matzuk MM, Brown CW, Loveland KL. Activin bioactivity affects germ cell differentiation in the postnatal mouse testis in vivo. Biol Reprod. 2010;82:980–990. doi: 10.1095/biolreprod.109.079855. [DOI] [PMC free article] [PubMed] [Google Scholar]
- Miyazono K, Maeda S, Imamura T. Bmp receptor signaling: Transcriptional targets, regulation of signals, and signaling cross-talk. Cytokine Growth Factor Rev. 2005;16:251–263. doi: 10.1016/j.cytogfr.2005.01.009. [DOI] [PubMed] [Google Scholar]
- Morichika K, Kataoka K, Terayama K, Tazaki A, Kinoshita T, Watanabe K, Mochii M. Perturbation of notch/suppressor of hairless pathway disturbs migration of primordial germ cells in xenopus embryo. Dev Growth Differ. 2010;52:235–244. doi: 10.1111/j.1440-169X.2009.01164.x. [DOI] [PubMed] [Google Scholar]
- Murray MJ, Saini HK, van Dongen S, Palmer RD, Muralidhar B, Pett MR, Piipari M, Thornton CM, Nicholson JC, Enright AJ, Coleman N. The two most common histological subtypes of malignant germ cell tumour are distinguished by global microrna profiles, associated with differential transcription factor expression. Mol Cancer. 2010;9:290. doi: 10.1186/1476-4598-9-290. [DOI] [PMC free article] [PubMed] [Google Scholar]
- Nakao A, Afrakhte M, Moren A, Nakayama T, Christian JL, Heuchel R, Itoh S, Kawabata M, Heldin NE, Heldin CH, ten Dijke P. Identification of smad7, a tgfbeta-inducible antagonist of tgf-beta signalling. Nature. 1997;389:631–635. doi: 10.1038/39369. [DOI] [PubMed] [Google Scholar]
- Okpanyi V, Schneider DT, Zahn S, Sievers S, Calaminus G, Nicholson JC, Palmer RD, Leuschner I, Borkhardt A, Schonberger S. Analysis of the adenomatous polyposis coli (apc) gene in childhood and adolescent germ cell tumors. Pediatr Blood Cancer. 2010 doi: 10.1002/pbc.22669. [DOI] [PubMed] [Google Scholar]
- Oosterhuis JW, Looijenga LH. Testicular germ-cell tumours in a broader perspective. Nat Rev Cancer. 2005;5:210–222. doi: 10.1038/nrc1568. [DOI] [PubMed] [Google Scholar]
- Osanto S, Bukman A, Van Hoek F, Sterk PJ, De Laat JA, Hermans J. Long-term effects of chemotherapy in patients with testicular cancer. J Clin Oncol. 1992;10:574–579. doi: 10.1200/JCO.1992.10.4.574. [DOI] [PubMed] [Google Scholar]
- Palmer RD, Murray MJ, Saini HK, van Dongen S, Abreu-Goodger C, Muralidhar B, Pett MR, Thornton CM, Nicholson JC, Enright AJ, Coleman N. Malignant germ cell tumors display common microrna profiles resulting in global changes in expression of messenger rna targets. Cancer Res. 2010;70:2911–2923. doi: 10.1158/0008-5472.CAN-09-3301. [DOI] [PMC free article] [PubMed] [Google Scholar]
- Papadopoulos GL, Alexiou P, Maragkakis M, Reczko M, Hatzigeorgiou AG. Diana-mirpath: Integrating human and mouse micrornas in pathways. Bioinformatics. 2009;25:1991–1993. doi: 10.1093/bioinformatics/btp299. [DOI] [PubMed] [Google Scholar]
- Puglisi R, Montanari M, Chiarella P, Stefanini M, Boitani C. Regulatory role of bmp2 and bmp7 in spermatogonia and sertoli cell proliferation in the immature mouse. Eur J Endocrinol. 2004;151:511–520. doi: 10.1530/eje.0.1510511. [DOI] [PubMed] [Google Scholar]
- Purdue MP, Sakoda LC, Graubard BI, Welch R, Chanock SJ, Sesterhenn IA, Rubertone MV, Erickson RL, McGlynn KA. A case-control investigation of immune function gene polymorphisms and risk of testicular germ cell tumors. Cancer Epidemiol Biomarkers Prev. 2007;16:77–83. doi: 10.1158/1055-9965.EPI-06-0573. [DOI] [PubMed] [Google Scholar]
- Rapley EA, Turnbull C, Al Olama AA, Dermitzakis ET, Linger R, Huddart RA, Renwick A, Hughes D, Hines S, Seal S, Morrison J, Nsengimana J, Deloukas P, Rahman N, Bishop DT, Easton DF, Stratton MR. A genome-wide association study of testicular germ cell tumor. Nat Genet. 2009;41:807–810. doi: 10.1038/ng.394. [DOI] [PMC free article] [PubMed] [Google Scholar]
- Reya T, Clevers H. Wnt signalling in stem cells and cancer. Nature. 2005;434:843–850. doi: 10.1038/nature03319. [DOI] [PubMed] [Google Scholar]
- Rubin JB, Rowitch DH. Medulloblastoma: A problem of developmental biology. Cancer Cell. 2002;2:7–8. doi: 10.1016/s1535-6108(02)00090-9. [DOI] [PubMed] [Google Scholar]
- Saitou M, Barton SC, Surani MA. A molecular programme for the specification of germ cell fate in mice. Nature. 2002;418:293–300. doi: 10.1038/nature00927. [DOI] [PubMed] [Google Scholar]
- Samavarchi-Tehrani P, Golipour A, David L, Sung HK, Beyer TA, Datti A, Woltjen K, Nagy A, Wrana JL. Functional genomics reveals a bmp-driven mesenchymal-to-epithelial transition in the initiation of somatic cell reprogramming. Cell Stem Cell. 2010;7:64–77. doi: 10.1016/j.stem.2010.04.015. [DOI] [PubMed] [Google Scholar]
- Scheel AH, Beyer U, Agami R, Dobbelstein M. Immunofluorescence-based screening identifies germ cell associated microrna 302 as an antagonist to p63 expression. Cell Cycle. 2009;8:1426–1432. doi: 10.4161/cc.8.9.8324. [DOI] [PubMed] [Google Scholar]
- Sela-Donenfeld D, Kalcheim C. Localized bmp4-noggin interactions generate the dynamic patterning of noggin expression in somites. Dev Biol. 2002;246:311–328. doi: 10.1006/dbio.2002.0672. [DOI] [PubMed] [Google Scholar]
- Shi Y, Massague J. Mechanisms of tgf-beta signaling from cell membrane to the nucleus. Cell. 2003;113:685–700. doi: 10.1016/s0092-8674(03)00432-x. [DOI] [PubMed] [Google Scholar]
- Strumberg D, Brugge S, Korn MW, Koeppen S, Ranft J, Scheiber G, Reiners C, Mockel C, Seeber S, Scheulen ME. Evaluation of long-term toxicity in patients after cisplatin-based chemotherapy for non-seminomatous testicular cancer. Ann Oncol. 2002;13:229–236. doi: 10.1093/annonc/mdf058. [DOI] [PubMed] [Google Scholar]
- Suita S, Shono K, Tajiri T, Takamatsu T, Mizote H, Nagasaki A, Inomata Y, Hara T, Okamura J, Miyazaki S, Kawakami K, Eguchi H, Tsuneyoshi M. Malignant germ cell tumors: Clinical characteristics, treatment, and outcome. A report from the study group for pediatric solid malignant tumors in the kyushu area, japan. J Pediatr Surg. 2002;37:1703–1706. doi: 10.1053/jpsu.2002.36700. [DOI] [PubMed] [Google Scholar]
- Surani MA, Ancelin K, Hajkova P, Lange UC, Payer B, Western P, Saitou M. Mechanism of mouse germ cell specification: A genetic program regulating epigenetic reprogramming. Cold Spring Harb Symp Quant Biol. 2004;69:1–9. doi: 10.1101/sqb.2004.69.1. [DOI] [PubMed] [Google Scholar]
- Szczepny A, Hime GR, Loveland KL. Expression of hedgehog signalling components in adult mouse testis. Dev Dyn. 2006;235:3063–3070. doi: 10.1002/dvdy.20931. [DOI] [PubMed] [Google Scholar]
- Szczepny A, Hogarth CA, Young J, Loveland KL. Identification of hedgehog signaling outcomes in mouse testis development using a hanging drop-culture system. Biol Reprod. 2009;80:258–263. doi: 10.1095/biolreprod.108.067926. [DOI] [PMC free article] [PubMed] [Google Scholar]
- Tsang TE, Khoo PL, Jamieson RV, Zhou SX, Ang SL, Behringer R, Tam PP. The allocation and differentiation of mouse primordial germ cells. Int J Dev Biol. 2001;45:549–555. [PubMed] [Google Scholar]
- Turnbull C, Rapley EA, Seal S, Pernet D, Renwick A, Hughes D, Ricketts M, Linger R, Nsengimana J, Deloukas P, Huddart RA, Bishop DT, Easton DF, Stratton MR, Rahman N. Variants near dmrt1, tert and atf7ip are associated with testicular germ cell cancer. Nat Genet. 2010;42:604–607. doi: 10.1038/ng.607. [DOI] [PMC free article] [PubMed] [Google Scholar]
- Voorhoeve PM, le Sage C, Schrier M, Gillis AJ, Stoop H, Nagel R, Liu YP, van Duijse J, Drost J, Griekspoor A, Zlotorynski E, Yabuta N, De Vita G, Nojima H, Looijenga LH, Agami R. A genetic screen implicates mirna-372 and mirna-373 as oncogenes in testicular germ cell tumors. Cell. 2006;124:1169–1181. doi: 10.1016/j.cell.2006.02.037. [DOI] [PubMed] [Google Scholar]
- Wang HW, Wu YH, Hsieh JY, Liang ML, Chao ME, Liu DJ, Hsu MT, Wong TT. Pediatric primary central nervous system germ cell tumors of different prognosis groups show characteristic mirnome traits and chromosome copy number variations. BMC Genomics. 2010;11:132. doi: 10.1186/1471-2164-11-132. [DOI] [PMC free article] [PubMed] [Google Scholar]
- Wang Q, Wei X, Zhu T, Zhang M, Shen R, Xing L, O’Keefe RJ, Chen D. Bone morphogenetic protein 2 activates smad6 gene transcription through bone-specific transcription factor runx2. J Biol Chem. 2007;282:10742–10748. doi: 10.1074/jbc.M610997200. [DOI] [PMC free article] [PubMed] [Google Scholar]
- Williams SD, Birch R, Einhorn LH, Irwin L, Greco FA, Loehrer PJ. Treatment of disseminated germ-cell tumors with cisplatin, bleomycin, and either vinblastine or etoposide. N Engl J Med. 1987;316:1435–1440. doi: 10.1056/NEJM198706043162302. [DOI] [PubMed] [Google Scholar]
- Yin Q, Wang X, Fewell C, Cameron J, Zhu H, Baddoo M, Lin Z, Flemington EK. Microrna mir-155 inhibits bone morphogenetic protein (bmp) signaling and bmp-mediated epstein-barr virus reactivation. J Virol. 2010;84:6318–6327. doi: 10.1128/JVI.00635-10. [DOI] [PMC free article] [PubMed] [Google Scholar]
- Ying Y, Liu XM, Marble A, Lawson KA, Zhao GQ. Requirement of bmp8b for the generation of primordial germ cells in the mouse. Mol Endocrinol. 2000;14:1053–1063. doi: 10.1210/mend.14.7.0479. [DOI] [PubMed] [Google Scholar]
- Ying Y, Qi X, Zhao GQ. Induction of primordial germ cells from murine epiblasts by synergistic action of bmp4 and bmp8b signaling pathways. Proc Natl Acad Sci U S A. 2001;98:7858–7862. doi: 10.1073/pnas.151242798. [DOI] [PMC free article] [PubMed] [Google Scholar]
- Zhao GQ, Chen YX, Liu XM, Xu Z, Qi X. Mutation in bmp7 exacerbates the phenotype of bmp8a mutants in spermatogenesis and epididymis. Dev Biol. 2001;240:212–222. doi: 10.1006/dbio.2001.0448. [DOI] [PubMed] [Google Scholar]
- Zhao GQ, Deng K, Labosky PA, Liaw L, Hogan BL. The gene encoding bone morphogenetic protein 8b is required for the initiation and maintenance of spermatogenesis in the mouse. Genes Dev. 1996;10:1657–1669. doi: 10.1101/gad.10.13.1657. [DOI] [PubMed] [Google Scholar]
- Zhao GQ, Liaw L, Hogan BL. Bone morphogenetic protein 8a plays a role in the maintenance of spermatogenesis and the integrity of the epididymis. Development. 1998;125:1103–1112. doi: 10.1242/dev.125.6.1103. [DOI] [PubMed] [Google Scholar]
- Zhao J, Crowe DL, Castillo C, Wuenschell C, Chai Y, Warburton D. Smad7 is a tgf-beta-inducible attenuator of smad2/3-mediated inhibition of embryonic lung morphogenesis. Mech Dev. 2000;93:71–81. doi: 10.1016/s0925-4773(00)00281-1. [DOI] [PubMed] [Google Scholar]
Associated Data
This section collects any data citations, data availability statements, or supplementary materials included in this article.