Abstract
Cell migration requires the fine spatiotemporal integration of many proteins that regulate the fundamental processes that drive cell movement. Focal adhesion (FA) dynamics is a continuous process involving coordination between FA and actin cytoskeleton, which is essential for cell migration. We studied the spatiotemporal relationship between the dynamics of focal adhesion kinase (FAK) and paxillin at FAs in the protrusion of living endothelial cells. Concurrent dual-color imaging showed that FAK was assembled at FA first, which was followed by paxillin recruitment to the FA. By tracking and quantifying FAK and paxillin in migrating cells, the normalized FAK/Paxillin fluorescence intensity (FI) ratio is > 1 (≈4 fold) at cell front, ≈1 at cell center, and < 1 at cell rear. The significantly higher FAK FI than paxillin FI at cell front indicates that the assembly of FAK-FAs occurs ahead of paxillin at cell front. To determine the time difference between the assemblies of FAK and paxillin at nascent FAs, FAs containing both FAK and paxillin were quantified by image analysis and time correlation. The results show that FAK assembles at the nascent FAs earlier than paxillin in the protrusions at cell front.
Cell migration controls morphogenesis and inflammation and is a cornerstone of development and homeostasis, as well as many disease states. Cell migration requires the fine spatiotemporal integration of many proteins that regulate the processes that drive cell movement1. FA dynamics (assembly and disassembly) is a continuous process involving coordination between FA and actin cytoskeleton, which is required for cell migration2. The regulation of attachment between F-actin and integrins via proteins within FAs is thought to be critical for controlling the spatiotemporal variability of cell protrusion and retraction3,4.
Numerous studies have established FAK as a central mediator of integrin signaling as well as an important component of signaling by other cell surface receptors in many cell types that contribute to pathogenesis of cancer and other diseases5. As an intracellular protein-tyrosine kinase (PTK) recruited to and activated at FA sites, FAK is a key signaling PTK that acts downstream of various growth factors and extracellular matrix (ECM) components. Activated FAK recruits c-Src at FA sites to form a FAK–Src signaling complex. This complex phosphorylates other FA signaling and adapter proteins such as paxillin, thereby activating diverse signaling pathways in the regulation of cell migration6,7.
FAK serves as a unique regulator of FA assembly and disassembly, processes that are fundamental for efficient directional cell movement8,9. FAK is a leading edge organizer. Nascent FAs are formed at cell periphery by integrin and ECM interactions. Paxillin is another important cytoskeletal and scaffolding protein recruited early to nascent FAs at cell front and is necessary for FA turnover (adhesion disassembly at cell front) during cell migration10. The precise mechanism that controls adhesion disassembly is currently unclear, but potentially involves the interactions of paxillin with FAK-Src complex to regulate myosin-light-chain-kinase-dependent contractility11,12,13,14.
FAK is also involved in cytoskeletal remodeling and assembly/disassembly of cell adhesion, and it is an important promoter of directional cell movement15,16,17. We previously investigated separately the dynamics of FAK18 and paxillin19 associated with actin filaments20 in endothelial cells (ECs). The present study focused on investigating concurrently the dynamics of FAK and paxillin at the nascent FAs in migrating cells. The dynamics of FAK (GFP-FAK) and paxillin (mCherry-paxillin) were monitored simultaneously in the same live ECs by using time-lapse double-color imaging. Dual-color image series showed that FAK was assembled at FA first and that this was followed by paxillin recruitment at the FA. By tracking and quantifying FAK and paxillin, the results indicate that FAK assembly occurs ahead of that of paxillin at individual FAs in protrusions of migrating cells.
Results
Monitoring and quantifying dynamics of GFP-FAK and mCherry-paxillin at cell front, center and rear in migrating cells
In cell migration, the two key steps are FA formation (assembly) and disassembly. To investigate FA dynamics during cell migration, we obtained the double-color images of ECs expressing GFP-FAK and mCherry-paxillin by time-lapse confocal microscopy. The movies show the dynamics (assembly and disassembly) of FAK-containing adhesions (FAK-FAs) and paxillin-containing adhesions (paxillin-FAs) in migrating ECs. FA disassembly is observed both at the cell rear, where it promotes rear retraction, and at the cell front, where it accompanies the FA formation in new protrusions to result in FA turnover. At the rear of migrating cells, the release of adhesions results in retraction of the cell tail and a net forward translocation of the cell body (Supplementary Movies S1–3).
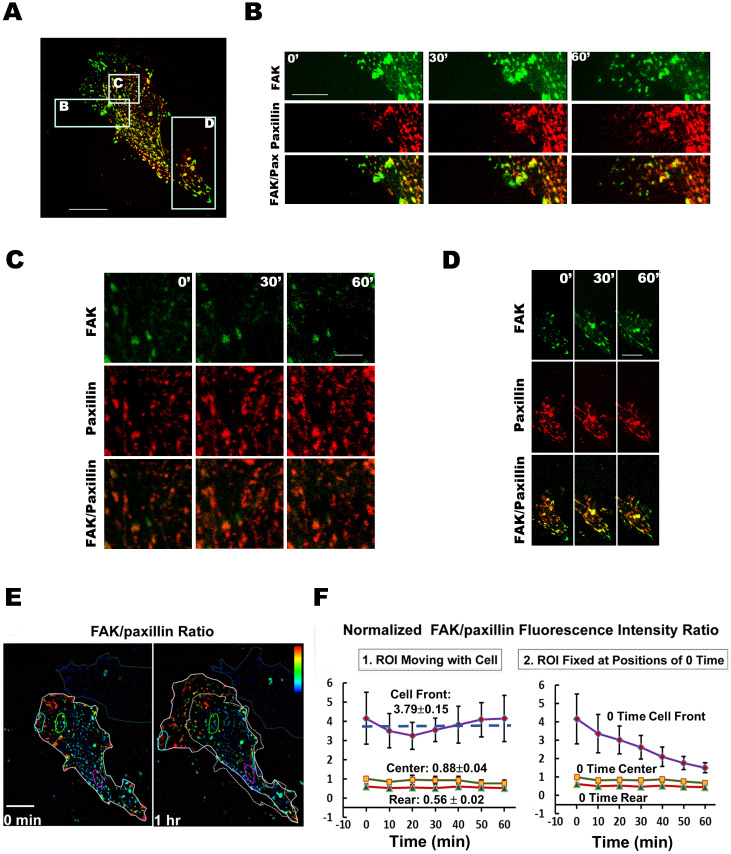
Fig. 1A shows the image of a cell with FAK- and paxillin-FAs. The boxed areas B (cell front), C (cell center) and D (cell rear) are magnified in Figs. 1B, 1C, and 1D, respectively; each of these magnified photo panels show the images for FAK, paxillin and their FI ratio at 0, 30, and 60 min. The results indicate that the dynamics of FAK-FAs and paxillin-FAs are different at the front (Fig. 1B; Supplementary Movie S4–6), center (Fig. 1C; Supplementary Movie S7), and rear of the cell (Fig. 1D; Supplementary Movie S8). Fig. 1E shows the FAK/paxillin FI ratio (pseudocolored) in this cell (same cell as 1A) at 0 (left) and 60 min (right) with regions of interest (ROIs) identified and tracked along the cell movement. The FIs of both FAK and paxillin were quantified at the three ROIs (i.e., cell front, center, and rear) of eleven migrating cells. The 60-min time course of the FAK/paxillin FI ratio in the three ROIs is expressed in two ways: In Fig. 1F1, the ROIs being tracked and measured are moved with the cell, whereas in Fig. 1F2 the ROIs are fixed at their 0-time positions in the field of view without moving with the cells. All results are normalized to the 0-min value at cell center for each cell. When the ROIs are moved with the cell (Fig. 1F1), the ratio values in all three regions do not vary significantly with time; the ratio is > 1 at cell front (mean ± s.e.m.; 3.79 ± 0.15), ≈1 at cell center (0.88 ± 0.04), and < 1 at cell rear (0.56 ± 0.02). When the ROI is fixed at 0-time position (Fig. 1F2), however, the FI ratio at the initial cell front decreases as cell moves forward, but there are little changes in the ROIs fixed at initial cell center and rear. These data show that the intensity of FAK-FAs is much higher than paxillin-FAs at the protrusive region of cell front. At cell center and rear, there are significantly less differences between FAK and paxillin at FAs in migrating cells. Such analysis was performed on eleven cells (Fig. 1F), and the results confirmed our visual observations that the FAK/paxillin FI ratio was highest at cell front, intermediate at cell center, and lowest at cell rear.
Figure 1. Dynamics of FAK and paxillin in a live EC transfected with GFP-FAK (green) and mCherry–paxillin (red).
(A) FAK and paxillin in the cell. The three boxed regions are cell front (B), center (C) and rear (D), with enlarged views shown in panels (B), (C) and (D), respectively. B–D show the results for FAK, paxillin, and FAK + Paxillin at 0, 30 and 60 min. In these ratio photos, superimposition of GFP-FAK (green) and mCherry-paxillin (red) images appears as yellow. During the 60-min of cell migration, there are many more GFP-FAK clusters than mCherry-paxillin at cell front (B), but they are more similar in numbers at cell center (C), and rear (D). The corresponding Supplementary Movies are S4–6 for B, S7 for C, and S8 D. Scale bars: A = 20 μm, B = 15 μm, C = 4.5 μm and D = 12 μm. (E) FI ratio images of FAK/paxillin in the same cell as 1A at 0 (left) and 60 min (right). The cell contour at 60 min is outlined in solid white, whereas the initial cell contour (0 min) is outlined with dashed white. Pseudo-color for the FAK/paxillin FI ratio value ranges from low (blue) to high (red) (ROIs in both panels are cyan for cell front, green for center, and pink for rear) (Supplementary Movie S9). Scale bar = 18 μm. (F) Time courses (over 60-min) of FAK/paxillin FI ratio at the three ROIs as shown in Figs. 1E. FI ratios of FAK/paxillin at cell front, center and rear were obtained from eleven migrating cells, each with seven time points. The bar graphs represent mean ± s.e.m. (F1) ROIs moving with the cell migration. (F2) ROIs staying at fixed positions (0-time).
Quantifying time difference in assembly between FAK and paxillin at nascent FAs in the protruding regions of cell front
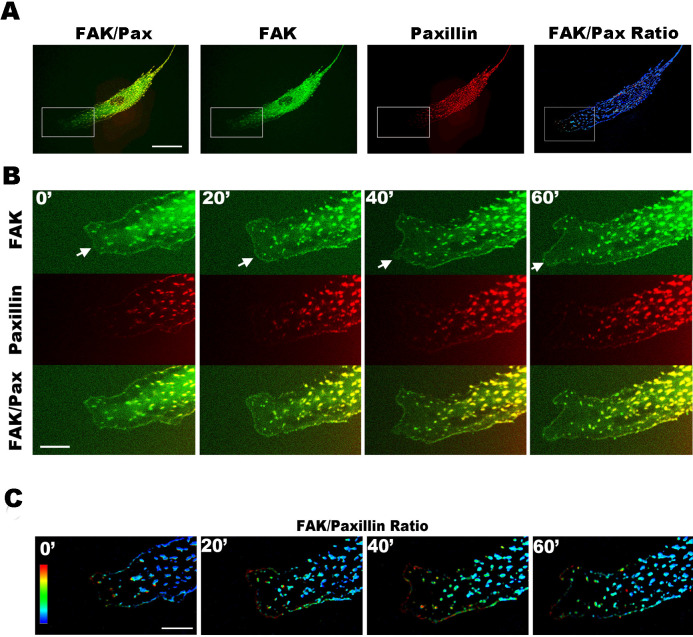
In the migrating cells co-transfected with GFP-FAK and mCherry-paxillin, we observed that there are more FAK-FAs than paxillin-FAs at the cell front (Fig. 2A, 2B; Supplementary Movie S10–13). The movies and images show that FAK was assembled first at the nascent FAs at cell front, followed by paxillin assembly in the same FAs. This phenomenon is demonstrated by the pseudo-color (FAK/paxillin FI ratio value) image series (Fig. 2A-right, 2C; Supplementary Movies S14–15).
Figure 2. Dual-color images showing the dynamic motion of FAK and paxillin at the protrusion front of a live EC transfected with GFP-FAK (green) and mCherry–paxillin (red).
(A) An intact cell image showing (from left to right) FAK (green) + Paxillin (red), FAK (green), paxillin (red), and FAK/Paxillin FI ratio (pseudo-color). In FAK+Paxillin, the superimposition of FAK and Paxillin yield yellow (Supplementary Movie S10). (B) Enlarged images from the boxed regions in A row. During the 60-min time course, there were more FAK clusters (arrows) than paxillin at the protrusions of cell front (Supplementary Movies S11–13). (C) FAK/paxillin FI ratio image, pseudo-color ranges from low (blue) to high (red). Enlarged images were from the boxed region in A-“FAK/Pax Ratio”. FAK-FAs are more apparent at the protrusion front than paxillin during 60-min time course (Supplementary Movies 14–15). Scale bars: A = 20 μm; B and C = 7 μm.
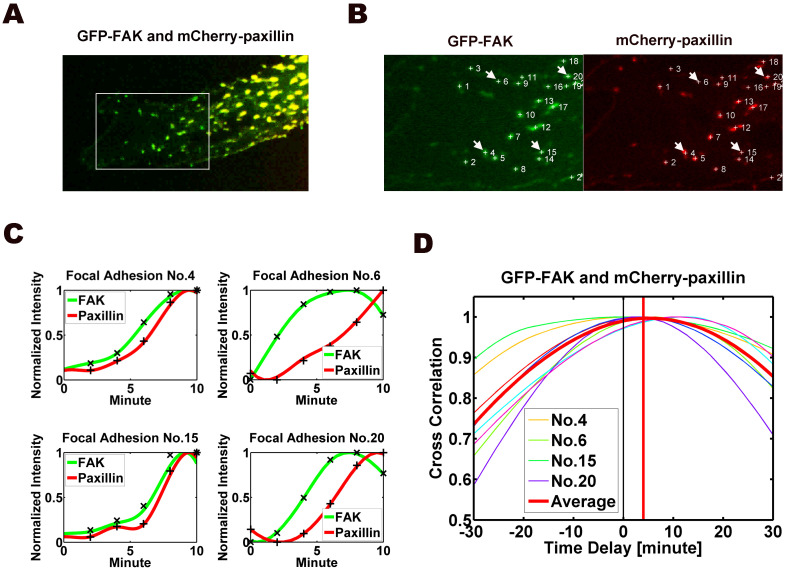
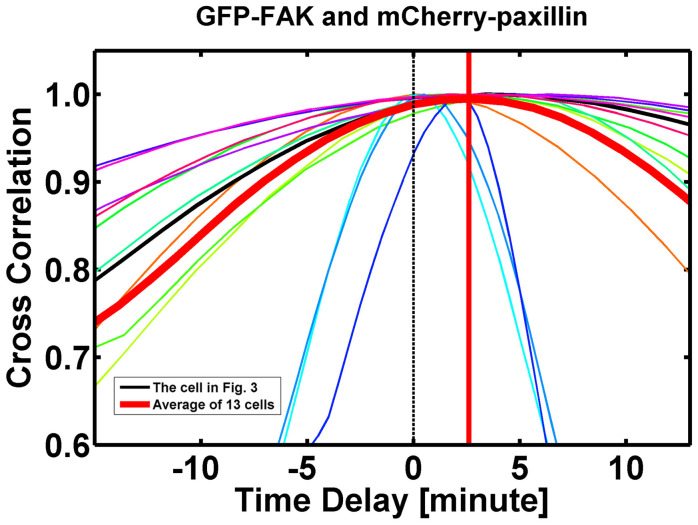
To determine the time difference between the assemblies of FAK and paxillin at nascent FAs at cell front, the image series of thirteen migrating cells were measured and analyzed (Fig. 3A), including the cell reported in Figs. 1 and 2. The FAK and paxillin images were captured simultaneously at each time point for the quantification of time differences between FAK and paxillin dynamics at nascent (assembling) FAs in cell front. A pair of image frames in which FAK and paxillin attained their maximum values at each FA (labeled with numbers in Fig. 3B) were selected and identified as the final frames (Fig. 3B), and the FAK and paxillin intensities at the FA were tracked backward from the final frames. The pair of frames that attained the minimum values of FAK and paxillin were selected as their respective initial frames. Fig. 3C shows the time courses of the FI values of FAK and paxillin for four of these FAs (No. 4, 6, 15, and 20 in Fig. 3B). Time correlation analysis for these four and all the other FAs marked in 3B was used to deduce the time shift between FAK (green) and paxillin (red) at each of the 22 FAs marked, as well as the mean curve for all 22 FAs in that same cell (Fig. 3D). Fig. 4 shows the combined results of such analysis on all thirteen cells, with a total of 206 FAs. The results indicate that FAK is assembled ahead of paxillin in the nascent FAs at the cell front, leading by 2.62 ± 0.27 min (mean ± s.e.m.).
Figure 3. Image analysis of dynamics of FAK and paxillin at FAs at the protrusion front of an EC transfected with GFP-FAK and mCherry-paxillin.
(A) Co-localization of FAK (green) and paxillin (red) yielded a yellow color. Boxed region was selected as regions of interest shown in B. (B) Identified FAs were labeled with numbers. The pairs of FAK (left) and paxillin (right) at the same FAs were selected for quantification analysis. (C) The time courses of normalized intensities (y-axis) of FAK (green) and paxillin (red) in four FAs (No. 4, 5, 16 and 20, arrowed and labeled in B) are plotted. (D) The values of the time correlation for all 22 FAs in the same cell (including the four FAs in C) are plotted as a function of time shift between FAK and paxillin at FAs. Also plotted is the mean curve for all 22 FAs in this cell. The results of time correlation analysis of this cell (22 individual FAs) yielded a time shift of 4.21 ± 0.87 min (mean ± s.e.m.). The value is significantly different from 0 (p < 0.001) indicates the time shift at dynamic FAs.
Figure 4. The results of time correlation analysis of independent experiments on thirteen migrating cells (206 individual FAs) yielded a time shift of 2.62 ± 0.27 min (mean ± s.e.m.) between GFP-FAK and mCherry-paxillin, which is significantly different from 0 (n = 206, p < 0.001).
The localization and distribution of FAK, paxillin, and actin filaments at the leading edge of cell front
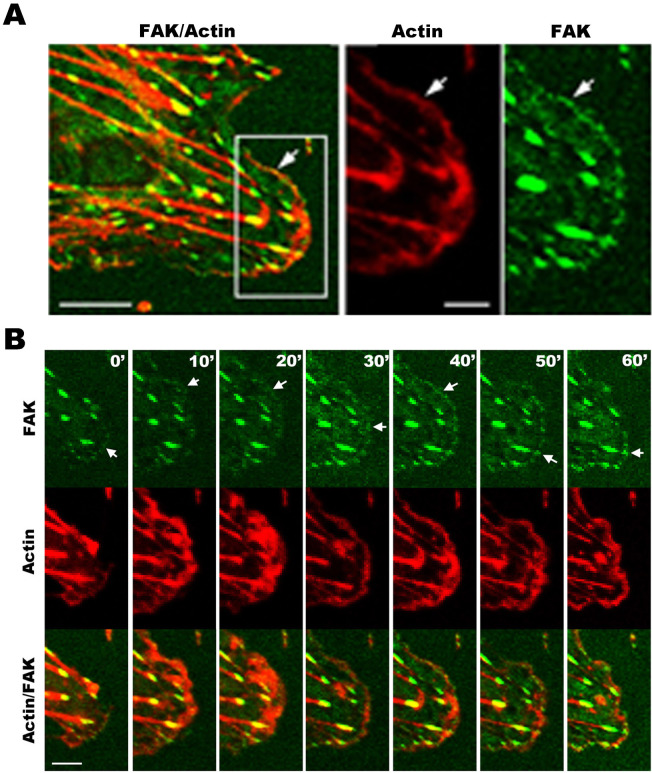
To investigate the dynamics of FAK and actin filaments in migrating cells, we co-transfected ECs with GFP-FAK and RFP-actin (Fig. 5). The intracellular dynamics of GFP-FAK (green) and RFP-actin (red) expressed in live cells were obtained with time-lapse video recording. FAK clusters are observed to associate with actin filaments (Fig. 5; Supplementary Movie S16). The boxed region in Fig. 5A-left is enlarged in Fig. 5A-right. A 60-min image series reveals the dynamics of FAK and actin filaments at the cell leading edge (Fig. 5B; Supplementary Movie S16). The colocalization of some FAK clusters with actin indicates that the dynamics of FAK-clusters can be associated with actin filaments at the cell leading edge.
Figure 5. Dual-color images show the dynamic motion of FAK and actin filaments in protrusion of cell front in live EC transfected with GFP-FAK and RFP-actin.
(A-left) Cell images show the superimposition (“FAK/Actin”; yellow) of FAK (green) and actin (red). Scale bar = 20 µm. (A-right) The enlarged images for actin and FAK show the boxed region in A-left. Scale bar = 8 µm. FAK clusters are associated with actin filaments (arrows). (B) The dynamics of FAK and actin filaments in the box region (A-left). The superimposition (FAK/Actin; yellow) of FAK (green) and actin (red) show FAK associated with actin filaments at the leading edge of the protrusion front during the 60-min time course (arrows) (Supplementary Movie 16). Scale bar = 12.5 µm.
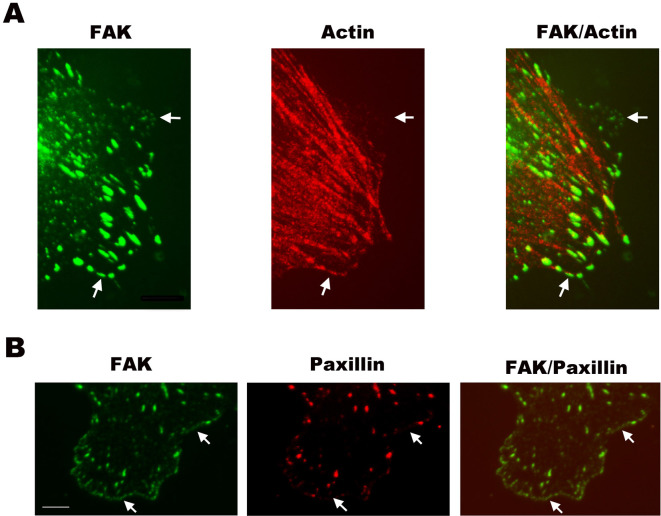
To validate the results obtained on live cells using exogenous fusion proteins of FAK and actin filaments, we applied laser scanning confocal microscopy to visualize the endogenous FAK and actin filaments localization in fixed cells. Fig. 6A shows the fluorescence images of FAK and actin filaments, as well as their merged images. These pictures show the presence of FAK immunostaining as plaques in the fixed cell at cell periphery (arrows). Actin filaments show strong staining with the formation of extensive arrays of stress fibers (SFs), with weak staining at cell periphery. In the merged pictures, FAK spots are positioned at the ends of the stress fibers, and some FAK spots are positioned at the cell periphery with actin filaments (arrows). At the cell periphery, actn filament staining is very weak (up arrow). These immunostaining results are consistent with the live cell images (Fig. 5; Supplementary Movies S16), showing GFP-FAK may be associated with actin filaments at the cell leading edge.
Figure 6. The immunostaining images of an EC stained with FAK, paxillin and actin filaments.
(A) The fluorescence photomicrographs show FAK immunostained with anti-FAK (left column), F-actin stained with rhodamine-phalloidin (middle column), and merging of FAK (green) and F-actin (red) images, with a yellow color for co-localization of FAK and actin filaments (right column). FAK and actin filaments are shown to be co-localized. FAK plaques are present at the points where stress fibers end and some FAK plaques are present at cell periphery (arrows). Actin filaments show staining weakly (up arrow). Scale bar = 6 μm. (B) Fluorescence photomicrographs show FAK (left column) and paxillin (middle column) immunfluorescence stained with anti-FAK and anti-paxillin antibodies, respectively. Merging of FAK (green) and paxillin (red) images (right column), with a yellow color for co-localization of FAK and paxillin. At the cell periphery, there are many more FAK plaques than paxillin plaques (arrows). Scale bar = 10 μm.
To validate the results obtained on live cells using exogenous fusion proteins of FAK and paxillin, we applied laser scanning confocal microscopy to visualize endogenous FAK and paxillin on fixed cells stained with the anti-FAK and anti-paxillin antibodies. Fig. 6B shows the fluorescence images of FAK and paxillin, as well as their merged image at the cell periphery. At the cell periphery there are many FAK spots, and only a few visible paxillin spots (arrows). Hence, these immunostaining results are consistent with the live cell images (Figs. 1B, 2B; Supplementary Movies S1–3, S11–13), which show that there are more GFP-FAK clusters than mCherry-paxillin at the cell leading edge.
Discussion
Directional cell migration requires continuous formation, maturation, and turnover of FAs at the leading edge. Nascent FAs that are assembled at cell front undergo either rapid turnover or maturation in response to contractile forces21. Mature FAs facilitate cell contractility to pull the cell forward and are subsequently disassembled22. In our study, the dynamics of FAK and paxillin at FAs was monitored in space and time within the migrating endothelial cell. The results show that the ratio of FAK and paxillin at FAs is different at different cell regions. At the cell front, there is more accumulation of FAK than paxillin, but not at cell center and rear in migrating cells (Fig. 1).
FAK is a cytoplasmic kinase that is a key component that promotes FA turnover9. FAK can be recruited to the nucleus or nascent FAs in a highly regulated manner23. The increased FAK localization at FAs has been connected to FA disassembly and increased turnover in protrusion front. These signaling processes include phosphorylation of paxillin, which is associated with increased FAK Y397 phosphorylation at FAs13. Adhesion contacts are dynamic structures that assemble, disassemble or mature at the extending leading edge and disassemble at the retracting cell rear for efficient cell migration24,25. Previously, FAK and paxillin have been observed during FA assembly and turnover in mouse embryonic fibroblasts, and CHO.K1 cells3,14. However, the sequential entrance of FAK and paxillin into FAs has not been directly compared in endothelial cells. Our study monitored the dynamics of sequential recruitment of GFP-FAK and mCherry-paxillin mainly in bovine aortic endothelial cells.
FAK promotes cell migration via the activation of multiple signaling pathways involving kinases, or by phosphorylation of other FA components26. FAK may also promote cell migration by influencing the remodeling of the actin cytoskeleton. Our previous study showed that the dynamics of paxillin as fibrous structures was associated with actin filaments20. Here we show that the dynamics of FAK-clusters can be associated with actin filaments at the cell leading edge (Figs. 5, 6A). It is possible that the spatiotemporal regulation of the Rho family of small GTPases, which includes Cdc42, Rac1 and RhoA, and in turn the localized activation of a wide variety of effectors by these GTPases, can control the dynamics of the actin cytoskeleton and the actin-associated adhesions during polarized cell migration27. Paxillin has emerged as a key coordinator of the Rho GTPase family and of their signaling processes in the context of cell spreading and migration28.
It has been proposed that FAK and Src regulate cell adhesion disassembly via paxillin and the downstream kinases12. Paxillin is a substrate for the Src–FAK complex, and phosphorylation of paxillin on tyrosine residues is critical for focal adhesion disassembly29. Both FAK and paxillin play important roles in FA assembly and disassembly in cell migration. At present, our understanding of adhesion assembly/disassembly is limited. By simultaneously monitoring the dynamics of GFP-FAK and mCherry-paxillin (Supplementary Movies S1–3), we have demonstrated their differences in assembly/disassembly at nascent adhesions. By time correlation analysis of dynamic dual-color imaging in live cells, we further tracked and quantified the time difference between FAK and paxillin assembly in the same nascent FAs (Fig. 3). The results indicate that FAK is assembled 2.62 ± 0.27 min (mean ± s.e.m.) ahead of paxillin.
Our quantification is based on the relative change of fluorescence intensity tracked as a function of time and space (subcellular regions). As such, the spatiotemoral relationship of GFP-FAK and mCherry-paxillin at different subcellular regions in the same live cell can accurately reflect their relative motions inside the cell. In order to test the possibility that the difference between GFP-FAK and mCherry-paxillin might be due to the fluorescent proteins rather than the molecules themselves, we have engineered new constructs of GFP-paxillin and mCherry-FAK. The results of the swapping of the fluoresent probes showed that FAK leads paxillin in the nascent FAs in migrating cells for both sets of biosensors (Supplementary Figure S1, S2; Supplementary Movies S17).
Taken together, our results indicate that, while both FAK and paxillin play important roles in modulating FA dynamics, FAK assembly at FAs leads that of paxillin in the protrusions of cell front during cell migration. This study provides novel information on the hierarchical relation between two molecules that play important roles in single live cells. Such approaches can be applied to other signaling molecules to elucidate the molecular interplays in the signaling network governing cell functions in health and disease.
Methods
Cell culture
Bovine aorta endothelial cells (BAECs) were cultured in Dulbecco's modified Eagle's medium (DMEM) (Life Technologies, Inc. Gaithersburg, MD) supplemented with 10% fetal calf serum (Invitrogen, Carlsbad, CA).
DNA plasmids and transfection
DNA plasmids encoding green fluorescent protein (GFP)-tagged FAK and (GFP)-tagged paxillin were provided by Drs. J. Thomas Parsons and Donna J. Webb (University of Virginia, Charlottesville, VA). Red fluorescent protein (RFP)-tagged actin was from Clontech Laboratories, Inc. (Mountain View, CA). We constructed DNA plasmids encoding mCherry fluorescent protein (mCherry)-tagged FAK, and (mCherry)-tagged paxillin. DNA plasmids were transfected into BAECs using FuGENE® 6 Transfection Reagent (Roche Diagnostics GmbH, Mannheim, Germany). After 24–48 hr, the transfected cells were seeded onto fibronectin-coated (Sigma Chemical Co., St. Louis, MO) cover glass in culture dishes (Mat Tek Co., Ashland, MA) for the experiments.
Multi-mode time-lapse microscope
Digital images of cell motility were obtained by using an Olympus live-cell confocal microscope system IX81 with a disk scan unit (DSU) (Olympus America Inc., Melville, NY). The two-color fluorescent images were taken alternatively by switching the excitation light paths. Fluorescent images were collected at 1–2 min intervals. MetaMorph® Imaging System (Molecular Devices Corporation, Sunnyvale, CA) was used to capture and store the images in a computer. Olympus filters for GFP (U-MGFPHQ) and RFP (DSU-MRFPHQ) were used.
Immunofluorescence staining and confocal microscopy
For immunostaining, the BAECs were fixed with 4% paraformaldehyde for 15 min at 37°C in phosphate-buffered saline (PBS). The fixed cells were permeabilized with 0.3% Triton X-100, and nonspecific binding was blocked by using 1% normal goat serum. The cells were then incubated with the primary polyclonal antibody FAK (Santa Cruz, CA), and monoclonal antibody paxillin (BD Biosciences) followed by fluorescein isothiocynanate (FITC)-conjugated secondary antibody and tetramethylrhodamine isothiocynanate (TRITC)-conjugated secondary antibody, respectively. For negative controls, the samples were incubated with either the primary antibody without the secondary antibody, or the FITC-labeled secondary antibody without the primary antibody. To visualize actin actin filaments, the cells were stained with rhodamine-conjugated phalloidin (Molecular Probes, Inc., Eugene, OR). The slides were examined by using an Olympus IX70 microscope equipped with a Perkin-Elmer Kypton-Argon laser scanning confocal imaging system (Perkin-Elmer Life Science, Boston, MA). FITC was excited at a wavelength of 488 nm and detected at 525 nm. Rhodamine was excited at 568 nm and detected at 600 nm. The images were transferred to a Macintosh computer for further analysis; the Adobe Photoshop (Adobe System, Mountain View, CA) was used to generate RGB images to depict paxillin and F-actin in red and FAK in green.
Image analysis and quantification of fluorescent intensity
MetaMorph and MATLAB were used to generate images. Focal adhesion (FA) characteristics, including the location and FI, were detected and calculated using our customized software developed in MATLAB based on the water algorithm. FAK and paxillin intensities were background-subtracted and filtered to remove the random noise and nonspecific intensity. The locations of the FAs were detected by intensity segmentation in the filtered FAK and paxillin images. The total intensities of FAK and paxillin at the FAs were determined within the regions of interest (ROIs) at subcellular locations (cell front, center, and rear) and used to calculate the FAK/paxillin ratios. The ROIs were either moved to track these locations of a moving cell (Fig. 1F1) or fixed in positions chosen at 0 min (Figs. 1F2). The curves were normalized by the 0-min value at cell center.
Determination of time shift between FAK and paxillin assembly at FA
Pairs of images of FAK and paxillin, which were captured simultaneously at each instant of time, were taken continuously with a time resolution of 1 to 2 minutes. Both sets of digital images that displayed FAK and paxillin were numerically processed to determine the average time shift between them. As FAK and paxillin were assembled at FAs and attained their maximum FI values, a pair of image frames (FAK and paxillin) at these time points of maxima were selected as the final frames. Then, two initial frames (FAK and paxillin) were selected by back-viewing to the times of the minimum FI values FAs were identified and labeled with numbers for tracking during image analysis (Fig. 3B). The intensities of the identified focal adhesions were plotted as functions of time by back-tracking the intensities of each pairs of FAs with the same labeled number. By comparing the FI values of both FAK and paxillin during the time course, the lagging phase between two curves can be used to approximate the time shift between FAK (green) and paxillin (red) (Fig. 3C). To track individual focal adhesions, the FAK and paxillin images at a given time were combined together to make a single global image where the signal intensity of each pixel is from the combination of FAK and paxillin signals. The locations of FAs were detected by thresholding in the global image. The FAK and paxillin FI intensities in each detected FA were determined. The time courses of the normalized intensity of FAK and paxillin within these focal adhesion areas were subsequently calculated and analyzed (Fig. 3).
The normalized intensities (y-axis) of both FAK and paxillin were plotted with respect to time. The normalized intensity was obtained by dividing the intensity of each focal adhesion by the maximum intensity of that focal adhesion; this normalization allowed us to compare signals of both FAK and paxillin with the same scale. The data were interpolated by using cubic spline lines to connect and smooth the curves. The time shift between FAK and paxillin was determined by using the time correlation function,
 |
where IFAK is the intensity of FAK; IPaxillin is the intensity of paxillin; t is time; and τ is the time shift.
The values of the time correlation were plotted as a function of τ. The highest value of the time correlation indicates the most probable time shift between FAK and paxillin at each FA (Fig. 3C). The series image analysis for four locations in a representative cell is shown in Fig. 3D, and the combined results of thirteen cells are shown in Fig. 4.
Statistics
Mean values and variances were calculated for the experiments. Analysis of variance (ANOVA) was performed by using data analysis tools of Microsoft Excel. Studdent's t-test was performed by using data analysis tools of Microsoft Excel and MATLAB. A P value of less than 0.01 was taken to be statistically significant for paired test of difference between mean. The results are expressed as means ± s.e.m. All plots were made with Microsoft Excel and MATLAB.
Author Contributions
Y.L.H., J.C.L. and S.C. designed the experiments. Y.L.H., S.L., Y.W. and S.C. wrote the main manuscript text. S.L. and K.W.S. designed and conducted the computational analysis. S.L. and K.W.S. prepared the figures and Y.L.H. made the movies. J.S. constructed DNA plasmids.
Supplementary Material
Supplementary Information
FAK in migrating cell
Paxillin in migrating cell
FAK(green)/Paxillin(red) in migrating cell
FAK at cell front
Paxillin at cell front
FAK(red)/Paxillin(red) at cell front
FAK(green)/Paxillin(red) at cell center
FAK(green)/Paxillin(red) at cell rear
FAK/Paxillin FI ratio (pseudo-color)
FAK(green)/Paxillin in migrating cell
FAK dynamics at cell leading edge
Paxillin dynamics at cell leading edge
FAK(green)/Paxillin(red) at cell leading edge
FAK/Paxillin FA ratio in a whole cell
FAK/Paxillin FI ratio at cell leading edge
FAK(green)/Actin(red) at cell leading edge
mCherry-FAK(red)/GFP-Paxillin(green) in migrating cell
Acknowledgments
We wish to thank Dr. J. Thomas Parsons for providing GFP-FAK DNA plasmids, and Phu Nguyen, Gerard Norwich and Christina Winter for excellent assistance. This work was supported by NHLBI Research Grants HL-104402 and HL-106579 (S.C.).
References
- Vicente-Manzanares M. & Horwitz A. R. Cell migration: an overview. Methods Mol Biol 769, 1–24 (2011). [DOI] [PubMed] [Google Scholar]
- Parsons J. T., Horwitz A. R. & Schwartz M. A. Cell adhesion: integrating cytoskeletal dynamics and cellular tension. Nat Rev Mol Cell Biol 11, 633–643 (2010). [DOI] [PMC free article] [PubMed] [Google Scholar]
- Choi C. K. et al. Actin and alpha-actinin orchestrate the assembly and maturation of nascent adhesions in a myosin II motor-independent manner. Nat Cell Biol 10, 1039–1050 (2008). [DOI] [PMC free article] [PubMed] [Google Scholar]
- Gupton S. L. & Waterman-Storer C. M. Spatiotemporal feedback between actomyosin and focal-adhesion systems optimizes rapid cell migration. Cell 125, 1361–1374 (2006). [DOI] [PubMed] [Google Scholar]
- McLean G. W. et al. The role of focal-adhesion kinase in cancer - a new therapeutic opportunity. Nat Rev Cancer 5, 505–515 (2005). [DOI] [PubMed] [Google Scholar]
- Parsons J. T. Focal adhesion kinase: the first ten years. J Cell Sci 116, 1409–1416 (2003). [DOI] [PubMed] [Google Scholar]
- Schlaepfer D. D. & Mitra S. K. Multiple connections link FAK to cell motility and invasion. Curr Opin Genet Dev 14, 92–101 (2004). [DOI] [PubMed] [Google Scholar]
- Franco S. J. & Huttenlocher A. Regulating cell migration: calpains make the cut. J Cell Sci 118 (2005). [DOI] [PubMed] [Google Scholar]
- Lim Y. et al. PyK2 and FAK connections to p190Rho guanine nucleotide exchange factor regulate RhoA activity, focal adhesion formation, and cell motility. J Cell Biol 180, 187–203 (2008). [DOI] [PMC free article] [PubMed] [Google Scholar]
- Deakin N. O. & Turner C. E. Paxillin comes of age. J Cell Sci 121, 2435–2444 (2008). [DOI] [PMC free article] [PubMed] [Google Scholar]
- Carragher N. O., Westhoff M. A., Fincham V. J., Schaller M. D. & Frame M. C. A novel role for FAK as a protease-targeting adaptor protein: regulation by p42 ERK and Src. Curr Biol: CB 13, 1442–1450 (2003). [DOI] [PubMed] [Google Scholar]
- Webb D. J. et al. FAK-Src signalling through paxillin, ERK and MLCK regulates adhesion disassembly. Nat Cell biol 6, 154–161 (2004). [DOI] [PubMed] [Google Scholar]
- Zaidel-Bar R., Milo R., Kam Z. & Geiger B. A paxillin tyrosine phosphorylation switch regulates the assembly and form of cell-matrix adhesions. J Cell Sci 120, 137–148 (2007). [DOI] [PubMed] [Google Scholar]
- Digman M. A., Wiseman P. W., Choi C., Horwitz A. R. & Gratton E. Stoichiometry of molecular complexes at adhesions in living cells. Proc Natl Acad Sci U S A 106, 2170–2175 (2009). [DOI] [PMC free article] [PubMed] [Google Scholar]
- Mitra S. K., Hanson D. A. & Schlaepfer D. D. Focal adhesion kinase: in command and control of cell motility. Nat Rev Mol Cell Biol 6, 56–68 (2005). [DOI] [PubMed] [Google Scholar]
- Pasapera A. M., Schneider I. C., Rericha E., Schlaepfer D. D. & Waterman C. M. Myosin II activity regulates vinculin recruitment to focal adhesions through FAK-mediated paxillin phosphorylation. J Cell Biol 188, 877–890 (2010). [DOI] [PMC free article] [PubMed] [Google Scholar]
- Schaller M. D. & Parsons J. T. pp125FAK-dependent tyrosine phosphorylation of paxillin creates a high-affinity binding site for Crk. Mol Cell Biol 15 (1995). [DOI] [PMC free article] [PubMed] [Google Scholar]
- Li S. et al. The role of the dynamics of focal adhesion kinase in the mechanotaxis of endothelial cells. Proc Natl Acad Sci U S A 99, 3546–3551 (2002). [DOI] [PMC free article] [PubMed] [Google Scholar]
- Hu Y. L. et al. Roles of microfilaments and microtubules in paxillin dynamics. Biochem Biophys Res Commun 348, 1463–1471 (2006). [DOI] [PubMed] [Google Scholar]
- Hu Y. L. & Chien S. Dynamic motion of paxillin on actin filaments in living endothelial cells. Biochem Biophys Res Commun 357, 871–876 (2007). [DOI] [PMC free article] [PubMed] [Google Scholar]
- Zaidel-Bar R., Ballestrem C., Kam Z. & Geiger B. Early molecular events in the assembly of matrix adhesions at the leading edge of migrating cells. J Cell Sci 116, 4605–4613 (2003). [DOI] [PubMed] [Google Scholar]
- Broussard J. A., Webb D. J. & Kaverina I. Asymmetric focal adhesion disassembly in motile cells. Curr Opin Cell Biol 20, 85–90 (2008). [DOI] [PubMed] [Google Scholar]
- Hsia D. A. et al. Differential regulation of cell motility and invasion by FAK. J Cell biol 160, 753–767 (2003). [DOI] [PMC free article] [PubMed] [Google Scholar]
- Webb D. J., Parsons J. T. & Horwitz A. F. Adhesion assembly, disassembly and turnover in migrating cells -- over and over and over again. Nat Cell Biol 4, E97–100 (2002). [DOI] [PubMed] [Google Scholar]
- Digman M. A., Brown C. M., Horwitz A. R., Mantulin W. W. & Gratton E. Paxillin dynamics measured during adhesion assembly and disassembly by correlation spectroscopy. Biophys J 94, 2819–2831 (2008). [DOI] [PMC free article] [PubMed] [Google Scholar]
- Sieg D. J. et al. FAK integrates growth-factor and integrin signals to promote cell migration. Nat Cell Biol 2, 249–256 (2000). [DOI] [PubMed] [Google Scholar]
- Raftopoulou M. & Hall A. Cell migration: Rho GTPases lead the way. Dev Biol 265, 23–32 (2004). [DOI] [PubMed] [Google Scholar]
- Brown M. C. & Turner C. E. Paxillin: adapting to change. Physiol Rev 84, 1315–1339 (2004). [DOI] [PubMed] [Google Scholar]
- Schaller M. D. Paxillin: a focal adhesion-associated adaptor protein. Oncogene 20, 6459–6472 (2001). [DOI] [PubMed] [Google Scholar]
Associated Data
This section collects any data citations, data availability statements, or supplementary materials included in this article.
Supplementary Materials
Supplementary Information
FAK in migrating cell
Paxillin in migrating cell
FAK(green)/Paxillin(red) in migrating cell
FAK at cell front
Paxillin at cell front
FAK(red)/Paxillin(red) at cell front
FAK(green)/Paxillin(red) at cell center
FAK(green)/Paxillin(red) at cell rear
FAK/Paxillin FI ratio (pseudo-color)
FAK(green)/Paxillin in migrating cell
FAK dynamics at cell leading edge
Paxillin dynamics at cell leading edge
FAK(green)/Paxillin(red) at cell leading edge
FAK/Paxillin FA ratio in a whole cell
FAK/Paxillin FI ratio at cell leading edge
FAK(green)/Actin(red) at cell leading edge
mCherry-FAK(red)/GFP-Paxillin(green) in migrating cell


