Abstract
As a typical mode of energy from waste, biogas technology is of great interest to researchers. To detect the trace H2S released from biogas, we herein demonstrate a high-performance sensor based on highly H2S-sensitive SnO2 nanocrystals, which have been selectively prepared by solvothermal methods using benzimidazole as a mineralization agent. The sensitivity of as-obtained SnO2 sensor towards 5 ppm H2S can reach up to 357. Such a technique based on SnO2 nanocrystals opens up a promising avenue for future practical applications in real-time monitoring a trace of H2S from the leakage of biogas.
Nowadays, energy and environmental problems have become two of the greatest challenges, which strongly influence the social manner and quality of people all over the world1,2,3. As a renewable energy source, biogas technology, which converts wastes into energy, has attracted great attention in many countries, and been well developed. Biogas mainly contains methane (CH4), together with a trace of other toxic gases, in which H2S is identified as the main toxic component4. Due to the high toxicity of H2S, it is extremely detrimental for human being to be exposed to H2S if the leaking of biogas happens. At present, 4 ppm is the maximum value of H2S, allowed by the fuel gas specifications for pipeline transportation. Although there are physical and chemical absorption as well as biological treatments of H2S for biogas purification, it is still difficult to completely remove H2S gas from biogas with low-cost methods5,6. To prevent potential risks of biogas leakage, it is necessary to realize real-time monitoring a trace amount of H2S gas (<5 ppm) released from biogas during production and transportation processes.
Gas sensors are of great interest due to their capability for a real-time analysis of gaseous chemicals in a wide range of applications7,8,9,10,11,12,13,14,15,16,17. Accordingly, different gas sensors have been readily applied in the biogas process18,19. However, there is no report on detecting H2S from biogas during its production and transportation processes. To detect a trace amount of H2S gas, it is a prerequisite that high-performance sensing material towards H2S gas should be available. It is well recognized that the sensing material is the core of gas sensors. Typically, tin oxide (SnO2) is a well-known gas-sensing material, which has been intensively studied with various shapes and morphologies for its detection towards various gases20,21,22,23,24,25,26,27,28,29,30,31. Meanwhile, numerous efforts have been exerted on the synthesis strategies of favorable SnO2 structures to detect H2S gas32,33,34,35,36,37,38,39,40. Especially, Lee and his co-workers developed a synthetic route to obtain the CuO-functionalized SnO2 nanowires with a response as high as 419 towards 20 ppm H2S35. Unfortunately, the sensor requires a temperature as high as 400°C to achieve a satisfied function. Therefore, it is necessary to develop highly H2S sensitive sensors based on novel materials with higher selectivity, lower-detection limit, and low-power consumption for monitoring the H2S gas from the leakage of biogas.
Herein, we report a solvothermal method for the preparation of high-performance SnO2 nanocrystals with benzimidazole as a mineralization agent. The sensor with SnO2 nanocrystals as the sensing material shows an ultrahigh sensitivity towards trace H2S gas, and a high selectivity to H2S in CH4. Moreover, structural characterizations and sensing mechanism analysis were undertaken to study the correlation between the sensor performance and the materials structure. It is expected that these as-prepared SnO2 nanocrystals are promising for a real-time monitoring of trace H2S during biogas production and transportation processes.
Results
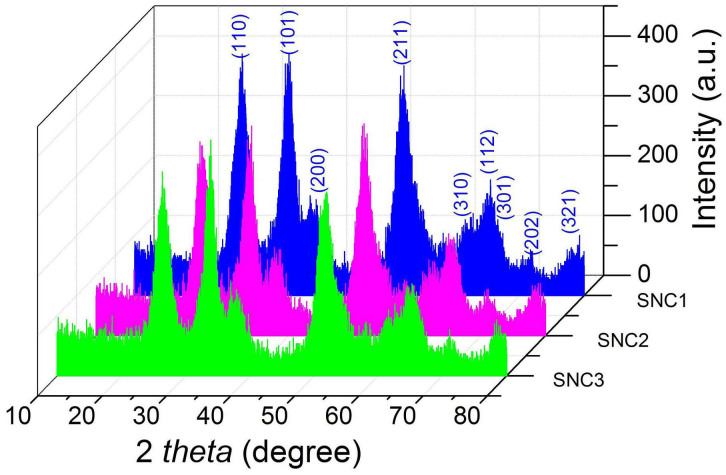
In this work, different shapes and morphologies of SnO2 nanocrystals could be easily obtained under solvothermal conditions with benzimidazole as a mineralization agent. The amount of benzimidazole plays crucial roles in determining the growth of SnO2 nanocrystals. When the amount of benzimidazole is 0.1, 0.3 and 0.6 g respectively, while other conditions kept the same, different SnO2 samples can be prepared accordingly SnO2 nanocrystals, denoted as SNC1; longer SnO2 nanocrystals, denoted as SNC2; SnO2 larger nanocrystals, denoted as SNC3). The phase of as-prepared SnO2 nanocrystals (SNC1, SNC2 and SNC3) was confirmed as pure tetragonal phase of SnO2 (JCPDS Card 41-1445) by X-ray diffraction (XRD) measurements, as shown in Figure 1.
Figure 1. XRD patterns of the SNC1, SNC2 and SNC3.
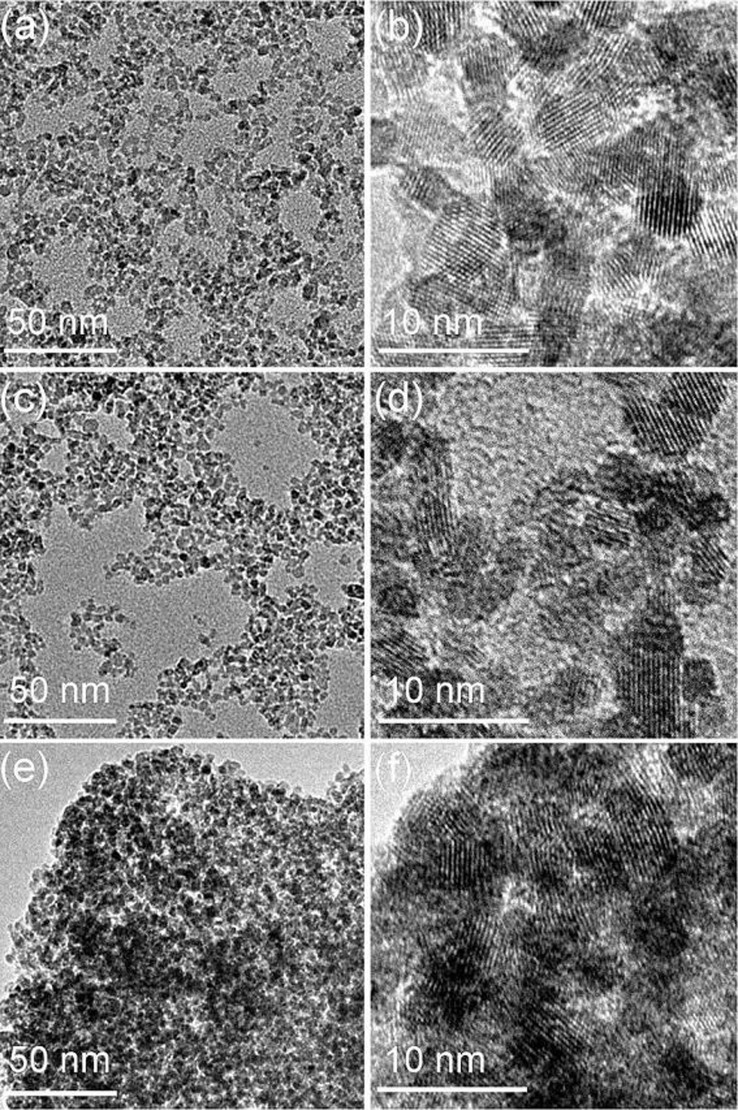
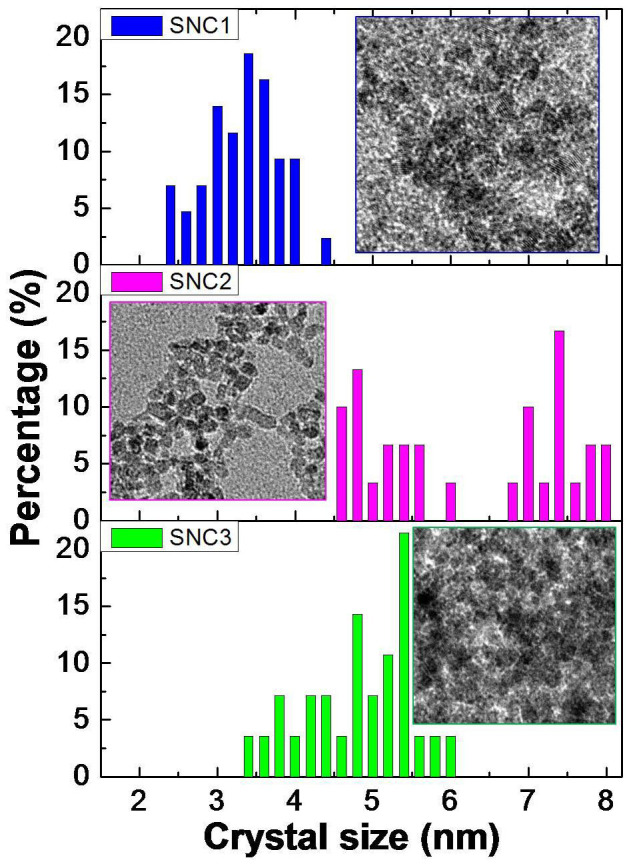
Transmission electron microscopy (TEM) was employed to further examine the representative morphologies and structures of as-prepared SnO2 nanocrystals. TEM image in Figure 2a shows that SNC1 exists as homogeneous nanocrystals. In the high-resolution TEM (HR-TEM) image (Figure 2b), it clearly shows that the size of SNC1 nanocrystals is about 3.4 ± 0.8 nm. The SNC2 has an average edge length of 7.4 ± 0.5 nm and width of 4.8 nm as shown in Figure 2d. Meanwhile, the SNC3 sample shows an average diameter of 5.2 ± 0.8 nm (Figure 2e and f). TEM gives us a direct proof that the present method is very effective for controlling the size and morphology of SnO2 nanocrystals. To support our given data, the size distribution for three SnO2 samples is also given in Figure 3. Similarly, the dynamic light scanning (DLS) characterization gave larger diameters (Figure S1) compared to the one from TEM images, which is probably due to the existence of hydrated layers around the particle surfaces and the aggregation of SnO2 nanocrystals as well. Moreover, we also found that only homogeneous SnO2 samples were obtained without the use of benzimidazole. No obvious difference has been observed when the ratios of water and ethanol were changed (Figure S4 and S5). Electron energy loss spectroscopy (EELS) was further used to characterize SCN1 (Figure S2). No other elements (C, N) originated from benzimidazole were detected on SCN1, which further proved the high purity of our samples. Here, the roles of benzimidazole should be included: directing the growth of inorganic nanocrystals41; aggregation effect or assembly due to its rich interactions (hydrogen bond, π-π stacking, and van der Waals interaction)42. Under these interactions, different shapes and morphologies of SnO2 nanocrystals could be obtained by adjusting the amount of benzimidazole used.
Figure 2. TEM images of (a and b) SNC1, (c and d) SNC2 and (e and f) SNC3.
Figure 3. The size statistics of SNC1, SNC2 and SNC3.
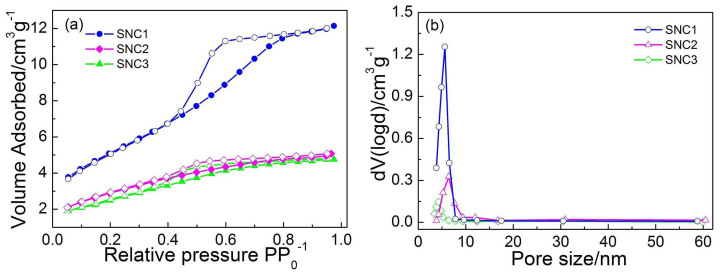
Nitrogen isotherm adsorption-desorption curves together with the pore size distributions of these as-synthesized SnO2 nanocrystals are given in Figure 4. In Figure 4a, SNC1 shows a typical type-IV isotherm with H2-type hysteresis loop43. Base on the Barrett-Joyner-Halenda (BJH) equation, the main pore size (Figure 4b) for SNC1 is determined as 3.8 nm, which further confirms a uniform pore size distribution. The BET specific surface area (SBET) for SNC1 is 223.6 m2·g−1. The higher SBET of the adsorption-desorption curve shows that SNC1 has the larger inter particle distanceand homogenized sizes. SNC2 and SNC3 exhibit a type IV isotherm with H2-type hysteresis loopas shown in Figure 4a. The high SBET of SNC2 (181.2 m2·g−1) shows the large interparticle distanceas revealed in Figure 2d. The smaller hysteresis loop and the SBET of SNC3 (109.7 m2·g−1) is probably a result of the severe aggregation in the sample. These results further indicate that it is effective to tailor the aggregated structure of SnO2 nanocrystalswith ahigh SBET by simply changing the amount of benzimidazole.
Figure 4.
(a) N2 isotherm adsorption-desorption curves and (b) the pore-size distribution of SNC1, SNC2 and SNC3.
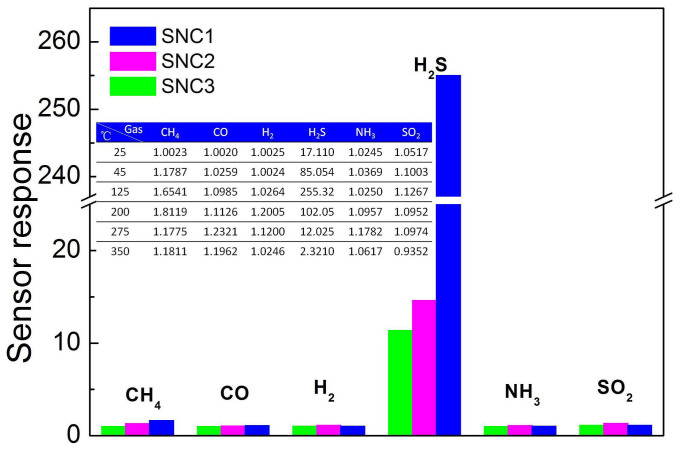
High SBET metal oxides have been demonstrated to be promising for gas sensing. Especially, a sensitive gas sensor with high selectivity for trace H2S is extremely important to detect the biogas. In this study, a comparison of the sensor response of SnO2 nanocrystals to 25 ppm of various gases at operating temperature of 125°C is shown in Figure 5 and S8. Notably, all the sensor response stowards different gases are all less than 2 orders of magnitude as compared to the signal from H2S. From the plot, it is clear that SCN1 shows not only enhanced sensitivity towards H2S but also a very high selectivity. The variation of sensitivity of SNC1 under different operating temperature towards 25 ppm of H2S is shown in the Table (the inset of Figure 5).It is clear that SNC1 has an obvious response to H2S gas between 45°C and 200°C, and excellent selectivity towards H2S gas. The excellent selectivity of SNC1 facilitates the application for detecting H2S.
Figure 5.
(a) Sensors responses to CO, H2, NH3, SO2, CH4, and H2S at 125°C and Sensors responses of SNC1 to various gases with different operating temperatures (the inset of Figure 5).
Figure 6 shows the response and recovery of SNC1 sensors upon exposure to 5 ppm H2S at 45, 125, 160 and 275°C, respectively. It is obvious that the sensor shows switch-like characteristics after an H2S exposure, and the response intensity is extremely high. At operating temperatures of 45°C and 125°C, the response times are about 120 and 224 s, respectively, while the recovery time is both several hours. Raising the operating temperature can immediately shorten both the recovery and response time. At 160°C, the response of the sensor is the most sensitive one (S = 320). Detecting H2S with a trace level (<5 ppm) at such a low temperature is very useful for real-time monitoring H2S gas released from biogas during production and transportation processes. The results are also excellent in comparison with previous results for tin oxide or modified tin oxide as gas sensor for H2S detection, as shown in Table 1.
Figure 6. Response and recovery characteristics of SNC1 sensors upon to 5 ppm H2S at 45, 125, 160 and 275°C, respectively.
Table 1. Comparison of gas-sensing characteristics of SnO2–based gas sensor.
| Materials | H2S Concentration (ppm) | Response S = Ra/Rg | Work Temperature (°C) | Ref. |
|---|---|---|---|---|
| SnO2 nanofibers | 4 | 23 | 300 | 28 |
| SnO2 nanocrystals | 20 | 27 | 150 | 32 |
| SnO2 thin films | 80 | 96 | 100 | 33 |
| SnO2 submicrotubes | 0.5 | 11.7 | 160 | 34 |
| Ag-SnO2 nanopowders | 50 | 55 | 332 | 35 |
| CuO doped SnO2 nanowires | 20 | 419 | 400 | 36 |
| Fe/SnO2 composite | 67.9 | 50 | 250 | 37 |
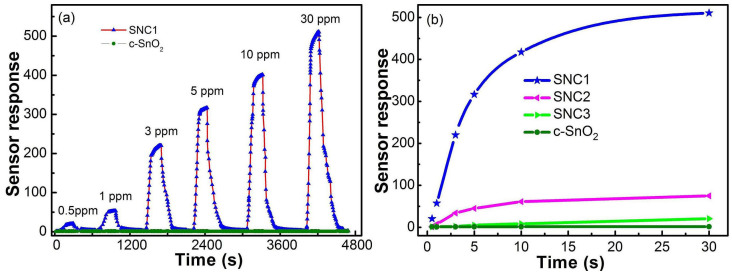
The typical response-recovery curves of the sensors made from the as-synthesized SNC1 and commercial SnO2 (c-SnO2) exposed to different concentrations of H2S ranging from 0.5 ppm to 30 ppm were shown in Figure 7a. Figure 7b displays the sensor response of different SnO2 nanocrystals towards various concentrations of H2S. The SNC1 sensor shows a much larger response magnitude to each concentration of H2S, compared with other SnO2 sensors. It is obvious that the sensor based on SNC1 is able to detect a wide range of H2S concentrations, with detection limit in the ppb level while the response towards 0.5 ppm of H2S is still as high as 20.4, indicating its excellent sensitivity and stability. However, the response for SNC3, c-SnO2 and SNCb (Figure S9) are extremely slow, probably due to their aggregated characteristicsand lower SBET (The characterization of c-SnO2 is shown in Figure S6 and S7). When H2S concentration is in range of 0.5–30 ppm, the logarithm of the sensor response shows a good linearity against the logarithm of the gas concentrationas shown in Figure S10, which is in agreement with the theory of the power laws for semiconductor sensors33.
Figure 7.
(a) Response and recovery characteristics of SNC1 and c-SnO2 sensors at different concentration of H2S at 160°C. (b) The sensor responses of SnO2 nanocrystals at different concentration of H2S at 160°C.
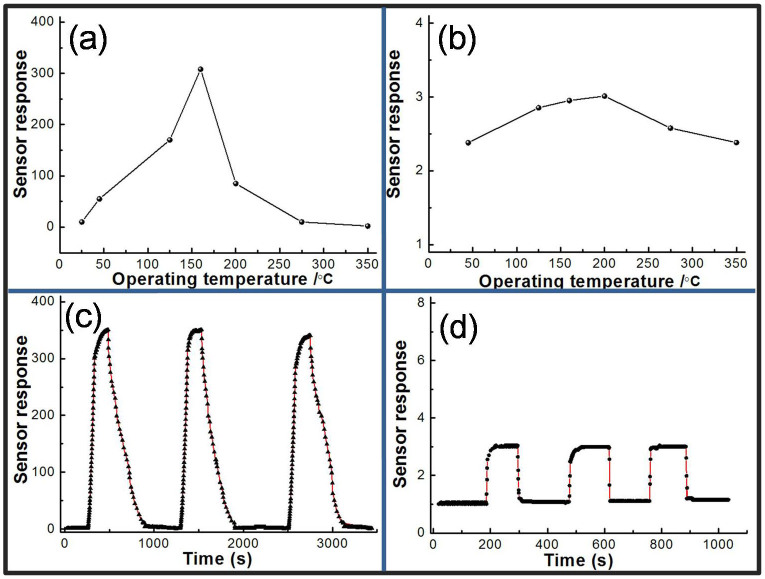
Figure 8a shows the sensor response of SNC1 at different working temperatures to 5 ppm H2S. The sensor response S increases and reaches its maximum at about 160°C and then decreases rapidly with the increase of temperatures. Figure 8b displays the sensor response of SNC1 at different working temperatures to 100 ppm CH4. The sensor response S is similar from 45°C to 350°C, and reaches its maximum of 3.0 at about 200°C. Figure 8c and d show a continuous measurement of 5 ppm H2S and 100 ppm CH4. The result indicates that the SNC1 sensor have good repeatability.
Figure 8.
(a) the response of SNC1 sensor to 5 ppm H2S at different working temperature; (b) the response of SNC1 sensor to 100 ppm CH4 at different working temperature; (c and d) the repeat of SNC1 sensor to detect H2S and CH4 at 160°C, respectively.
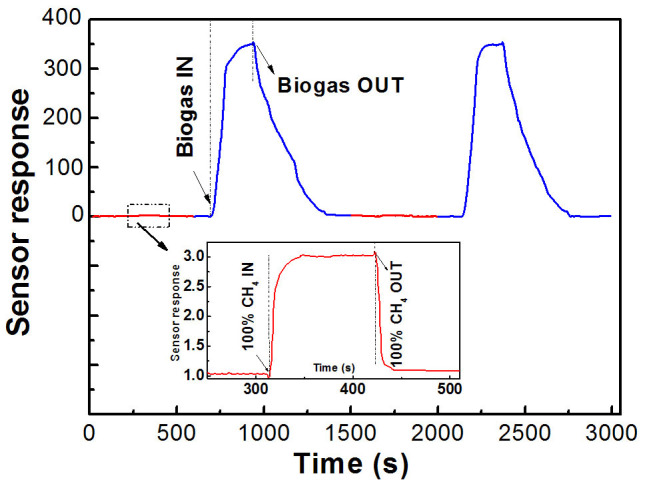
An alternate experiment is also carried out to detect the composite gases between biogas (5 ppm of H2S gas and 95 ppm of CH4) and 100 ppm pure CH4 at 160°C (Figure 9). Firstly, a low signal was observed at 3.1 after exposed to100 ppm of CH4. Then, the response increased sharply to 335 after encountering a composite biogas with 5% H2S. Similarly, we can also test the repeatability of our sensor performance by switching the working environment between pure CH4 and a composite biogas. It is clear that no obvious deterioration of the response can be observed during this experiments although there indeed exists a slightly drop after extended cycles. It can be concluded that SNC1 nanoparticles-based H2S sensor is promising for biogas composition monitoring.
Figure 9. A repeatedly alternate experiment to detect the composite gases between biogas (5 ppm of H2S gas and 95 ppm of CH4) and CH4 at 160°C.
Discussion
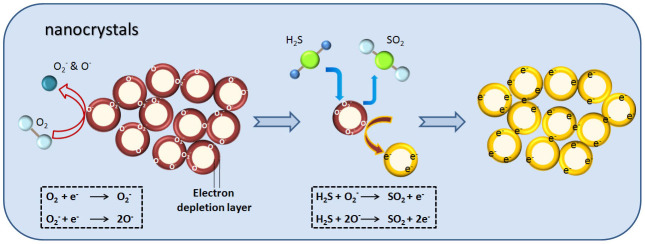
The change in the electrical resistance of a semiconductoris closely related to the chemical properties of the surface oxygen. Oxygen is adsorbed on SnO2 nanocrystal surface in different forms depending on the temperature, from physisorption (molecular form) to chemisorption (dissociative form) as temperature increase33,42. These oxygen adsorbates (O2−, O− and O2−) on the surface of n-type SnO2 induce an electron depletion layer, resulting in the decrease in carrier concentration and the increase in the surface potential barrier42,43,44,45,46. Upon exposures to reducing gases like H2S, the surface oxygen is consumed due to the chemical reaction.
 |
Then the electrons donate back to the surface of semiconductor, leading to the decreasein electrical resistance. Therefore, the concentration of surface oxygen depends on the concentration of the reducing gas as the same operating temperature. The chemical adsorption of oxygen and its reaction with reducing gases under lie the sensing mechanism of SnO2 nanocrystals32. It can be expressed by Eq.(1),
 |
Where PH2S is the concentration of H2S gas in air, the power law exponent m takes the value of 1, 0.5 or 0.25 respectively depending on the species of chemisorbed (ionosorbed) oxygen (O2−, O− and O2− correspondingly) and thus on the temperature. Comparing the value of m obtained from experiment results (m = 0.8) with that from theoretical analysis, that is
 |
This relation indicates that at 160°C, the oxygen chemical desorption on SnO2 nanocrystals surfaces might be dominated by O2− and O− simultaneously, which is in accordance to the TPD, FTIR and EPR studiesconducted on SnO2 surfaces47,48, indicating that the molecular form (O2−) dominates below 150°C, and above this temperature the ionic species dominate, predominately as O− below 400°C and O2− above 400°C, which is then directly incorporated into the lattice above 600°C.
The proportions of O2− and O− involved here can be calculated through the reaction Eqs.(2,3):
 |
 |
Where x and y are the proportions of O2− and O− respectively. And we obtain:
 |
Inserting the value of m into Eq. (4) leads to: x = 0.75, y = 0.25. Therefore, oxygen might be ionosorbed on SnO2 surfaces as O2− and O− with the proportion ratio of 3:1 at 160°C, which needs to be demonstrated by further spectroscopy study. The above discussion suggests that the power law exponent is characteristic of the surface reaction. It determines the dominating species of oxygen adsorbates and the proportion.
The height of energy barrier to electron transport between neighboring grains in the SnO2 is an important factor, which determines sensitivity of the material47. The temperature dependence of the conductivity of a semiconductorcan be approximated by the Arrheniusequation50:
 |
Where σ0 is a factor that includes the bulk in tragranular conductance, k the Boltzmann's constant, T the absolute temperature, and eVs the potential energy barrier at the interface between two neighboring particles.
 |
Where Nt is the surface density of adsorbed oxygen ions (O2− or O−), εrε0 is the permittivity of the semiconductor, and Nd is the volumetric density of the electron donors. Clearly, the energy barrier is a function of temperature and atmosphere (oxygen partial pressure), each of these parameters influences the energy barrier, conductivity, and thus the sensitivity. Further, eVs depends on the particle size, especially when the particle size is reduced to nanometer or in the order of the thickness of charge depletion layer (Xd). Different particle size corresponds to different ratio of Xd to the radius of the particles, provided that the absolute value of Xd is relatively independent of particle size49,51,52. If the particle size is much larger than the Xd, the band bending or aggregated is restricted to the surface region of the particle, as shown in Figure 10. When the particle size is nanometer, the properties of particles change dramatically due to solid-gas interactions. SNC1 is anticipated that both SBET and the size of particles can influence sensor response.
Figure 10. Schematic illustration of chemical reactions on SnO2 nanocrystals surface underlying H2S sensor mechanism.
In summary, we have successfully obtained a high-performance SnO2 sensor for detecting trace H2S from the biogas. By means of a control over the size and morphology of SnO2 nanocrystals, the sensor performance can be accordingly tuned due to the difference in the SBET of the sensor materials. The mechanism of gas sensing towards H2S has been discussed in detail. The sensor built on the as-prepared SNC1 shows promising sensing properties towards a real time monitoring of trace H2S from the leakage of biogas.
Methods
Hydrothermal synthesis of SnO2 nanocrystals
In a typical synthesis, 0.35 g of SnCl4·5H2O and 0.1 g of benzimidazole were first dissolved into mixed solution with 20 ml of distilled H2O and 20 mL of ethanol, and then transferred into a 50 mL Teflon-lined stainless-steel autoclave at 180°C for 20 h. Finally, the obtained white sample was rinsed with deionized water and ethanol for several times, and dried in ambient conditions. In order to investigate the effect of benzimidazole on the morphology of final products, a series of controlled experiments were also conducted, and the amount ofbenzimidazole is 0.3 and 0.6 g, respectively.
Characterization
The morphology and structural characteristics were observed using X-ray diffraction (XRD, Rigaku D/max 2500 diffractometer), high-resolution transmission electron microscopy (HRTEM, JEOL 2010) equipped with and electron energy loss spectroscopy (EELS), and nitrogen adsorption–desorption isotherms (ASAP 2020 nitrogen adsorption apparatus). The Brunauer–Emmett–Teller (BET) specific surface areas (SBET) were calculated using the BET equation. Desorption isotherm was used to determine the pore size distribution using the Barret–Joyner–Halender (BJH) method. Particle size range was estimated using a dynamic light scattering (DLS) device (Malvern Zetasizer Nano ZS90).
Sensor measurements
The fabrication and testing principles of the gas sensor aresimilar to that described in our previous reports. Firstly, the SnO2 samples were mixed with terpineol to form a paste andthen coated onto the outside surface of an alumina tube witha diameter of 1 mm and a length of 5 mm. A platinum coil through the tube was employed as a heater to control the operating temperature. To improve their stability and repeatability, the gas sensors were aged at 300°C for 10 days in air. Here, thesensing properties of the sensors were measured by a NS-4003 series gas-sensing measurement system (China Zhong-KeMicro-nano IOT, Internet of Things, Ltd.). The relative humidity (RH)is about 45%. The response and recovery times were defined asthe time required for a change of the resistance to reach 90% ofthe equilibrium value after injecting and that for removing thedetected gas, respectively. When air and ppm-level target gas were flowed through the sensor element, the corresponding steady-state resistances of the sensor in air (Rair) and in the air–gas mixture (Rgas) were recorded, respectively. The sensor response (S) for oxidizing gas (NO or NO2) is defined as the ratio of Rgas/Rair, while the response for reducing gas (H2S, H2, CO or CH4) is defined as the ratio of Rair/Rgas.
Author Contributions
J.M.M. proposed and designed the experiments. L.M. carried out thesynthetic experiments and conducted the characterization. L.M. performed the HRTEM, SEM characterization and structural analysis. L.M. analyzed the data. Y.J.C. and L.M. prepared the gas sensors. L.M. and J.M.M. wrote the manuscript. All the authorsparticipated in discussions of the research.
Supplementary Material
supplementary information
Acknowledgments
This work was supported by the National Natural Science Foundation of China (Grant No. 51302079) and the Young Teachers' Growth Plan of Hunan University (Grant No. 2012-118).
References
- Hightower M. & Pierce S. A. The energy challenge. Nature 452, 285–286 (2008). [DOI] [PubMed] [Google Scholar]
- Jacobson M. Z. Review of solutions to global warming, air pollution, and energy security. Energy Environ. Sci. 2, 148–173 (2009). [Google Scholar]
- Mei L. et al. Hierarchicalmushroom-likeCoNi2S4 arraysas a novel electrode material lfo rsupercapacitors. Nano Energy 3, 36–45 (2014). [Google Scholar]
- Cantrell K. B. et al. Livestock waste-to-bioenergy generation opportunities. Bioresour. Technol. 99, 7941–7953 (2008). [DOI] [PubMed] [Google Scholar]
- Belmabkhout Y. Simultaneous adsorption of H2S and CO2 on triamine-grafted pore-expanded mesoporous MCM-41 silica. Energy Fuels 25, 1310–1315 (2011). [Google Scholar]
- Nishimura S. & Yoda M. Removal of hydrogen sulfide from an anaerobic biogas using a bio-scrubber. Water Sci. Technol. 36, 349–356 (1997). [Google Scholar]
- Ma J. M. et al. Topochemicalpreparation of WO3 nanoplates through precursor H2WO4 and their gas-sensing performances. J. Phys. Chem. C 115, 18157–18163 (2011). [Google Scholar]
- Ma J. M. et al. Porous platelike hematite mesocrystals: synthesis, catalytic and gas-sensing applications. J. Mater. Chem. 22, 11694–11700 (2012). [Google Scholar]
- Zhang J. et al. Reactive-template fabrication of porous SnO2 nanotubes and their remarkable gas-sensing performance. ACS Appl. Mater. Interfaces 5, 7893–7898 (2013). [DOI] [PubMed] [Google Scholar]
- Lai X. Y. et al. General synthesis and gas-sensing properties of multiple-shell metal oxide hollow microspheres. Angew. Chem. Int. Ed. 123, 2790–2793 (2011). [DOI] [PubMed] [Google Scholar]
- Cui S. M. et al. Fast and selective room-temperature NH3 sensors using silver nanocrystals-functionalized carbon nanotubes. ACS Appl. Mater. Interfaces 4, 4898–4904 (2012). [DOI] [PubMed] [Google Scholar]
- Mao S. et al. Tuning gas-sensing properties of reduced grapheneoxide using tin oxide nanocrystals. J. Mater. Chem. 22, 11009–11013 (2012). [Google Scholar]
- Cadena-Pereda R. O. et al. Automatic carbon dioxide-methane gas sensor based on the solubility of gases in water. Sensors 12, 10742–10758 (2012). [DOI] [PMC free article] [PubMed] [Google Scholar]
- Nordberg A. et al. Monitoring of a biogas process using electronic gas sensors and near-infrared spectroscopy (NIR). Water Sci. Technol. 41, 1–8 (2000). [PubMed] [Google Scholar]
- Li F. et al. Fe3+ facilitating the response of NiO towards H2S. RSC Adv. 4, 14201–14205 (2014). [Google Scholar]
- Bao M. et al. Plate-like p–n heterogeneous NiO/WO3 nanocomposites for high performance room temperature NO2 sensors. Nanoscale 6, 4063–4066 (2014). [DOI] [PubMed] [Google Scholar]
- Tang Y. J. et al. In2O3 nanostructures: synthesis & chlorobenzene sensitive properties. RSC Adv. 2014, 10.1039/C3RA46554C. [Google Scholar]
- Kuang Q. et al. Enhancing the photon- and gas-sensing properties of a single SnO2 nanowire based nanodevice by nanoparticle surface functionalization. J. Phys. Chem. C 112, 11539–11544 (2008). [Google Scholar]
- Xu X. X. et al. SnO2 quantum dots and quantum wires: controllable synthesis, self-assembled 2D architectures, and gas-sensing properties. J. Am. Chem. Soc. 130, 12527–12535 (2008). [DOI] [PubMed] [Google Scholar]
- Wang Y. L. et al. A solution-phase, precursor route to polycrystalline SnO2 nanowires that can be used for gas sensing under ambient conditions. J. Am. Chem. Soc. 125, 16176–16177 (2003). [DOI] [PubMed] [Google Scholar]
- Ge J. P. et al. High ethanol sensitive SnO2 microspheres. Sens. Actuators B: Chem. 113, 937–943 (2006). [Google Scholar]
- Huang J. et al. Nanotubular SnO2 templated by cellulose fibers: synthesis and gas sensing. Chem. Mater. 17, 3513–3518 (2005). [Google Scholar]
- Ma J. M. et al. Superior gas-sensing and lithium-storage performance SnO2 nanocrystals synthesized by hydrothermal method. CrystEngComm 13, 6077–6081 (2011). [Google Scholar]
- Chiu H. C. & Yeh C. S. Hydrothermal synthesis of SnO2 nanoparticles and their gas-sensing of alcohol. J. Phys. Chem. C 111, 7256–7259 (2007). [Google Scholar]
- Liu Y. et al. A highly sensitive and fast-responding SnO2 sensor fabricated by combustion chemical vapor deposition. Chem. Mater. 17, 3997–4000 (2005). [Google Scholar]
- Wagner T. et al. Gas sensing properties of ordered mesoporous SnO2. Sensors 6, 318–323 (2006). [Google Scholar]
- Dong K. Y. et al. Enhanced H2S sensing characteristics of Pt doped SnO2 nanofibers sensors with micro heater. Sens. Actuators B: Chem. 157, 154–161 (2011). [Google Scholar]
- Liu H. et al. Properties and mechanism study of SnO2 nanocrystals for H2S thick-film sensors. Sens. Actuators B: Chem. 140, 190–195 (2009). [Google Scholar]
- Wang L. et al. Hierarchical SnO2 nanospheres: bio-inspired mineralization, vulcanization, oxidation techniques, and the application for NO sensors. Sci. Rep. 3, 3500 (2013). [DOI] [PMC free article] [PubMed] [Google Scholar]
- Lv T. et al. Hydrothermally processed SnO2 nanocrystals for ultrasensitive NO sensors. RSC Adv. 4, 22487–22490 (2014). [Google Scholar]
- Li F. et al. Porous SnO2 nanoplates for highly sensitive NO detection. J. Mater. Chem. A 2, 7175–7178 (2014). [Google Scholar]
- Patil G. E. et al. Synthesis, characterization and gas sensing performance of SnO2 thin films prepared by spray pyrolysis. Bull. Mater. Sci. 34, 1–9 (2011). [Google Scholar]
- Mu J. et al. H2S sensing properties of the flowerlike clusters of SnO2 submicrotubes. Sens. Lett. 7, 105–109 (2009). [Google Scholar]
- Li C. et al. The enhanced H2S sensing behavior of Ag-doped porous SnO2 nanopowdersprepared by template method. Adv. Mater. Res. 295–297, 337–340 (2011). [Google Scholar]
- Hwang I. S. et al. Enhanced H2S sensing characteristics of SnO2 nanowires functionalized with CuO. Sens. Actuators B: Chem. 142, 105–110 (2009). [Google Scholar]
- Sun H. et al. Fe/SnO2 composite sensors prepared from oxalate precursors for the detection of H2S. J. Disp. Sci. Technol. 31, 124–128 (2010). [Google Scholar]
- Ma J. M. et al. Sb2S3 with various nanostructures: controllable synthesis, formation mechanism, and electrochemical performance toward lithium storage. Chem. Eur. J. 16, 13210–13217 (2010). [DOI] [PubMed] [Google Scholar]
- Ma J. M. et al. One-dimensional Sb2Se3 nanostructures: solvothermal synthesis, growth mechanism, optical and electrochemical properties. CrystEngComm 13, 2369–2374 (2011). [Google Scholar]
- Kong X. H. & Wang T. H. High sensitivity of CuO modified SnO2 nanoribbonsto H2S at room temperature. Sens. Actuators B: Chem. 105, 449–453 (2005). [Google Scholar]
- Xue X. Y. et al. Synthesis and H2S Sensing Properties of CuO-SnO2 Core/Shell PN-Junction Nanorods. Sens. Actuators B: Chem. 112, 12157–12160 (2008). [Google Scholar]
- Kim T. K. et al. Nanoporous metal oxides with tunable and nanocrystalline frameworks via conversion of metal−organic frameworks. J. Am. Chem. Soc. 135, 8940–8946 (2013). [DOI] [PubMed] [Google Scholar]
- Xue X. Y. et al. Onestep synthesis and gas-sensing characteristics of uniformly loaded Pt@SnO2 nanorods. J. Phys. Chem. C 114, 3968–3972 (2010). [Google Scholar]
- Wan Q. et al. Fabrication and ethanol sensing characteristics of ZnO nanowire gas sensors. Appl. Phys. Lett. 84, 3654–3656 (2004). [Google Scholar]
- Paulose M. et al. Unprecedented ultra-high hydrogen gas sensitivity in undopedtitania nanotubes. Nanotechnology 17, 398–402 (2006). [Google Scholar]
- Chang S. C. Oxygen chemisorption on tin oxide: correlation between electrical conductivity and EPR measurements. J. Vac. Sci. Technol. 19, 366–369 (1980). [Google Scholar]
- Barsan N. & Weimar U. Conduction model of metal oxide gas sensors. J. Electroceram. 7, 143–167 (2001). [Google Scholar]
- Zhang G. & Liu M. L. Effect of particle size and dopant on properties of SnO-based gas sensors. Sens. Actuators B: Chem. 69, 144–152 (2000). [Google Scholar]
- Lantto V. et al. A study of the temperature dependence of the barrier energy in porous tin dioxide. Sens. Actuators 14, 149–163 (1988). [Google Scholar]
- Yin X. M. et al. SnO2 monolayer porous hollow spheres as a gas sensor. Nanotechnology 20, 455503 (2009). [DOI] [PubMed] [Google Scholar]
- Mei L. et al. Ultrasensitive ethanol sensor based on 3D aloe-like SnO2. Sens. Actuators B: Chem. 166–167, 7–11 (2012). [Google Scholar]
- Ma J. M. et al. α-Fe2O3 nanochains: ammonium acetate-based ionothermal synthesis and ultrasensitive sensors for low-ppm-level H2S gas. Nanoscale 5, 895–898 (2013). [DOI] [PubMed] [Google Scholar]
- Deng J. W. et al. Porous α-Fe2O3 nanosphere-based H2S sensor with fast response, high selectivity and enhanced sensitivity. J. Mater. Chem. A 1, 12400–12403 (2013). [Google Scholar]
Associated Data
This section collects any data citations, data availability statements, or supplementary materials included in this article.
Supplementary Materials
supplementary information


