

Abstract
T follicular helper (TFH) cells are critical for B cell activation in germinal centers and are often observed in human inflamed tissue. However, it is difficult to know if they contribute in situ to inflammation. Expressed markers define TFH subsets associated with distinct functions in vitro. However, such markers may not reflect in situ function. The delivery of T cell help to B cells requires direct cognate recognition. We hypothesized that by visualizing and quantifying such interactions we could directly assess TFH cell competency in situ. Therefore, we developed computational tools to quantify spatial relationships between different cell subtypes in tissue (Cell Distance Mapping, CDM). Analysis of inflamed human tissues indicated that measurement of internuclear distances between TFH and B cells could be used to discriminate between cognate and non-cognate interactions. Furthermore, only cognate-competent TFH cell populations expressed high levels of Bcl-6 and IL-21. These data suggest that CDM can be used to identify adaptive immune cell networks driving in situ inflammation. Such knowledge should help identify diseases, and disease subsets, that may benefit from therapeutics targeting of specific T cell:antigen presenting cell interactions.
Keywords: Lupus, nephritis, renal transplant, cell distance mapping, adaptive autoimmunity, T follicular helper cell
Introduction
Central to adaptive immunity is the linked recognition of antigen by T cells and antigen presenting cells (APCs) through direct cell-to-cell contact. Linked recognition underlies most adaptive immune responses that both protect from infection and that drive tissue damage in autoimmunity (1). The interplay between T cells and APCs has been best studied in murine models in which intravital two-photon excitation microscopy (TPEM) has provided a dynamic and quantitative picture of how various cells of the immune system cooperate to evoke a coordinated immune response in secondary lymphoid organs (2, 3). In particular, direct visualization has revealed how specialized CD4+ T cells within the germinal center (GC), termed T follicular helper (TFH) cells, provide cognate help to co-resident B cells (4, 5). While TPEM provides a paradigm for how human adaptive immune responses might proceed, it cannot be used to directly study immunity in humans.
In comparison to TPEM, the techniques usually applied to the study of human tissue are largely qualitative. Conventional histology can be used to describe tissue morphology, and immunohistochemistry can be used to assess the relative frequencies of individual cell types. However, unlike TPEM, these techniques cannot be used to understand and quantify the spatial or functional relationships between different T cell and APC populations. Functional relationships are often inferred from ex vivo studies of similar peripheral cell populations (6). However, these studies can only demonstrate that the selected populations of APCs and T cells can respond to antigen under certain experimental conditions. They do not necessarily predict if they do so in inflamed tissue at the site of organ destruction.
One example of these limitations (7) is provided by human lupus nephritis (LuN). LuN patients with a poor prognosis (8-10) have severe tubulointerstitial inflammation (TII) characterized by in situ, antigen-driven clonal expansion of B cells (11). B cell activation usually requires second signals that can be provided by TFH cells (12). Although functional TFH cell subtypes can be found in the peripheral blood (6), and the presence of peripheral TFH-like cells correlates with lupus disease severity (13), it is not known if TFH cells are a common histological feature of LuN. Furthermore, if they are, no methods exist to determine if they commonly provide help to co-resident B cells in situ.
To address these limitations, and to understand the function of TFH cells in human inflammation, we developed computational tools that, when applied to multichannel confocal images of human tissue, allowed rapid and unbiased identification of cell subsets, and permitted assessment of the relationships between different cell types (Cell Distance Mapping, CDM). Remarkably, using CDM we could reliably identify TFH populations competent to form supramolecular activation complexes (SMACs) with B cells and with the transcriptional profiles of fully differentiated TFH cells engaged in providing cognate help (12,14). These data suggest that quantitative assessment of the relationships between B cells and TFH cells in situ can reveal when local T cell-dependent adaptive immune responses are contributing to inflammation. More broadly, defining the adaptive cell networks underling inflammation should lead to a more mechanistic classification of several apparently heterogeneous diseases such as SLE. This would both enhance our understanding of disease pathogenesis and suggest disease-specific therapeutic opportunities.
Results
TFH cells are frequently observed in inflammatory renal disease
We asked if cells resembling TFH cells were a feature of LuN (11) and other renal diseases characterized by TII. First, sequential histological sections from LuN biopsies (patient demographics shown in Table S1) were stained with CD4, ICOS, and CXCR4 (12, 15, 16). As illustrated in Fig. 1a, clusters of cells expressing these TFH markers were readily apparent. To examine the co-occurrence of TFH markers on individual cells, we stained fresh frozen LuN sections with antibodies specific for CD4, PD1, and ICOS, followed by appropriate fluorochrome-conjugated secondary antibodies. Samples were also stained with DAPI to identify cell nuclei, and were visualized using confocal laser scanning microscopy (CLSM). As illustrated in Fig. 1b, CD4+ICOS+PD1+ T cells could be clearly identified in the tubulointerstitium (average of 15.6 cells/digital high-power field [dHPF] - equivalent to approximately 138 μm2), and were present in 45% (19/42) of patient samples (Fig. 1c). These cells occurred in the absence of histologically apparent GCs, and were not detectable in glomeruli (Fig. S1). These observations indicate that TFH-like (CD4+ICOS+PD-1+) cells are a frequent feature of LuN. The presence of TFH cells in renal biopsies was associated with more severe TII (Fig. 1d), elevated serum creatinine, and decreased estimated glomerular filtration rate (Fig. 1e) (8-10).
Fig. 1. TFH-like cells are a common feature of human tubulointerstitial inflammation.

(a) Single-color immunohistochemistry staining for CD4, ICOS, and CXCR4 performed on serial sections of human lupus nephritis tissue (scale bar: 20 μm). (b) Multichannel confocal immunofluorescent staining of human lupus nephritis tissue for CD4, ICOS, PD-1, and DAPI with composite multiplexed images (scale bar: 20μm). (c) Prevalence of lupus nephritis and renal transplant T cell mediated (TCMR) or mixed cellular (MR) rejection biopsies with at least one ICOS-positive cell per high-power field (HPF) as assessed by qualitative immunofluorescent staining. (d) Comparison of mean tubulointerstitial (TI) inflammation grade between ICOS-positive and ICOS-negative SLE cases as scored by a blinded pathologist [AC]. Error bars denote SEM. *P = 0.04 based on unpaired t-test. (e) Comparison of clinical characteristics between ICOS-positive (n=19) and ICOS-negative (n=23) SLE cases (Mann-Whitney). GFR was calculated for adult patients by utilizing the Modification of Diet in Renal Disease equation and adjusting for patient sex. Patients who were under 18 years of age, had acute renal failure, or were on renal replacement therapy at the time of biopsy were excluded from the analysis.
TFH-like cells were also evident in biopsies of renal allografts: 64% of cases manifesting T cell-mediated rejection (TCMR), and 50% of cases manifesting both TCMR and antibody-mediated rejection, which we termed mixed cellular rejection (MR)(Fig. 1c) (17, 18). Furthermore, the frequencies of TFH-like cells per high-power field were similar (14.0 vs 12.5 cells/dHPF, respectively) in each type of rejection. While MR is associated with local antibody deposition and complement activation similar to LuN, TCMR is not (17). These observations suggest that the TFH-like populations in LuN, MR, and TCMR might differ in their abilities to provide T cell help in situ.
Close approximation of TFH and B cells in situ in lupus nephritis
In GCs, TFH cells provide critical survival and proliferative signals through direct B cell contact (2, 3, 5, 19, 20). Therefore, we began to examine the spatial relationships between TFH and B cells in LuN compared to human tonsil GCs. Fresh frozen samples were stained as described above for CD4, ICOS, CD20, and DAPI, and visualized by CLSM. As can be seen in Fig. 2a, TFH cells were relatively evenly distributed throughout GC light zones and were uniformly surrounded by CD20+ B cells. Furthermore, as noted in Fig. 2b, several B cells appeared to be intimately associated with a neighboring TFH cell but not other B cells.
Fig. 2. TFH-like cells in tonsil germinal centers and in lupus nephritis tubulointerstitial inflammatory infiltrates closely approximate B cells.
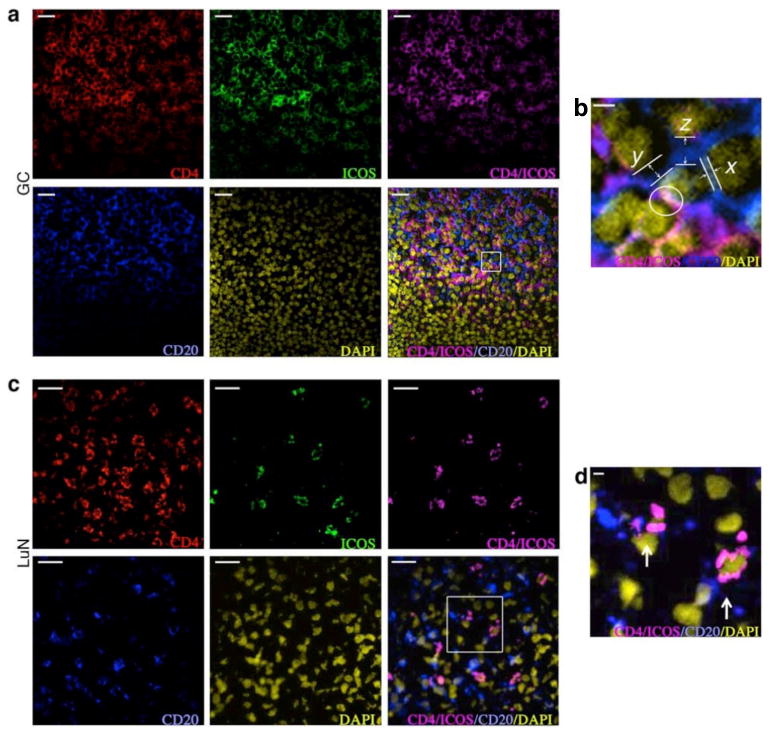
Confocal multichannel immunofluorescent staining of tonsil germinal center (a) and human lupus nephritis tissue (c) for CD4, ICOS, CD20, and DAPI with composite multiplexed images. Scale bars: 20 μm. (b and d) Enlargement of areas delineated by white borders. Example of distances between a TFH cell (center) and neighboring B cells with zero distance measurement (white circle), 0.5 μm (x), 1.5 μm (y), and 2.5 μm (z) are illustrated in (b). Close opposition and interdigitation of membrane processes between TFH and B cells seen within lupus nephritis tissue is shown in (d). Scale bars: 2 μm.
In LuN, a similar overall pattern of cell distributions, albeit at lower cell densities, was observed (15.6 vs 53.9 cells/dHPF). TFH-like cells were diffusely distributed throughout the tubulointerstitium usually in close proximity to one or more CD20+ B cells (Fig. 2c). Higher magnification (Fig. 2d) indicated that some B cells and TFH cells formed close and extensive membrane contact surfaces.
Quantifying cell:cell interactions
While representative images suggested that TFH cells in LuN commonly interacted with B cells, there are no currently available methods to objectively quantify the frequency and quality of these apparent relationships. Therefore, we developed computer visualization techniques, derived from those used to assess digital mammograms and magnetic resonance images (21-23), to analyze CLSM images of human tissue. First, original raw output images (Fig. 3a, top row) from each channel were captured, and these dHPFs were processed as described (Materials and Methods) to obtain binary maps for the outputs from both DAPI and each fluorescent channel representing specific cell surface stains (Fig. 3a, bottom row)(24, 25).
Fig. 3. Development of a computational tool (Cell Distance Mapping) to quantitate cell:cell distance relationships.
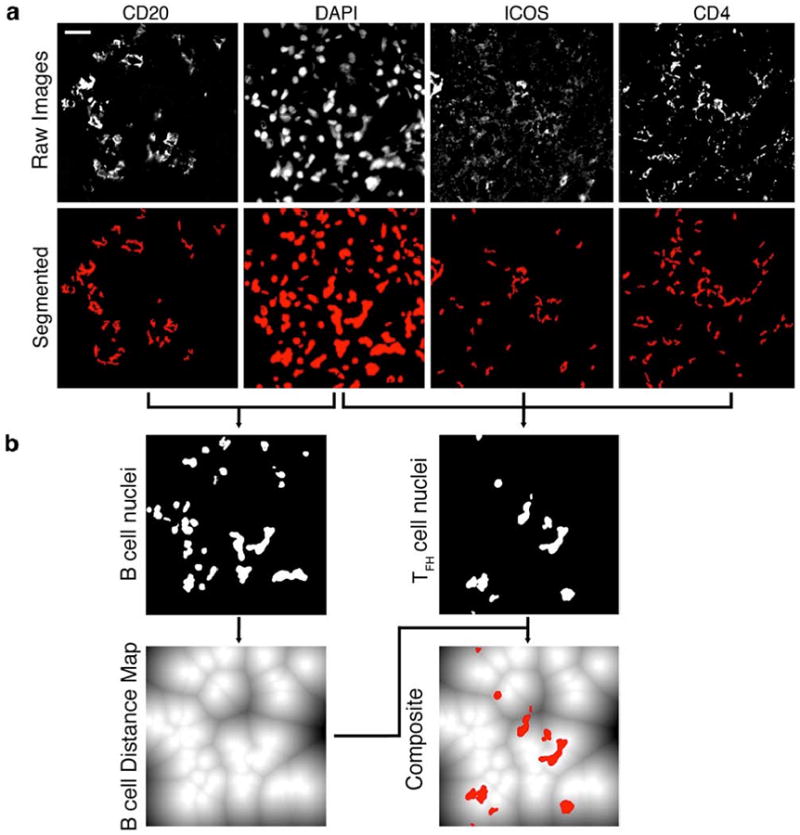
(a) Top row: unaltered raw images, representing input, obtained from multicolor confocal immunofluorescent microscopy of samples stained for CD20, DAPI, ICOS, and CD4. Bottom row: Interim stain signatures obtained after applying automated algorithms to generate binary masks for each stain. (b) Specific cell nuclei were identified and assigned based on associated membrane staining. CD20 was used to identify B cell nuclei (graphically depicted in the top row, left panel). The combination of CD4 and ICOS staining was used to identify TFH nuclei (illustrated in the top row, right panel).The B cell nuclei were then converted to a distance map (lower row, left panel), which is a graphical representation of distance from the periphery of each nucleus (illustrated in solid white) to a maximum distance 255 pixels away (illustrated in solid black). Lines represent equidistant boundaries between two (or more) nuclei. To calculate cell distance relationships, the TFH nuclear signatures were then transposed onto the B cell distance map to obtain a composite image (lower row, right panel). After establishing the exact coordinates for each cell the computerized algorithm was able to produce distance relationships for every homo- and hetero-conjugate contained in the digital high-power field (dHPF). Scale bar: 20 μm.
As illustrated in Fig. 3a, lymphocyte membrane staining in tissue was complex, likely reflecting the irregular shapes that these cells acquire as they migrate through dense organ structures. This made it difficult to definitively identify the membranous boundaries of individual cells. In contrast, DAPI staining (Fig. 3a, bottom row, second panel from left) usually revealed the complete border of each nucleus and, thus, its precise location. Therefore, we used membrane staining in combination with its respective DAPI correlate to definitively assign nuclei to specific cell types (final images of identified nuclei in Fig. 3b, top row).
All B cell nuclei were then used to construct a distance map in which each pixel value represented the Euclidean distance from the pixel to the closest B cell nucleus edge (Fig. 3b, lower left panel). T cell nuclei were then overlaid (Fig. 3b, lower right panel - T cell nuclei indicated in red). Thus, we were able to accurately compute minimum distances between the edges of each B cell nucleus to the edge of the closest T cell nucleus in pixel increments. We refer to this series of analyses and transformations as Cell Distance Mapping (CDM).
Cell distance mapping identifies TFH:B cell conjugates
We employed CDM to quantitatively assess the distance relationships and distributions of TFH and B cell nuclei in tonsil GCs, LuN, MR, and TCMR cases. The number of tissue samples analyzed and the total number of measurements obtained from our database are provided in Supplemental Table 2. For each sample, we calculated the closest minimal distance between TFH–like cell nuclei (CD4+ICOS+ or CD4+PD-1+) and CD20+ B cell nuclei (heterotypic proximity) or inter-TFH cell or B cell distances (homotypic proximity). These results were plotted as the fraction (%) of all interactions that occurred at a specific distance (Fig. 4a, c, e, g, i, k) and as the cumulative frequency of cell interactions as a function of distance (Fig. 4b, d, f, h, j, l). The indicated distance (x-axis) is discontinuous with values of 1 μm and below divided into 0.27 μm increments, which are equivalent to 1 pixel each.
Fig. 4. Cell Distance Mapping reveals apparent TFH:B cell cognate pairs.
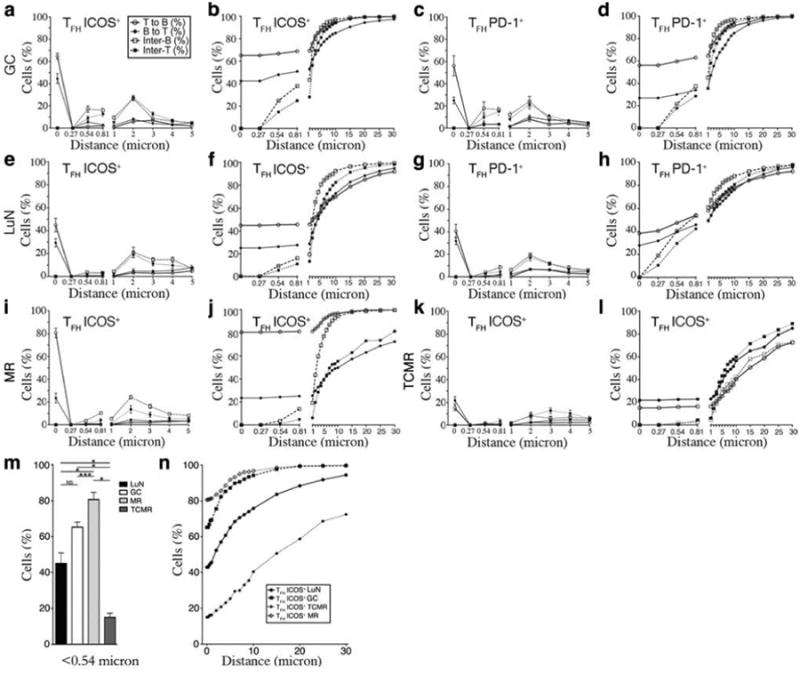
Frequency of cell:cell interactions at each distance (a,c,e,g,i,k) and cumulative (b,d,f,h,j,l) frequency as a function of distance for human tonsil germinal centers (GC) (a-d), lupus nephritis (LuN) (e-h), mixed cellular renal allograft rejection (MR) (i,j), and T cell-mediated renal allograft rejection (TCMR) (k,l) cases. Illustrated are the minimal distances from ICOS+ T follicular helper (TFH) (a,b,e,f,i-l) or PD-1+ TFH (c,d,g,h) cells to the nearest CD20+ B cell (open circle), from a B cell to the nearest T helper cell (closed circle), and the inter-B (open square) and inter-T (closed square) cell distances, averaged across each stain combination and tissue type. Distance is non-linear; distances below 1 μm are depicted in 1pixel increments, corresponding to 0.27 μm. Numbers of measured interactions are given in Supplemental Table 1. (m) Comparison of mean fraction (%) of ICOS+ TFH cells within 0.54 μm of a CD20+ B cell in LuN (black bars), GC (white bars), MR (light gray bars), and TCMR (dark gray bars). Error bars denote SEM. *P<0.0001, **P=0.002, ***P=0.02 based on unpaired t-test. (n) Mean cumulative distance distribution between ICOS+ TFH cells and CD20+ B cells in GC (closed square), LuN (closed circle), MR (open diamond), and TCMR (closed diamond).
Analysis of the tonsil GC data-set revealed that essentially no B cell nucleus (cell) was less than 0.54 μm from another B cell and no TFH cell was less than 0.54 μm from another TFH cell. However, the majority of cells were within 10 μm of the nearest neighboring cell consistent with the dense cellular packing characteristic of GC light zones (3). Remarkably, 42% of B cells were within 0.54 μm of an ICOS+ TFH, and 65% of TFH cells were within 0.54 μm of a B cell. The cumulative frequency of heterotypical inter-cell relationships were not appreciably different up to 2 μm, but then rapidly increased in a manner similar to homotypic distances (Fig. 4, a-d). Similar patterns of proximity were observed with both ICOS+ and PD-1+ TFH cells. The higher rate of T to B conjugates versus B to T conjugates reflected the generally higher frequency of B cells in GC as compared to TFH cells (B:T cell ratio of 1.75). Likewise, the more rapid rise in cumulative frequency beyond 2 μm for nearest neighbor B cell to B cell distances reflected their higher prevalence in GC. The fact that distances of less than 0.54 μm were observed only between TFH and B cells in GC suggests that such close proximity might identify cognate, or antigen-specific, cell:cell interactions.
Remarkably, a similar pattern of inter-cell relationships was observed in LuN (Fig. 4, e-h). Essentially no homotypic proximities were observed below 0.54 μm, while 22% of B cells were within 0.54 μm of a TFH cell and 42% of TFH cells were within 0.54 μm of a B cell. At distances beyond 2 μm, both homotypic and heterotypic nearest neighbor cumulative frequencies rapidly approached 100%. Therefore, the relationships between TFH and B cells in LuN were quantitatively and qualitatively similar to the corresponding cell:cell spatial relationships observed in tonsil GCs.
Across LuN dHPFs and biopsies there was relatively little variance in the homotypic or heterotypic cell relationships at each distance. The frequency of ICOS+ TFH cells that were within 0.54 μm of a B cell was 42%±17.6 (SD) with SEM of 5.9 (Fig. 4e, f). Likewise, the distribution of other homotypic and heterotypic cell:cell distances demonstrated limited variance. Histologically, the LuN biopsies analyzed were heterogeneous with respect to the intensity of interstitial inflammation (mean TII grade 1.39±1 on a scale of 0-3). However, the frequency of TFH cell to B cell heterotypic conjugates did not vary with the number of CD20+ B cells per dHPF (Fig. S3a). The observed B cell:TFH cell ratios in LuN (mean= 1.50, range: 1.43-1.57) were only slightly lower than those observed in tonsil samples (mean = 1.75, range: 1.43-2.06)
When we performed these analyses on MR and TCMR allograft rejection cases, the observed conjugate rates were remarkably different (Fig. 4i-l). In MR (Fig. 4i-j) almost 80% of TFH cells were within 0.54 μm of a B cell, but this number was only15% in TCMR (Fig. 4k-l). Furthermore, segregating MR renal rejection cases based on mean density of infiltrating B cells revealed no significant change in conjugate rates (Fig. S3b).
In MR, the fraction of TFH cells within 0.54 μm of a B cell was high (80.7%), but the fraction of B cells within the same distance from a TFH cell was disproportionally low (23.4%). Furthermore, beyond the 25% of B cells within 1 μm of TFH-like cells, the cumulative frequency of B to TFH-like cell distances demonstrated a gradual linear increase. These observations suggest that the majority of B cells in the MR biopsies were spatially removed from the TFH populations. Indeed, representative CLSM images confirmed this (Fig. S4).
The TFH:B cell conjugate frequency, defined as the fraction of TFH cells within 0.54 μm of a B cell, for each renal disease was characteristic of each disease (Fig. 4m) and remarkably consistent within each disease group. Furthermore, the distribution of TFH cells in relationship to B cells among each disease group was distinctive (Fig. 4n, Supplemental Table 3). These qualitative differences were apparent when line fit algorithms were used to characterize TFH:B cell cumulative proximity distributions in each group. As illustrated in Fig. 4n and Table S4, GCs, LuN, and MR all followed a logarithmic distribution with excellent correlation (r2 range: 0.938-0.988). In contrast, TCMR cases clearly followed a linear distribution (r2 =0.986).
We next determined if TFH:B cell conjugate rates could represent spurious observations of an underlying random distribution. Therefore, the observed location and number of B cells were fixed within each LuNdHPF, and TFH cells allowed random distributions in the remaining unoccupied space (Fig. S5). Per biopsy, the chance that the observed conjugate rates arose by chance was vanishingly small (e.g., mean p <3.32-20 for ICOS+ TFH) and was always significant for each biopsy examined. These data indicate that TFH:B cell conjugation rates were not spurious effects of a random distribution, and demonstrate that statistically meaningful information can be derived from single clinical biopsy samples.
CDM identifies competent TFH cells in situ
It would be expected that those TFH-like cells competent to form conjugates with B cells would be more differentiated along the TFH lineage than those that did not form conjugates (12). Therefore, we used laser capture microscopy (LCM) to sample mRNA from ICOS+ cells in tonsil GCs, LuN, TCMR, MR, and normal kidney (NK) tissues. We then performed nested quantitative PCR to assess the expression of the transcription factors BATF and Bcl-6, IL-21, as well as CD4, CD19, and CXCR4 (Fig. 5). BATF is necessary for germinal center formation and maturation of antibody-secreting B cells (26, 27), and has been postulated to prime for the differentiation of multiple CD4+ T cell subsets, including TFH cells (28). Indeed, ICOS+ cells from GCs, and all studied renal interstitial diseases, similarly expressed BATF. The expression of CXCR4, one of the canonical TFH cell markers, was likewise relatively uniform across all samples (16). However, the T cell populations varied remarkably in the expression of Bcl-6 and IL-21, which are dependent upon cognate B cell stimulation through the TCR (29, 30) and are required for full TFH differentiation and TFH function, respectively (12, 31). High expression of Bcl-6 was not associated with high CD19 expression. However, it correlated with the TFH:B cell conjugate rate; TCMR cells expressed barely detectable levels. Similarly, the expression of IL-21 in GCs, LuN, and MR was much higher than that observed in TCMR. Immunofluorescent staining with antibodies to IL-21, CD3, and ICOS followed by CLSM confirmed this expression pattern of IL-21 by TFH cells in GCs and LuN (Fig. S6a). To address the possibility that TH17-lineage cells were contributing to IL-21 production and LuN pathogenesis (32, 33), immunofluorescent staining was performed with antibodies to IL-17 and CD3. As shown in Fig. S6b, IL-17 was present in control Crohn's Disease and GC samples but not LuN cases. These data indicate that only those TFH cell populations in conjugates with B cells express the markers of fully differentiated and competent TFH cells, and are the source of IL-21.
Fig. 5. Differential Bcl-6 and IL-21 expression in ICOS+ TFH cells correlates with in situ conjugate distance frequencies.

Laser captured microscopy was used to obtain mRNA from normal human kidney (NK) and ICOS+ cells from lupus nephritis (LuN), tonsil germinal centers (GC), T cell-mediated (TCMR), and mixed cellular renal allograft rejection (MR) samples. These were subjected to nested quantitative PCR for the indicated targets as described in Materials and Methods. Illustrated are the relative expression fold changes compared to normalized NK control values. The y-axis scale is logarithmic. Each plotted point corresponds to a separate biopsy sample with a minimum of 2 consecutive reactions each (duplicates). Bars denote mean values; *P<0.005, **P<0.05 as compared to reference GC values (Mann-Whitney test).
Supramolecular activation complexes at the TFH:B cell interface in situ
In in vitro systems, antigen specific conjugates between T cell and antigen presenting cells (APCs) are associated with polarization of surface receptors and their organization into supramolecular activation complexes (SMACs) (34-36). Therefore, we determined if the TFH cell:B cell conjugates observed in GCs and LuN at the 0.54 μm conjugate distance cutoff were associated with SMACs. From tonsil and LuN renal fresh frozen biopsies, we stained 7 micron thick sections with antibodies specific for CD3, ICAM, MHC class II, and LFA-1, and acquired images using a z-stack protocol by means of CLSM as described in Materials and Methods. Three-dimensional images were then reconstructed and analyzed using Imaris 7.3 software (Bitplane Scientific Solutions, Zurich, Switzerland).
Representative images obtained from LuN using the Imaris surface creation tool to visualize distinct membrane staining contours are provided in Fig. 6 with the unedited raw images provided for comparison in Supplemental Fig. 7. Isolated nuclei or nuclear fragments were removed for ease of visualization of surface renderings and relationships thereof in the final images of Fig. 6. As demonstrated in panel a, there was a distinct polarization of MHC class II observed on APCs (nuclei colored in teal) toward ligand receptors on the T cell (nucleus colored in peach). Furthermore, the CD3-rich projections (red) from the T cell extend toward and extensively interact with MHC class II-rich projections (blue) from the B cell. Another example is provided in Fig. 6b, in which synaptic molecules are polarized to the T:B cell interface. Cross-sections of this interface (panels x and y) demonstrated distinct CD3 and LFA-1 areas. There were also extensive regions of MHC class II flanked by ICAM-1 (panel x). These data indicate that there is a polarization and alignment of surface molecules consistent with SMACs and antigen-specific cognate T:B cell interactions (37).
Fig. 6. Three dimensional imaging of TFH:B cell cognate pairs in LuN.
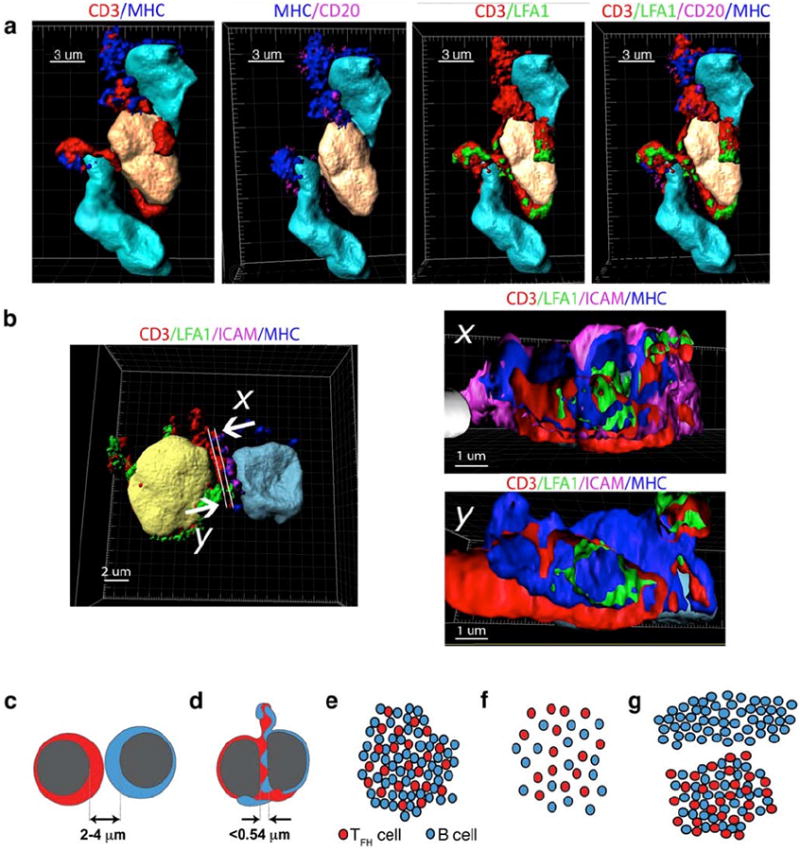
(a,b) Three-dimensional surface reconstructions from human lupus nephritis. (a) T cell (peach) flanked by two B cells (teal). Staining signatures for CD3 (red), LFA1 (green), CD20 or ICAM (magenta), and MHC class II (blue) are illustrated as well as their relationship to respective nuclei. (b) T follicular helper (TFH) cell (yellow), interacting with a B cell (teal)(left panel). Orthogonal two-dimensional cuts (right panels) illustrating segregation of CD3 and LFA1 on T cell (x and y) and of MHC class II and ICAM1 (magenta) on B cell surface (x). Directionality indicated by arrows. Scale in μm indicated for each image. (c-g) Schematic representation of relationships between cell distances, cell:cell interactions and global cellular organizations in inflamed tissue. Close packed cells usually have internuclear distances between 2 and 4 μm (c). However, when cells form cognate pairs, close proximities of less than 0.54 μm are established (d). In GC and LuN biopsies, TFH and B cells are closely aggregated and account for the great majority of both cell types in the biopsies (e). This is reflected in simple logarithmic homotypic and heterotypic relationships. In contrast, TCMR conjugate rates are much lower and cells are randomly (linear) distributed (f). Consequently, in MR cases, B cells exhibit divergent population distributions located either in aggregates with TFH cells or spatially segregated in TFH-independent infiltrations (g). These different cell relationships result in logarithmic TFH:B cell relationships and primarily linear B:B cell relationships.
Discussion
Our data indicate that accurate and sensitive mapping of the relationships between T and B cells in human tissue can identify when T cells are providing help and, therefore, when adaptive immunity is coordinated in situ. We could identify cognate TFH:B cell pairs because they had the specific feature of close juxtaposition of cell nuclei such that they often could not be resolved by conventional CLSM (Fig. 6d). Such close proximity is likely a manifestation of the extensive flattening and morphological reorganization observed in vitro when a T cell recognizes MHC class II-peptide complexes (38-41). Such changes are tightly coordinated and have almost always been observed in settings of specific cognate antigen presentation by APCs to T cells (42, 43).
Characterizing global and relative positioning behaviors of cells in human tissue identified functional cell subpopulations not apparent by other means (Fig. 6e-g). In LuN, TFH cells aggregated with B cells (logarithmic distance distributions) in a manner similar to that observed in GC light zones (44). Furthermore, the ratio of B cells to TFH cells in LuN and GC light zones were similar. These observations suggest that in situ, TFH cells select and maintain the majority of B cells within these tissues. In contrast, MR had the highest TFH:B cell conjugate rates yet the majority of B cells did not organize around these TFH cells. This suggests that there are at least two different functional populations of B cells in MR: one that is maintained by TFH cells and another selected through TFH-cell independent mechanisms. In TCMR, the cell distance relationships were linear, consistent with a random distribution of T and B cells within the biopsy and an absence of functional relatedness.
Cellular distance mapping results correlated with features of in situ adaptive immunity. For example, the relative distribution of TFH and B cells in LuN suggested antigen-driven B cell selection in situ. Indeed, in LuN, B cells are clonally expanded with distributions of somatic hypermutations indicative of antigen-driven selection (11). Furthermore, TFH cells appeared to be sufficient to account for B cell selection. This predicts that selecting antigens in situ would be T cell-dependent, and not contain molecular patterns that can be selected through T cell-independent mechanisms such is the case for dsDNA (45), which can activate B cells via TLR9 (46). Likewise, high conjugate rates were associated with local antibody deposition and complement fixation in MR cases (47), while in TCMR, where antibodies are not deposited locally, T and B cell populations were not antigenically related. Finally, molecular characterization of the TFH cells revealed that even though the canonical markers of TFH differentiation (CD4, CXCR4, BATF) were expressed uniformly across all samples studied, only those disease states in which frequent TFH:B cell conjugates were observed demonstrated striking elevations of IL-21 and Bcl-6 (12, 48).These data suggest that TFH:B cell distance relationships predict the degree and quality of the in situ adaptive immune response.
Remarkably, the relationships between TFH and B cells, including the frequency with which they formed cognate pairs and the degree to which they assembled in a biopsy, were characteristic for each renal disease. There was little variance between biopsies examined by us for a given disease even though the histological appearance of each biopsy was predictably variable. These data indicate that for a given disease, the underlying relationships between effector lymphocytes are relatively invariant, and suggest that they can be used to identify pathophysiologically distinct disease states.
Our approach provides a snapshot of the relationships between TFH and B cells in situ. Unlike TPEM, we cannot use CDM to determine if the observed conjugate rates arise from low-frequency, stable associations or frequent, transient cell:cell interactions. Likewise, we cannot manipulate antigen or specific cell surface molecules to understand their relative contributions to the frequency and duration of cell interactions. Such studies can only be done is animal systems that can be extensively manipulated. Thus while CDM can identify and quantify the extent of TFH:B cell collaboration, it cannot be used to dissect the relative contributions of specific factors in driving in situ adaptive immunity.
We developed CDM in order to understand the role of TFH cells in propagating humoral immunity at sites of inflammation. However, CDM can be used to identify relevant functional T and APC populations in virtually any diseased tissue. Understanding the networks of cell interactions underlying inflammation, and the molecular features of cells within these networks, should reveal critical pathogenic mechanisms that can then be targeted therapeutically.
Materials and Methods
Renal biopsy staining and capture of images for two- and three-dimensional confocal microscopy
This retrospective study utilized renal biopsies randomly selected in regards to patient characteristics from our SLE and renal transplant patient populations. Patients at the University of Chicago who met revised 1982 ACR criteria for Systemic Lupus Erythematosus (49) or who had previously undergone a renal allograft were prospectively consented for obtaining renal tissue samples. Those who displayed ISN/RPS Class II, III, IV, or V lupus nephritis (LuN) or T cell-mediated renal allograft rejection (TCMR) or features of both antibody-mediated and TCMR, which we termed mixed cellular renal allograft rejection (MR) based on 2009 Banff criteria (17) on renal biopsy, were selected for this study. Cases that had some features of TCMR, but had prominent B cell aggregates or germinal centers, were excluded. Using these criteria, 42 lupus and 28 allograft rejection kidney biopsies (14 MR and 14 TCMR) were identified of sufficient quantity and quality for analysis. In addition, de-identified Crohn's disease and tonsil samples were utilized from the University of Chicago Pathology Core Facility. The study protocol was approved by the University of Chicago Institutional Review Board. Clinical information for each lupus patient was obtained from retrospective chart review using our electronic medical record system, Epic (Epic Systems). Each diagnostic biopsy sample consisted of at least two tissue cores with smaller portions submitted for immunofluorescence and electron microscopy. At the time of procurement, renal biopsies were immediately frozen in OCT media (Tissue-Tek) and stored at -80°C. Antibody-mediated renal allograft rejection was confirmed by C4d staining (Clone 10-11, Biogenesis) (18). For TII grading, selected biopsy specimens were stained with anti-CD45 (DAKO) antibodies and were consecutively scored for lymphocyte infiltration by a blinded pathologist [AC].
For two-dimensional analysis, 3 μm fresh frozen sections were stained with immunofluorescent antibodies against CD4 (rat, Novus Biologicals), PD-1 (mouse, Abcam, Cambridge, MA), and ICOS (rabbit, Spring Bioscience) in combination with CD20 (mouse, DAKO or rabbit, Epitomics), and 4′,6-diamidino-2-phenylindole [DAPI] (Invitrogen). Fluorescently labeled species-specific secondary anti-IgG antibodies (Invitrogen) were applied for visualization of primary antibodies that were not directly labeled.
Images were obtained utilizing an Olympus IX2-UCB DSU spinning disc confocal microscope (Olympus) with an Evolve EM-CCD camera (Photometrics) at the University of Chicago Integrated Light Microscopy Facility. Four-color immunofluorescence was performed at 600× magnification and a high 1.2 NA oil-immersion objective. Images were acquired and stored in original SlideBook format (Intelligent Imaging Innovations) with a bit depth of 16, no binning, and a total size of 512×512 pixels with each pixel corresponding to 0.27 μm. Prior to analysis, images were converted to universal TIFF format after undergoing blinded (non-nearest neighbor) deconvolution with SlideBook 5.0 software. For three-dimensional image analysis, selected fresh-frozen biopsy specimens were cut into 7 μm sections and stained with immunofluorescent antibodies as described above with the addition of antibodies against CD3 (rabbit, Thermo Fisher Scientific; rat, Novus Biologicals; or mouse, Abcam), ICAM-1 (mouse, DAKO), LFA-1 (rabbit, Epitomics), CD20 (mouse, DAKO or rabbit, Epitomics), and MHC II [HLA-DR/DQ/DP](mouse, DAKO or rat, LifeSpan Biosciences). Visualization with species-specific secondary anti-IgG antibodies was performed as above. Images were captured utilizing a TCS SP2 Leica laser scanning confocal microscope (Leica) using a z-axis capture protocol in 0.25 μm increments at 600x magnification and high NA oil-immersion objective (1.25 and above). Images were acquired by means of a PMT detector with a bit depth of 16, no binning, and a total size of 1024 × 1024 pixels, and stored in original LEI file format. Single stained cell controls were utilized to determine optimal thresholds for each antibody used for both two- and three-dimensional methods.
Immunofluorescent cytokine staining
Corresponding human tonsil, Crohn's disease, and lupus nephritis samples were stained with immunofluorescent antibodies against CD3 (mouse, Abcamor rabbit, Thermo Scientific), IL-17 (goat or mouse, R&D Systems), and IL-21 (goat, Novus Biologicals) in addition to those listed above. Fluorescently labeled species-specific secondary anti-IgG antibodies (Invitrogen) were applied for visualization of primary antibodies that were not directly labeled.
Immunohistochemical staining
Serial paraffin 3 μm sections of renal tissue from lupus nephritis patients were probed with antibodies specific for CD4 (rat, Novus Biologicals), ICOS (rabbit, Spring Bioscience), or CXCR4 (rabbit, Epitomics). Slides were then incubated with HRP-conjugated species-specific anti-IgG antibodies, and immunoreactivity was visualized by incubation with 3,3′-Diaminobenzidine (DAB).
Two-dimensional image extraction and manual analysis
Slidebook 5.0 software (Intelligent Imaging Innovations) was utilized to convert the captured images to TIFF format with a matrix size of 512 × 512 pixels and a resolution of 0.27 μm per pixel, after accounting for de-convolution (non-nearest-neighbor correction - default settings: subtraction 0.9, S-pairing 0.5). The photo-editing software ImageJ (http://imagej.nih.gov/ij/) was used to transform the obtained files into binary form, utilizing a macro-based algorithm for automation of background subtraction, watershedding, fluorescence threshold calibration, despeckling, and exclusion of small particles. Each antibody used had a separate algorithm developed and tested based on manual analysis of the final resulting image. Appropriate single stained controls were utilized with each antibody to ensure that no fluorochrome spectral cross-bleeding was present.
Two-dimensional image computer-assisted analysis (Cell Distance Mapping)
Four input, intermediate, and final output digital high-power field (dHPF) images taken from tonsil biopsy samples were used to develop the initial computer technique for optimizing and automating the two-dimensional image analysis based on a previously published method (50). Analysis consisted of marker segmentation, cell type identification, and cell-cell distance determination. Specifically, cell nuclei (DAPI) were segmented based on an adaptive thresholding method with cell-clump splitting to approximate the locations of individual nuclei from a group with incomplete boundaries. The Otsu threshold-selection criterion was used to determine an approximate global threshold across each region. After this, for each four-connected region, we selected another local threshold using the Otsu criterion, applied only to the smallest bounding box that contained the region. This allowed the selection of different thresholds throughout the image to accommodate the common problem of heterogeneous illumination of nuclei across the stained section. Regions deemed too small to be a single cell nucleus were removed (50 pixels or 3.65 μm2); regions that were too large (1,000 pixels or 73 μm2) received application of a morphological opening operation for splitting into multiple discrete nuclei (51). We then used a morphological top-hat operation to segment different membrane markers. First, a 3 × 3-pixel average filter was applied to the membrane signatures for noise suppression; then the morphological top-hat operation was used to enhance membrane surface marker(s) (this is a standard imaging technique that corrects for uneven illumination, improving visibility and contrast) (25). Subsequently, a threshold determined by the isodata algorithm was applied to segment cell membrane markers. This was applied to each unique membrane marker and combinations thereof. Finally, the marker regions were smoothed using a 3 × 3-pixel median filter.
As noted in Results, lymphocyte membrane staining in tissue was complex, likely reflecting the irregular shapes that these cells acquire as they migrate through dense organ structures. This made it difficult to definitively identify the membranous boundaries of individual cells by visual approximation alone. In contrast, DAPI staining usually revealed the complete border of each nucleus and, therefore, its precise location. For these reasons, we used membrane staining in combination with its respective DAPI correlate to definitively assign nuclei to cell types based on proximity of 1 pixel or less. This stringent criteria limited overestimation of cell numbers based on non-specific staining. Nuclei that did not meet the above criteria were unassigned and effectively eliminated from further analysis. Another issue encountered was the identification of certain nuclei as belonging simultaneously to a TFH and a B cell. This could occur because of incomplete segmentation of nuclei or because the membrane staining of each cell was so extensively intertwined that both membrane signatures were assigned to a single nucleus. Therefore, double assigning reflected very close proximity consistent with TFH:B cell conjugates.
After achieving excellent correlation between manual results and analysis using the above algorithm on tonsil tissue (Fig. S2), the CDM method was applied to our image database as listed in Table S2, with interim control samples taken during the analysis to ensure continued correlation between manual and automated analysis methods.
Three-dimensional image generation and analysis
Captured z-axis images were analyzed using Imaris 7.3.1 software (Bitplane Scientific Solutions), and three-dimensional computerized reconstructions of antibody staining were made utilizing the Surface Creation Wizard tool after manual threshold optimizations. In some cases, images were analyzed with two sets of surfaces (high and low threshold) to ensure that membrane processes were appropriately visualized throughout their length. Final reconstructed images were visually compared with input raw images to ensure appropriate thresholds. When possible, cell identification was made by manual matching of appropriate antibody stain combinations with neighboring nuclear structures identified by DAPI. Each antibody and nuclear signature was manually confirmed and adjusted for background correction. To visualize cross-sections of cellular interfaces, the Clipping Plane tool in Imaris was used to select an axis perpendicular to a given cell with subsequent images obtained by means of screen capture. Appropriate single stained controls were utilized with each antibody to ensure that no fluorochrome spectral cross-bleeding was present. Representative images were obtained with each final image resulting from a combination of all stains in either three-dimensional volume reconstruction or background-adjusted spectral representations.
Laser capture microdissection (LCM) of interstitial ICOS+ T cells
Frozen tissue sections (8 μm) from LuN, tonsil, normal renal tissue, MR, and TCMR samples were placed on positively charged glass slides and immunostained for ICOS (rabbit, Spring Bioscience). LCM was then performed as described (11) using the ArcturusPixcell II (Molecular Devices) platform and Capsure®HS LCM caps (Molecular Devices) to isolate ICOS+-stained cells. Pulse power was 75 mW, size spot diameter was 7.5 μm, pulse duration was 1 msec, and target voltage was 115 V. An average of 40-60 cells/LCM cap were obtained from each sample and immediately subjected to cDNA synthesis and PCR.
Synthesis of cDNA
Ten μL of lysis buffer (0.5× PBS, 10 mM DTT, 20 RNAsin [Promega], and 1 U Prime RNAse Inhibitor [Eppendorf]) were aliquoted directly into the extraction reservoir of the LCM cap. Caps were immediately placed on dry ice and stored at −70°C. cDNA was synthesized within the extraction reservoir using 25 μL RT-PCR buffer (375 ng random hexamer primer [pd(N)6, Amersham Pharmacia Biotech], 2 mM 2′-deoxynucleoside 5′-triphosphate-Mix [Promega], 10 mM DTT, 5% v/v Nonidet P-40, 10 U RNAsin, 15 U Prime RNase Inhibitor, and 125 U Superscript II reverse transcriptase [Invitrogen]). The cap was incubated for 60 min at 37°C. RT-PCR reactions were collected by centrifugation at 8000 rpm for 60 seconds into a 500 μL collection tube and heat inactivated at 70°C for 15 min.
Quantitative qPCR of target genes
Selected gene targets were amplified by two rounds of nested PCR in a 40 μL volume (containing 50 nM primers, 1 mM 2′-deoxynucleoside 5′-triphosphates, 1μL Coral Load PCR buffer [Qiagen], 1.25 U HotstarPlus Taq polymerase [Qiagen], and 8 μLcDNA [or first-round PCR product]). Specific primers consisted of mixtures complementary to specific ORF gene regions as follows (5′→3′):
| B-Actin-1F | GGCATCCTCACCCTGAAGTA |
| B-Actin-1R | CCATCTCTTGCTCGAAGTCC |
| B-Actin-2F | AAATCTGGCACCACACCTTC |
| B-Actin-2R | AGGGCATACCCCTCGTAGAT |
| BATF-1F | GTGTGAGAGCCCGGAAGATT |
| BATF-1R | TCCCGTGTTCACTCCTTGTC |
| BATF-2F | GTACTTCACGTCGGTGCTGA |
| BATF-2R | GGAGCTGACATGAGGTTGGT |
| BCL6-1F | CTTGGAGCCGATGGGATTGA |
| BCL6-1R | AAAGGCTCTGCTCTCACACC |
| BCL6-2F | TGGGACCACAGAGAAATGTCA |
| BCL6-2R | GCTCTAAACTGCTCACGGCT |
| CD4-1F | CCAAGTCTTGGATCACCTTTGACCTGAAG |
| CD4-1R | AGAAGAAGATGCCTAGCCCAATGAAAAGC |
| CD4-2F | CTCCCGCTCCACCTCACCCTG |
| CD4-2R | CATGTGGGCAGAACCTTGATGTTGG |
| CD19-1F | TGGAGACGGGTCTGTTGTTG |
| CD19-1R | TCATAGGACTGGGACCCTGC |
| CD19-2F | ACCTGACCATGTCATTCCACCT |
| CD19-2R | AGAAGATCAGATAAGCCAAAGTCACA |
| CXCR4-1F | AGCGTCTCAGTGCCCTTTTG |
| CXCR4-1R | ATCTGCCTCACTGACGTTGG |
| CXCR4-2F | TCTCTTGTGCCCTTAGCCCA |
| CXCR4-2R | GAGCCCATTTCCTCGGTGTA |
| IL21-1F | GAGGAAACCACCTTCCACAA |
| IL21-1R | CAGGAATCTTCACTTCCGTGT |
| IL21-2F | ATGCAGGGAGAAGACAGAAACA |
| IL21-2R | ACCGTGAGTAACTAAGAAGCAAATC |
| GATA3-1F | CATCGACGGTCAAGGCAACC |
| GATA3-1R | GTTCACACACTCCCTGCCTGT |
GATA3-2F and 2R primers obtained commercially from SA Biosciences, (catalog #: PPH02143A-200).
Computer Data and Statistical Analysis
All image analysis data were stored and analyzed using Excel 2011 for Mac (Microsoft, Redmond, WA). Statistical analysis was performed using GraphPad Prism 5.0a software for Mac (GraphPad Software, La Jolla, CA).Statistical tests used include the Mann-Whitney test, unpaired t-test, and probably distribution tests as listed for each figure. Unpaired t-test was used for normally distributed data and Mann-Whitney for non-normal distributions. Two-sided testing was employed at all times with an alpha of 0.05 and confidence intervals defined as the mean ± 2SD, except for the probability distribution analysis where a Bonferroni correction was applied and an alpha cut-off of 0.005 was utilized.
Supplementary Material
Fig. S1 – TFH ICOS+ cells in human lupus nephritis are limited to the renal tubulointerstitium.
Fig. S2 – Preliminary development and validation of automated CDM method.
Fig. S3 – Relationship between cell density and observed TFH:B cell conjugate rates.
Fig. S4 – Immunofluorescent analysis of mixed cellular renal allograft rejection biopsies reveals different patterns of TFH:B cell distribution.
Fig. S5 – Comparison of CDM results to a control random distribution model.
Fig. S6 – TFH ICOS+ cells in human lupus nephritis produce IL-21 but not IL-17.
Fig. S7 – Original antibody staining used for three dimensional surface creation of TFH:B cell cognate pairs in LuN.
Table. S1 – Lupus nephritis patient cohort clinical and histologic characteristics.
Table. S2 – Digital image database utilized for CDM analysis.
Table. S3 – Direct statistical comparison of cell distance mapping distributions between clinical biopsy groups.
Table. S4 – Curve fit analysis for assessing kinetics of cell distance mapping distributions between cases.
Acknowledgments
We thank the University of Chicago Department of Statistics for expert assistance with statistical analysis and input regarding development of a theoretical model for random cell distribution. We also thank Drs. Keith Hamel, Kichul Ko, and Andrew Kinloch for careful reading of the manuscript.
Funding: Supported by grants from the National Institutes of Health (MRC: AR055646), NIH Autoimmunity Centers of Excellence (AI082724), the Arthritis Foundation (VML: RDSA #5411), Roche Organ Transplantation Research Foundation (AC), and MedImmune, LLC (RH, GC).
Abbreviations
- APC
antigen-presenting cell
- TPEM
two-photon excitation microscopy
- GC
germinal center
- TFH
T follicular helper cell
- LuN
lupus nephritis
- TII
tubulointerstitial inflammation
- SMAC
supramolecular activation complex
- CLSM
confocal laser scanning microscopy
- TCMR
T cell-mediated renal allograft rejection
- MR
mixed cellular renal allograft rejection
Footnotes
Author contributions: VML prepared the manuscript, was involved in CDM development (automated and manual approaches), clinical cohort identification and analysis, and three- dimensional imaging analysis; NK performed immunohistochemical and immunofluorescent staining of samples and offered technical expertise in image acquisition; AC performed nephropathological scoring and categorization of all biopsy specimens and provided de-identified human tissue samples; DB performed preliminary work on development of manual distance mapping approach; DY performed single cell laser capture microscopy (LCM), mRNA extraction, and quantitative qPCR analysis; LT performed multichannel immunofluorescent staining of renal transplant samples and helped with result analysis as well as supplied representative figures; GC and RH provided technical expertise and support for single cell mRNA analysis and gene array profiles from LCM samples; TU served as a rheumatology clinical consultant for patient cohort analysis and provided patient samples from a longitudinal SLE clinic cohort; CL provided technical expertise and consultation for manual development of CDM analysis based on ImageJ algorithms as well as technical expertise and troubleshooting for multi-channel confocal microscopy image acquisition; YP was instrumental in development of automated CDM analysis and translation of manual approach to free-standing, objective, computerized platform, and performed the pilot study of manual and automated CDM analyses and result comparison using tonsil tissue in conjunction with VML; YJ provided technical advice and expert consultation on automated CDM algorithms, as well as development and implementation of random distribution comparison model for validation of results; MLG provided technical advice and expert consultation on automated CDM algorithms and image analysis; MRC was responsible for overseeing the project, preparing the final manuscript and initial development of CDM as a tool to predict functional interactions.
Competing interests: Gianluca Carlesso and Ronald Herbst are full-time employees of MedImmune, LLC.
Data and materials availability: All data and any materials unique to this project will be made freely available as practical to requesting investigators.
Supplementary Materials: Supplementary materials and methods: None
Other supplementary files: none
Contributor Information
Vladimir M. Liarski, Email: vladimir.liarski@uchospitals.edu.
Natalya Kaverina, Email: kaverinan@yahoo.com.
Anthony Chang, Email: anthony.chang@uchospitals.edu.
Daniel Brandt, Email: dfbrandt2@yahoo.com.
Denisse Yanez, Email: dyanez@bsd.uchicago.edu.
Lauren Talasnik, Email: ltalasnik@uchicago.edu.
Gianluca Carlesso, Email: carlessog@medimmune.com.
Ronald Herbst, Email: herbstro@medimmune.com.
Tammy O. Utset, Email: tutset@medicine.bsd.uchicago.edu.
Christine Labno, Email: ccase@uchicago.edu.
Yahui Peng, Email: yahuip@uchicago.edu.
Yulei Jiang, Email: yjiang@uchicago.edu.
Maryellen L. Giger, Email: m-giger@uchicago.edu.
Marcus R. Clark, Email: mclark@medicine.bsd.uchicago.edu.
References and Notes
- 1.Abbas AK, Lichtman AH, Pillai S. Cellular and Molecular Immunology. Suanders/Elsevier; 2012. [Google Scholar]
- 2.Schwickert TA, et al. In vivo imaging of germinal centres reveals a dynamic open structure. Nature. 2007 Mar 1;446:83. doi: 10.1038/nature05573. [DOI] [PubMed] [Google Scholar]
- 3.Allen CD, Okada T, Cyster JG. Germinal-center organization and cellular dynamics. Immunity. 2007 Aug;27:190. doi: 10.1016/j.immuni.2007.07.009. [DOI] [PMC free article] [PubMed] [Google Scholar]
- 4.Kerfoot SM, et al. Germinal center B cell and T follicular helper cell development initiates in the interfollicular zone. Immunity. 2011 Jun 24;34:947. doi: 10.1016/j.immuni.2011.03.024. [DOI] [PMC free article] [PubMed] [Google Scholar]
- 5.Qi H, Cannons JL, Klauschen F, Schwartzberg PL, Germain RN. SAP-controlled T-B cell interactions underlie germinal centre formation. Nature. 2008 Oct 9;455:764. doi: 10.1038/nature07345. [DOI] [PMC free article] [PubMed] [Google Scholar]
- 6.Morita R, et al. Human blood CXCR5+CD4+ T cells are counterparts of T follicular cells and contain specific subsets that differentially support antibody secretion. Immunity. 2011;34:108. doi: 10.1016/j.immuni.2010.12.012. [DOI] [PMC free article] [PubMed] [Google Scholar]
- 7.Tangye SG, Ma CS, Brink R, Deenick EK. The good, the bad and the ugly - TFH cells in human health and disease. Nat Rev Immunol. 2013;13:412. doi: 10.1038/nri3447. [DOI] [PubMed] [Google Scholar]
- 8.Hsieh C, et al. Predicting outcomes of lupus nephritis with tubulointerstitial inflammation and scarring. Arthritis Care Res (Hoboken) 2011 Jun;63:865. doi: 10.1002/acr.20441. [DOI] [PMC free article] [PubMed] [Google Scholar]
- 9.Austin HA, 3rd, et al. Prognostic factors in lupus nephritis. Contribution of renal histologic data. Am J Med. 1983 Sep;75:382. doi: 10.1016/0002-9343(83)90338-8. [DOI] [PubMed] [Google Scholar]
- 10.Esdaile JM, Levinton C, Federgreen W, Hayslett JP, Kashgarian M. The clinical and renal biopsy predictors of long-term outcome in lupus nephritis: a study of 87 patients and review of the literature. Q J Med. 1989 Sep;72:779. [PubMed] [Google Scholar]
- 11.Chang A, et al. In situ B cell-mediated immune responses and tubulointerstitial inflammation in human lupus nephritis. J Immunol. 2011 Feb 1;186:1849. doi: 10.4049/jimmunol.1001983. [DOI] [PMC free article] [PubMed] [Google Scholar]
- 12.Crotty S. Follicular helper CD4 T cells (TFH) Ann Rev Immunol. 2011;29:621. doi: 10.1146/annurev-immunol-031210-101400. [DOI] [PubMed] [Google Scholar]
- 13.Simpson N, et al. Expansion of circulating T cells resembling tollicular helper T cells is a fixed pheotype that identifies a subset of severe systemic lupus erythematosus. Arth Rheum. 2010;62:234. doi: 10.1002/art.25032. [DOI] [PubMed] [Google Scholar]
- 14.Zotos D, et al. IL-21 regulates germinal center B cell differentiation and proliferation through a B cell-intrinsic mechanism. J Exp Med. 2010 Feb 15;207:365. doi: 10.1084/jem.20091777. [DOI] [PMC free article] [PubMed] [Google Scholar]
- 15.Kroenke MA, et al. Bcl6 and Maf cooperate to instruct human follicular helper CD4 T cell differentiation. J Immunol. 2012 Apr 15;188:3734. doi: 10.4049/jimmunol.1103246. [DOI] [PMC free article] [PubMed] [Google Scholar]
- 16.Yu D, et al. The transcriptional repressor Bcl-6 directs T follicular helper cell lineage commitment. Immunity. 2009 Sep 18;31:457. doi: 10.1016/j.immuni.2009.07.002. [DOI] [PubMed] [Google Scholar]
- 17.Sis B, et al. Banff '09 meeting report: antibody mediated graft deterioration and implementation of Banff working groups. Am J Transplant. 2010 Mar;10:464. doi: 10.1111/j.1600-6143.2009.02987.x. [DOI] [PubMed] [Google Scholar]
- 18.Watschinger B, Pascual M. Capillary C4d deposition as a marker of humoral immunity in renal allograft rejection. J Am Soc Nephrol. 2002 Sep;13:2420. doi: 10.1097/01.asn.0000029941.34837.22. [DOI] [PubMed] [Google Scholar]
- 19.Kageyama R, et al. The receptor Ly108 functions as a SAP adaptor-dependent on-off switch for T cell help to B cells and NKT cell development. Immunity. 2012 Jun 29;36:986. doi: 10.1016/j.immuni.2012.05.016. [DOI] [PMC free article] [PubMed] [Google Scholar]
- 20.Victora GD, Nussenzweig MC. Germinal centers. Ann Rev Immunol. 2012;30:429. doi: 10.1146/annurev-immunol-020711-075032. [DOI] [PubMed] [Google Scholar]
- 21.Giger ML, Chan HP, Boone J. Anniversary paper: History and status of CAD and quantitative image analysis: the role of Medical Physics and AAPM. Med Phys. 2008 Dec;35:5799. doi: 10.1118/1.3013555. [DOI] [PMC free article] [PubMed] [Google Scholar]
- 22.Yuan Y, Giger ML, Li H, Suzuki K, Sennett C. A dual-stage method for lesion segmentation on digital mammograms. Med Phys. 2007 Nov;34:4180. doi: 10.1118/1.2790837. [DOI] [PubMed] [Google Scholar]
- 23.Chen W, Giger ML, Bick U. A fuzzy c-means (FCM)-based approach for computerized segmentation of breast lesions in dynamic contrast-enhanced MR images. Acad Radiol. 2006 Jan;13:63. doi: 10.1016/j.acra.2005.08.035. [DOI] [PubMed] [Google Scholar]
- 24.Sibarita JB. Deconvolution microscopy. Adv Biochem Eng Biotechnol. 2005;95:201. doi: 10.1007/b102215. [DOI] [PubMed] [Google Scholar]
- 25.Dougherty ER, Zhao D. Case studies of morphological top-hat optimization. Proc SPIE. 1994 May 1;2180:221. 1994. [Google Scholar]
- 26.Langenkamp A, et al. Kinetics and expression patterns of chemokine receptors in human CD4+ T lymphocytes primed by myeloid or plasmacytoid dendritic cells. Eur J Immunol. 2003;33:474. doi: 10.1002/immu.200310023. [DOI] [PubMed] [Google Scholar]
- 27.Teichmann LL, Schenten D, Medzhitov R, Kashgarian M, Schlomchik MJ. Signals via the adpator MyD88 in B cells and DCs make distinct and synergistic contributions to immune activation and tissue damage in lupus. Immunity. 2013;38:528. doi: 10.1016/j.immuni.2012.11.017. [DOI] [PMC free article] [PubMed] [Google Scholar]
- 28.Ciofani M, et al. A validated regulatory network for Th17 cell specification. Cell. 2012;151:289. doi: 10.1016/j.cell.2012.09.016. [DOI] [PMC free article] [PubMed] [Google Scholar]
- 29.Goenka R, et al. Cutting edge: dendritic cell-restricted antigen presentation initiates the follicular helper T cell program but cannot complete ultimate effector differentiation. J Immunol. 2011;187:1091. doi: 10.4049/jimmunol.1100853. [DOI] [PMC free article] [PubMed] [Google Scholar]
- 30.King IL, Mohrs M. IL-4-producing CD4+ T cells in reactive lymph nodes during helminth infection are T follicular helper cells. J Exp Med. 2009;206 doi: 10.1084/jem.20090313. [DOI] [PMC free article] [PubMed] [Google Scholar]
- 31.Oestreich KJ, Mohn SE, Winmann AS. Molecular mechanisms that control the expression and activity of Bcl-6 in TH1 cells to regulate flexibility with a TFH-like gene profile. Nat Immunol. 2012;13:405. doi: 10.1038/ni.2242. [DOI] [PMC free article] [PubMed] [Google Scholar]
- 32.Nurieva RI, et al. Generation of T follicular helper cells is mediated by interleukin-21 but independent of T helper 1, 2, or 17 cell lineages. Immunity. 2008 Jul 18;29:138. doi: 10.1016/j.immuni.2008.05.009. [DOI] [PMC free article] [PubMed] [Google Scholar]
- 33.Apostolidis SA, Crispin JC, Tsokos GC. IL-17-producing T cells in lupus nephritis. Lupus. 2011;20:120. doi: 10.1177/0961203310389100. [DOI] [PubMed] [Google Scholar]
- 34.Monks CR, Freiberg BA, Kupfer H, Sciaky N, Kupfer A. Three-dimensional segregation of supramolecular activation clusters in T cells. Nature. 1998 Sep 3;395:82. doi: 10.1038/25764. [DOI] [PubMed] [Google Scholar]
- 35.Dustin ML. Visualization of Cell-Cell Interaction Contacts: Synapses and Kinapses. Self Nonself. 2011 Apr;2:85. doi: 10.4161/self.2.2.17931. [DOI] [PMC free article] [PubMed] [Google Scholar]
- 36.Dustin ML, Chakraborty AK, Shaw AS. Understanding the structure and function of the immunological synapse. Cold Spring Harb Perspect Biol. 2010 Oct;2:a002311. doi: 10.1101/cshperspect.a002311. [DOI] [PMC free article] [PubMed] [Google Scholar]
- 37.Friedl P, den Boer AT, Gunzer M. Tuning immune responses: diversity and adaptation of the immunological synapse. Nat Rev Immunol. 2005 Jul;5:532. doi: 10.1038/nri1647. [DOI] [PubMed] [Google Scholar]
- 38.Wulfing C, Sjaastad MD, Davis MM. Visualizing the dynamics of T cell activation: intracellular adhesion molecule 1 migrates rapidly to the T cell/B cell interface and acts to sustain calcium levels. Proc Natl Acad Sci U S A. 1998 May 26;95:6302. doi: 10.1073/pnas.95.11.6302. [DOI] [PMC free article] [PubMed] [Google Scholar]
- 39.Wulfing C, Davis MM. A receptor/cytoskeletal movement triggered by costimulation during T cell activation. Science. 1998 Dec 18;282:2266. doi: 10.1126/science.282.5397.2266. [DOI] [PubMed] [Google Scholar]
- 40.Cannon JL, Burkhardt JK. The regulation of actin remodeling during T-cell-APC conjugate formation. Immunol Rev. 2002 Aug;186:90. doi: 10.1034/j.1600-065x.2002.18609.x. [DOI] [PubMed] [Google Scholar]
- 41.Nolz JC, et al. The WAVE2 complex regulates actin cytoskeletal reorganization and CRAC-mediated calcium entry during T cell activation. Curr Biol. 2006 Jan 10;16:24. doi: 10.1016/j.cub.2005.11.036. [DOI] [PMC free article] [PubMed] [Google Scholar]
- 42.Delon J, Bercovici N, Raposo G, Liblau R, Trautmann A. Antigen-dependent and -independent Ca2+ responses triggered in T cells by dendritic cells compared with B cells. J Exp Med. 1998 Oct 19;188:1473. doi: 10.1084/jem.188.8.1473. [DOI] [PMC free article] [PubMed] [Google Scholar]
- 43.Montes M, McIlroy D, Hosmalin A, Trautmann A. Calcium responses elicited in human T cells and dendritic cells by cell-cell interaction and soluble ligands. Int Immunol. 1999 Apr;11:561. doi: 10.1093/intimm/11.4.561. [DOI] [PubMed] [Google Scholar]
- 44.Hamel KM, Liarski VM, Clark MR. Germinal center B-cells. Autoimmunity. 2012 Aug;45:333. doi: 10.3109/08916934.2012.665524. [DOI] [PubMed] [Google Scholar]
- 45.Tsao PY, Jiao J, Ji MQ, Cohen PL, Eisenberg RA. T cell-independent spontaneous loss of tolerance by anti-double-stranded DNA B cells in C57BL/6 mice. J Immunol. 2008 Dec 1;181:7770. doi: 10.4049/jimmunol.181.11.7770. [DOI] [PubMed] [Google Scholar]
- 46.Viglianti GA, et al. Activation of autoreactive B cells by CpG dsDNA. Immunity. 2003 Dec;19:837. doi: 10.1016/s1074-7613(03)00323-6. [DOI] [PubMed] [Google Scholar]
- 47.Bartel G, et al. In vitro detection of C4d-fixing HLA alloantibodies: associations with capillary C4d deposition in kidney allografts. Am J Transplant. 2008 Jan;8:41. doi: 10.1111/j.1600-6143.2007.01998.x. [DOI] [PubMed] [Google Scholar]
- 48.Ma CS, et al. Early commitment of naïve human CD4+ T cells to the T follicular helper (TFH) cell lineage is induced by IL-12. Immunol Cell Biol. 87:590. doi: 10.1038/icb.2009.64. [DOI] [PubMed] [Google Scholar]
- 49.Tan EM, et al. The 1982 revised criteria for the classification of systemic lupus erythematosus. Arth Rheum. 1982;25:1271. doi: 10.1002/art.1780251101. [DOI] [PubMed] [Google Scholar]
- 50.Peng Y, et al. Computer image analysis of cell-cell interactions in human renal tissue by using multi-channel immunoflourescent confocal microscopy. Proc SPIE. 2012 Feb 23;8315:1. 2012. [Google Scholar]
- 51.Polliack A, et al. Identification of human B and T lymphocytes by scanning electron microscopy. J Exp Med. 1973 Sep 1;138:607. doi: 10.1084/jem.138.3.607. [DOI] [PMC free article] [PubMed] [Google Scholar]
Associated Data
This section collects any data citations, data availability statements, or supplementary materials included in this article.
Supplementary Materials
Fig. S1 – TFH ICOS+ cells in human lupus nephritis are limited to the renal tubulointerstitium.
Fig. S2 – Preliminary development and validation of automated CDM method.
Fig. S3 – Relationship between cell density and observed TFH:B cell conjugate rates.
Fig. S4 – Immunofluorescent analysis of mixed cellular renal allograft rejection biopsies reveals different patterns of TFH:B cell distribution.
Fig. S5 – Comparison of CDM results to a control random distribution model.
Fig. S6 – TFH ICOS+ cells in human lupus nephritis produce IL-21 but not IL-17.
Fig. S7 – Original antibody staining used for three dimensional surface creation of TFH:B cell cognate pairs in LuN.
Table. S1 – Lupus nephritis patient cohort clinical and histologic characteristics.
Table. S2 – Digital image database utilized for CDM analysis.
Table. S3 – Direct statistical comparison of cell distance mapping distributions between clinical biopsy groups.
Table. S4 – Curve fit analysis for assessing kinetics of cell distance mapping distributions between cases.