

Abstract
In response to an attractant or repellant, an Escherichia coli cell controls the rotational direction of its flagellar motor by a chemotaxis system. When an E. coli cell senses an attractant, a reduction in the intracellular concentration of a chemotaxis protein, phosphorylated CheY (CheY-P), induces counterclockwise (CCW) rotation of the flagellar motor, and this cellular response is thought to occur in several hundred milliseconds. Here, to measure the signaling process occurring inside a single E. coli cell, including the recognition of an attractant by a receptor cluster, the inactivation of histidine kinase CheA, and the diffusion of CheY and CheY-P molecules, we applied a serine stimulus by instantaneous photorelease from a caged compound and examined the cellular response at a temporal resolution of several hundred microseconds. We quantified the clockwise (CW) and CCW durations immediately after the photorelease of serine as the response time and the duration of the response, respectively. The results showed that the response time depended on the distance between the receptor and motor, indicating that the decreased CheY-P concentration induced by serine propagates through the cytoplasm from the receptor-kinase cluster toward the motor with a timing that is explained by the diffusion of CheY and CheY-P molecules. The response time included 240 ms for enzymatic reactions in addition to the time required for diffusion of the signaling molecule. The measured response time and duration of the response also revealed that the E. coli cell senses a similar serine concentration regardless of whether the serine concentration is increasing or decreasing. These detailed quantitative findings increase our understanding of the signal transduction process that occurs inside cells during bacterial chemotaxis.
Introduction
An Escherichia coli cell swims in a liquid environment by rotating the flagella, its locomotive organelles. When all of the flagellar motors rotate in a counterclockwise (CCW) direction, an E. coli cell swims smoothly. In contrast, when one or more of the motors switches to a clockwise (CW) direction, the cell tumbles (1). A cell moves toward favorable conditions by controlling the rotational direction of its flagellar motors in response to an environmental stimulus, through a chemotaxis signaling system (2,3).
In the E. coli chemotaxis signaling system, extracellular chemotactic signals, such as chemicals, temperature, and pH, are detected by chemoreceptors located primarily at one of the cell poles (3). The chemoreceptor modulates the autophosphorylation activity of a histidine protein kinase, CheA, associated with the receptor’s cytoplasmic domain. The chemoreceptors form a large cluster with CheA and another protein, CheW, at the cell pole (4,5). Interactions between the chemotaxis proteins in these clusters are thought to amplify the signal, enabling the E. coli cell to respond to relatively small changes in the concentration of chemotactic chemicals (6). The phosphoryl group on CheA can be rapidly transferred to a response regulator, CheY, and the phosphorylated CheY (CheY-P) binds to a flagellar motor to induce CW rotation (7–10). Previous studies demonstrated a strong cooperative relationship between the CheY-P concentration and the CW bias (the fraction of time spent rotating in the CW direction) by comparing the CW bias among E. coli cells with different CheY-P concentrations, and suggested that the flagellar motor switches its rotational direction stochastically under a certain CheY-P concentration (11,12).
The signaling induced by the sensing of an attractant through receptors is conveyed by a decreased CheY-P concentration in the cytoplasm (8). When the receptors bind an attractant, CheY-P production is inhibited by the suppression of CheA autophosphorylation. The intracellular concentration of CheY-P is decreased by its dephosphorylation by CheZ, which is located at the cell pole with the receptor patch (13). As the CheY-P concentration decreases in the cytoplasm, CheY-P molecules dissociate from the flagellar motor, and the motor changes its rotational direction from CW to CCW (14). Various techniques have been used to measure the responses to chemotactic signals occurring inside live E. coli cells. By measuring the ensemble fluorescence resonance energy transfer (FRET) between chemotactic proteins in a cell population, investigators have determined the properties of the chemotaxis signaling system’s response to applied extracellular signals, including the time constant for the decrease in CheY-P concentration and the kinase sensitivity to stimuli (8,15). The kinetic of the chemotactic response was estimated from the change in swimming behavior of E. coli cells after the photorelease of chemotactic stimuli from caged compounds (16–18). The single-cell response to a chemotactic signal was also investigated by applying an impulse stimulus of attractant or repellent from an iontophoretic pipette (19,20). The latency after the impulse stimulus and the diffusion coefficient of the intracellular signaling molecule were estimated from the cellular response.
In this study, we examined how the temporal change in intracellular CheY-P concentration that is induced by chemotactic stimuli is propagated through the cytoplasm from the receptor patch to the motor by measuring the response of a single targeted cell to an instantaneously applied chemotactic stimulus at high temporal resolution. To apply the chemotactic stimulus, we used the photolysis of caged serine (16–18). With this technique, one can control the application of a chemotactic stimulus within tens of milliseconds and regulate the amount of stimulus by controlling the power and duration of the laser irradiation. In addition, by controlling the area of laser irradiation and monitoring the rotational direction of a motor in real time, one can apply the chemotactic stimulus to only a single targeted cell and initiate it in response to the rotational switching of the motor. Our findings demonstrated that the cellular response time to the photoreleased attractant depended on the distance between the receptor and motor, indicating that the decreased CheY-P concentration induced by attractant recognition was propagated through the cytoplasm from the receptor patch to the flagellar motor. We also demonstrated that the E. coli cells responded to a similar attractant concentration regardless of whether the attractant concentration was increasing or decreasing.
Materials and Methods
E. coli strains, plasmids, and cell growth
EFS031 (RP437, ΔmotAmotB, fliC-sticky) cells harboring pTH2300, which is a pMMB206 derivative carrying motA and motB genes, and pBAD24-GFP-CheW (21) were grown in Tryptone broth (1% bactotryptone, 0.5% NaCl) containing 30 μM isopropyl β-D-1-thiogalactopyranoside, 0.002% arabinose, 25 μg/mL chloramphenicol, and 50 μg/mL ampicillin at 30°C for 5 h.
Synthesis of caged serine
We synthesized (S)-4,5-dimethoxy-2-nitrobenzyl serinate (caged serine) using the reaction scheme shown in Fig. S1 in the Supporting Material. Details regarding the synthesis of caged serine are provided in Section S1.
Rotational measurement of the flagellar motor
Grown cells were harvested from 1 mL of cell culture by centrifugation and suspended in 1 mL of motility buffer (10 NaMB, 10 mM potassium phosphate buffer, pH 7.0; 0.1 mM EDTA-2K, pH 7.0; 10 mM NaCl; and 75 mM KCl). The cells were then centrifuged again and resuspended in 250 μL of 10 NaMB. This cell suspension was loaded into a flow chamber constructed from 18 × 18 and 24 × 50 mm coverslips with a spacer (flow chamber) and incubated for 12 min to allow the cells to attach to the coverslip. To remove unattached cells, the inside of the flow chamber was gently perfused with additional 10 NaMB. Polystyrene beads (diameter (ϕ) 0.5 μm) suspended in 10 NaMB were then injected between the coverslips by perfusion. The mixture was incubated for 15 min to allow the beads to attach to the cells’ flagellar filaments. The space inside the flow chamber was then gently perfused twice with additional 10 NaMB containing the appropriate concentration of caged serine to remove unattached beads and apply the caged serine.
The rotational motions of a bead attached to a flagellum were observed under phase-contrast microscopy (IX71; Olympus, Tokyo, Japan) and captured with a high-speed CCD camera (IPX-VGA210LMCN; Imperx, Boca Raton, FL) at 1255 frames/s (Fig. 1 A). Each captured image was transferred via a high-performance frame-grabber card (NI PCIe-1429; National Instruments, Austin, TX) to a computer for image analysis. During this process, each captured image was recorded on a hard disk drive in the computer using the measurement software Real Time Video Nanometry (RTVN), which we developed using LabVIEW 2009 (National Instruments; see Results and Fig. S4). RTVN was also used to estimate the rotational speed and direction of the flagella from the position of the bead-mass center. When RTVN detected the rotational switching of the flagellar motor from the CCW to CW direction, it sent a 5 V TTL signal from an A/D converter (NI USB-6212; National Instruments) to an electric shutter driver (VCM-D1; Uniblitz, San Diego, CA) to open a mechanical shutter (UHS1 ZM 2; Uniblitz) that was positioned in front of a violet laser beam (KBL-90C-A; Kimmon Koha, Tokyo, Japan). The mechanical shutter was opened for 60 ms in response to the CCW-to-CW rotational switch. The timing of the TTL signal was recorded by the computer along with the rotational velocity of the flagellar motor. For the control experiment without laser irradiation, the timing of a quasi-TTL signal was recorded by the computer to avoid opening the mechanical shutter.
Figure 1.

Measurement of a single-cell response to an instantaneously applied attractant signal. (A) Schematic diagram of the measurement system. (B) Simulated time course of the concentration of released serine. Caged serine at 1000 μM (black line), 750 μM (dashed line), or 500 μM (dotted line) was applied to the observation chamber. Inset: magnified graph of the released serine concentration. The magenta-shaded area in the inset indicates the duration of laser irradiation (60 ms). (C) Cellular response to photoreleased serine in the presence of 1000 μM caged serine (released-serine concentration: 8.6 μM). A violet laser beam was applied at the 13.99 s time point for 60 ms (magenta line). The initial CCW duration refers to the CCW duration immediately after the laser irradiation. (D) Histogram of the initial CCW duration. Blue bars show the histogram of the initial CCW duration from 67 cells in the presence of 8.6 μM released serine after laser irradiation. Gray hatched bars show the histogram of the initial CCW duration from 64 cells in the presence of 1000 μM caged serine without laser irradiation. To see this figure in color, go online.
Measurement of the cellular response to serine photoreleased from caged serine
Caged serine surrounding an E. coli cell on a microscopic field was photolyzed by irradiation with a violet laser beam (wavelength (λ) 405 nm) for 60 ms. For the photorelease of serine, the violet laser beam was reflected by a dichroic mirror (FF495 Di02; Semrock, Lake Forest, IL) and focused on the back focal plane of the objective lens (UPlanFl 40× Na 0.75 Ph2; Olympus). The diameter of the irradiated area was adjusted to 32 μm. The violet laser beam was uniformly applied to the irradiated area, and the energy density of the laser beam in the irradiated area was 370 mW × mm−2. The rate constant for the photolysis of caged serine in the irradiated area was 0.16 s−1 (Section S2). To measure the cellular response, the serine stimulus released by laser irradiation was applied to each cell only once. Approximately 20 cells were measured in each chamber. The distance between the targeted cell and the previous one was more than 200 μm. By simulation, we confirmed that the released serine concentration 200 μm away from the laser-irradiated area was much lower than the concentration required to induce a cellular response (Fig. S5), and we confirmed that 20 repeats of serine photorelease hardly influenced the total serine concentration in the chamber.
Quantification of the distance between the receptor patch and the flagellar motor
After measuring the cellular response of a targeted cell to photoreleased serine, we quantified the distance between the receptor patch and the flagellar motor of the same cell. A fusion protein of green fluorescent protein (GFP) and the chemoreceptor-associated protein CheW was used to visualize the position of the receptor patch in the E. coli cell. To observe the location of GFP-CheW, the optical path was changed (Fig. 1 A). A blue laser beam (λ = 488 nm; Sapphire 488-20-SV; Coherent, Hercules, CA) was reflected by a dichroic mirror (FF495 Di02; Semrock) and focused on the back focal plane of the objective lens (UPlanFl 40× Na 0.75 Ph2; Olympus). The fluorescence, which was passed through the dichroic mirror and the emission filter (FF01-520/35; Semrock), was reflected by the mirror and focused on a second CCD camera (DMK23G618; The Imaging Source, Bremen, Germany). The fluorescence images were recorded at 7.5 frames/s by a second CCD camera. After observing the localization of GFP-CheW, we also recorded phase-contrast images of the bead at 120 frames/s with the second CCD camera to monitor the position of the bead. The distance between the fluorescent focus derived from GFP-CheW and the rotational center of the rotating bead was measured as the distance from the receptor patch to the motor. Note that the blue laser (488 nm) does not contribute to the photolysis of caged serine, because caged serine does not absorb light of this wavelength (Fig. S3 A).
Figure 4.
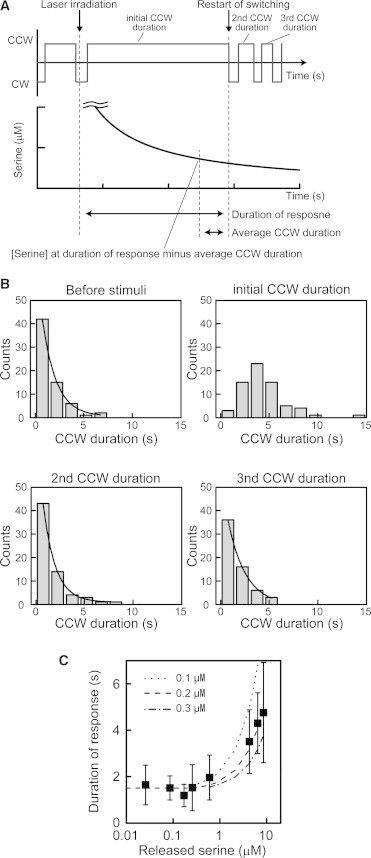
Cellular response to a decrease in serine concentration. (A) Schematic diagram of the analytical method. Top and bottom depictions show the rotational direction of the motor and the simulated time course of the released-serine concentration. The duration of the response is the time span between the laser irradiation and the first CCW-to-CW switch (restart of switching) after the addition of serine stimulus. (B) Histograms of the CCW duration before serine stimulus and of the first, second, and third CCW durations after the stimulus. The CCW duration was measured in the presence of 8.6 μM released serine (n = 66 cells). Histograms of the CCW duration before the serine stimulus and the initial CCW duration after the stimulus are the same as those shown in Fig. 1D. Black lines show the fitted curves using a single exponential function. (C) Relationship between the released-serine concentration and the duration of the response. The durations of the response for 0.03 (n = 15 cells), 0.09 (n = 18 cells), 0.17 (n = 19 cells), 0.26 (n = 17 cells), 0.6 (n = 25 cells), 4.3 (n = 17 cells), 6.5 (n = 12 cells), and 8.6 (n = 67 cells) μM released serine are shown (black squares). The dotted lines are the duration of response reproduced from the average CCW duration in the absence of released serine plus the time when the released serine concentration around a cell was reduced to 0.1, 0.2, and 0.3 μM, respectively. The duration of the response was fitted with the average CCW duration in the absence of released serine plus the time when the released serine concentration was reduced to 0.2 μM.
Results
Single-cell response to an instantaneously applied chemotactic signal
To investigate the cellular response to an instantaneously applied chemotactic signal, we used the photolysis of caged serine that we synthesized (Section S1). The caged serine is photolyzed to generate serine upon its irradiation with a violet laser (λ = 405 nm). In our system, the area surrounding the targeted cell (ϕ = 32 μm) was irradiated by the violet laser for 60 ms (Fig. 1 A). The violet laser irradiation induced a quick increase in the serine concentration around the target cell to up to 0.86% of the initial concentration of the caged serine (Fig. 1 B; Sections S2 and S3). After the laser irradiation was stopped, the serine concentration around the targeted cell decreased due to diffusion. Therefore, the cellular response to both the increase and decrease in serine concentration could be investigated. In this study, the maximum serine concentration obtained by the photolysis of caged serine was defined as the released-serine concentration. The released-serine concentration was adjusted by changing the concentration of caged serine in the motility buffer.
To measure the rotational direction of the flagellar motor, polystyrene beads (ϕ = 0.5 μm) were attached to the sticky flagellar stub (22). The phase-contrast image of a bead was recorded with a high-speed CCD camera (1255 frames/s), and the rotational speed and direction were determined by calculating the angular velocity from the bead’s position. For this study, we developed measurement software named RTVN to investigate the cellular response to the photoreleased serine (Fig. 1 A, Materials and Methods, and Section S4). RTVN monitored the rotational direction of the flagellar motor in real time from the images of a bead captured by a high-speed camera, and controlled the opening (when a CCW-to-CW switch was detected) and closing of a mechanical shutter positioned in front of a violet laser (Fig. 1 A).
Fig. 1 C shows a typical result for the response of an E. coli cell to photoreleased serine. We determined the initial CCW duration, which was the first CCW duration after the laser irradiation (or after the quasi-TTL signal without laser irradiation for the control condition). After laser irradiation, the initial CCW rotation in the presence of 1000 μM caged serine (released-serine concentration, 8.6 μM) lasted for 4.5 ± 2.2 s, which was significantly longer than the duration in the absence of laser irradiation (Fig. 1, C and D; Table S1). The prolonged initial CCW duration was not detected after laser irradiation in the absence of caged serine (Table S1). Moreover, no artificial effects of the laser irradiation on the CW bias or rotational velocity were observed (Table S2). These results indicated that the E. coli cells responded to the photoreleased serine and that the laser irradiation itself did not affect the cellular response. Therefore, the initial CCW duration was the cellular response of E. coli to the photoreleased serine.
Cellular response time to an instantaneously applied chemotactic signal
In this study, to determine the time spent on the propagation of the intracellular signaling and elucidate how the decreased CheY-P concentration, which is induced by serine recognition, propagates in the cytoplasm of a live E. coli cell, serine was photoreleased in response to a rotational switch from the CCW to CW direction, and the cellular response to the instantaneously applied serine stimulus was measured at high temporal resolution. In the presence of photoreleased serine, we defined the response time as the CW duration immediately after the laser irradiation, regardless of the presence or absence of a cellular response (Fig. 2 A). The cellular response time was measured in the presence of 1000 μM caged serine (8.6 μM released serine). In the experiment shown in Fig. 2 A, the laser causing the photorelease of serine was applied 31 ms after the CCW-to-CW switching of the motor, and the irradiation was set to last for 60 ms. The rotational direction of the flagellar motor switched back to the CCW direction 221 ms (response time) after starting the photorelease of serine. In the presence of photoreleased serine, the average response time of the cell was 310 ± 120 ms (Fig. 2 B; Table S1). On the other hand, in the presence of caged serine with no laser irradiation (Fig. 2 B; Table S1), the average CW duration, which was immediately after the quasi-TTL signal, was 670 ± 340 ms. When the violet laser was applied in the absence of caged serine (Table S1), the average CW duration immediately after the laser irradiation was 640 ± 410 ms. These results were consistent with the previously reported responses of E. coli to instantaneously applied α-methyl aspartate (αMeAsp), measured using iontophoretic delivery to a single targeted tethered cell (19). Therefore, the measured response time represents the time spent on intracellular signaling, which includes the recognition of serine by receptors, the inactivation of CheA activity, the decrease in CheY-P concentration, the propagation of CheY and CheY-P proteins, and the rotational switching caused by the dissociation of CheY-P molecules from the motor. The response times to the released serine were not correlated with the CW biases of the targeted cells before the photorelease of serine (Fig. 2 C), as reported previously (19).
Figure 2.

Measurement of cellular response time. (A) Response time after laser irradiation in the presence of 8.6 μM released serine. The magenta-shaded area indicates the duration of irradiation (60 ms) by a violet laser, initiated in response to the CCW-to-CW switch. The duration between the initiation of laser irradiation and the first CW-to-CCW switch was defined as the response time. (B) Histogram of the response time. Blue bars show the histogram of the response time from 67 cells in the presence of 8.6 μM released serine. Gray hatched bars show the histogram of the CW duration from 64 cells in the presence of 1000 μM caged serine without laser irradiation. Black solid and broken lines show the data fitted to a Gaussian curve. (C) Response time and CW bias. The response time in the presence of 4.3 (n = 11 cells), 6.4 (n = 7 cells) and 8.6 μM (n = 29 cells) released serine was plotted against the CW bias (red squares). The blue line shows the linear approximation. The black broken line shows the relationship between the response time and the CW bias reported by Segall and co-workers (19). To see this figure in color, go online.
Distance dependency of the response time
To examine how the decreased CheY-P concentration induced by serine recognition propagates in the E. coli cytoplasm, we investigated the relationship between the response time and the distance from the receptor patch to the motor (see Materials and Methods). To visualize the position of the receptor patch, a GFP-fused form of CheW (GFP-CheW), one of the components of the receptor patch, was produced in the cells and observed by means of the same microscope system (Figs. 1 A and 3 A). To analyze the distance dependency of the response time, the response time was measured in cells that had a single receptor patch at one of the cell poles. The cellular response time was measured in the presence of a saturated concentration of caged serine to induce the cellular response (Fig. 3 C; results are discussed in the next section).
Figure 3.
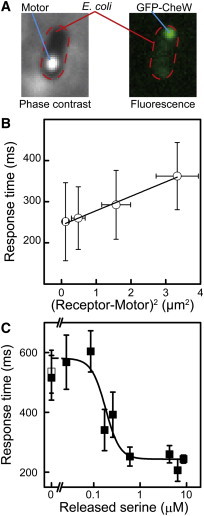
Relationship between the response time and the distance from the receptor to the motor. (A) Phase-contrast image of a cell (left) and the localization of GFP-CheW (right). Red broken lines in both images indicate the cell body. (B) Relationship between the response time and the distance from the receptor to the motor. Error bars show the SD for distance and response time. The response times in the presence of 4.3 (n = 11 cells), 6.4 (n = 7 cells), and 8.6 μM (n = 29 cells) released serine are shown. (C) Relationship between the response time and the released serine concentration (black squares). The response times for 0.03 μM (n = 7 cells), 0.09 μM (n = 15 cells), 0.17 μM (n = 7 cells), 0.26 μM (n = 11 cells), 0.6 μM (n = 16 cells), 4.3 μM (n = 11 cells), 6.5 μM (n = 7 cells), and 8.6 μM (n = 29 cells) released serine are shown. The black line indicates the fitted curve using the Hill equation (Materials and Methods). The white square indicates the CW duration without laser irradiation (n = 14 cells). Error bars show the SE. To see this figure in color, go online.
The response time was plotted against the distance between the receptor patch and the motor (Fig. 3 B). The response time increased as the distance between the motor and receptor patch increased. The difference in response time that depended on the distance from the receptor patch was consistent with the simulated time difference in FliM occupancy between two motors during the decrease in CheY-P concentration (23). These results suggested that the decreased CheY-P concentration induced by serine recognition propagated through the cytoplasm from the receptor patch toward the other cellular pole, reaching a motor in several hundreds of milliseconds. The diffusion coefficient estimated from the slope of the approximation line was 14.3 ± 0.8 μm2/s (mean ± SE; Fig. 3 B; Section S7), in agreement with the estimate obtained in previous studies (20,21). These results suggested that the distance dependency of the response time represents the time required for the diffusion of CheY and CheY-P molecules. The approximation line had an intercept at 243 ± 4 ms (mean ± SE), indicating that the intracellular signaling required ∼240 ms in addition to the time needed for the diffusion of CheY and CheY-P molecules.
Cellular response to increasing serine concentrations around a cell
The final output of the chemotaxis signaling system is the rotational direction of the flagellar motor. To investigate the sensitivity of the cellular response in E. coli cells to an increasing concentration of serine, the relationship between the response time and the concentration of released serine was evaluated (Fig. 3 C). To assess the cellular sensitivity excluding the distance dependency of the response time (Fig. 3 B), the time required for the diffusion of CheY and CheY-P molecules was subtracted from the measured response time (Section S8). When the released-serine concentration was <0.1 μM, the CW duration immediately after releasing serine was constant at ∼600 ms, which was comparable to the CW duration observed immediately after the quasi TTL signal, in the absence of serine photorelease (Fig. 2 B; Table S1). On the other hand, a constant response time of ∼250 ms was observed when the released serine concentration was >0.6 μM. Similarly, the response time to αMeAsp is constant above its critical concentration (19). The apparent Hill coefficient and dissociation constant were estimated from the relationship between the response time and the released-serine concentration using the Hill equation (Section S8). The apparent Hill coefficient was 2.9 ± 1.8 (mean ± SE), indicating that there was positive cooperativity in the signal-transduction process from the recognition of serine to the rotational switching of the motor. The apparent dissociation constant was calculated to be 0.18 ± 0.06 μM (mean ± SE), which was consistent with the value estimated from the ensemble FRET observed between chemotactic proteins in a cell population (24) and from the kinase activity in nonmethylated receptor clusters measured in vitro (25). Therefore, an E. coli cell, adapted to a condition without serine, responded when the serine concentration increased to ∼0.2 μM.
Cellular response at decreasing serine concentrations around a cell
In our experimental system, after the laser irradiation was stopped, the released-serine concentration around the cell decreased (Fig. 1 B). Therefore, the cellular response to the decrease in serine concentration could be assessed. In the presence of 8.6 μM of released serine, the initial CCW duration (i.e., the duration of the first CCW rotation after the serine stimulus) was significantly prolonged by the serine signal (Figs. 1 D and 4, A and B). The distributions of the CCW duration before the serine stimulus and of the second and third CCW durations after the stimulus were all fitted with a single exponential function. The time constants of the CCW duration before the serine stimulus and of the second and third CCW durations were 1.4 ± 0.1 s (n = 66 cells), 1.3 ± 0.1 s (n = 66 cells), and 1.8 ± 0.2 s (n = 61 cells) (mean ± SE), respectively. These results indicated that the distributions of the second and third CCW durations were comparable to that of the CCW duration before the serine stimulus. Therefore, the prolonged initial CCW duration represented the response to the applied serine stimulus, and the cell had recovered from the serine stimulus at the second and third CCW durations.
To understand the relationship between the duration of cellular response and the decrease in serine concentration, the released serine concentration at the end of the response duration was investigated (Fig. 4). The duration of the response was defined as the time span from the laser irradiation to the first CCW-to-CW switch (the restart of switching) after the addition of serine stimulus (Fig. 4 A). When the released-serine concentration was <0.6 μM, the duration of the response was constant and comparable to the CCW duration without the serine signal (Fig. 4 C; Table S1). On the other hand, when the released-serine concentration was >0.6 μM, the duration of the response was prolonged in a manner that depended on the released serine concentration around the cell. This prolonged duration of response was not due to the cell’s adaptation to the applied serine, because the initial CCW duration was much shorter than the time required for a cell to adapt to a serine concentration of several micromolar (∼120 s; Section S9 and Fig. S8) and the time constant for the receptor methylation responsible for the adaptation (∼500 s) (26). The estimated serine concentration at the end of the duration of the response was 0.17 ± 0.11 μM (n = 96 cells) regardless of the difference in released serine concentration. Therefore, an E. coli cell that had adapted to a 0 μM serine condition recovered from a serine response when the serine concentration was reduced to ∼0.2 μM.
Discussion
An E. coli cell senses environmental changes and regulates the rotation of its flagellar motors using a chemotaxis signaling system. In this study, using the photolysis of caged serine and our RTVN measurement system, we were able to measure the chemotactic response of a single cell to an instantaneously applied chemotactic signal at a temporal resolution of 0.8 ms. These analyses demonstrated that some parameters were consistent with previous estimations and revealed the dynamics of intracellular signaling molecules in the cytoplasm of a live E. coli cell during a chemotactic response, as well as the cellular sensitivity to an increase and decrease in the attractant’s concentration.
By taking advantage of the photolysis of caged serine, we measured the cellular response to a chemotactic signal applied instantaneously when the motor switched its rotational direction from CCW to CW. The average response time was 310 ms (Fig. 2 B). A similar response time was reported as ∼250 ms of latency after an impulse stimulus of αMeAsp delivered by iontophoretic pipette to a tethered cell (19). These results suggest that an E. coli cell requires several hundred milliseconds to process the signal and respond to an applied attractant stimulus, regardless of the attractant chemical.
In this study, we demonstrated the relationship between the response time and the distance from the receptor patch to a motor. This relationship indicated that the response time could be divided into two components (Fig. 3 B): one that depends on the distance between the receptor patch and the motor (the slope of the approximation line), and one that is independent of this distance (the intercept of the approximation line). The serine recognition is converted to a decrease in intracellular CheY-P concentration after the suppression of CheA’s autophosphorylation activity, and the decrease in CheY-P concentration propagates through the cytoplasm. The distance dependency of the response time indicates that the decrease in CheY-P concentration, which is generated at the polar localized-receptor patch, is delayed in reaching the motor owing to the diffusion of CheY and CheY-P molecules in the cytoplasm that is closed by the cell membrane. This idea is consistent with the calculation made using a Smoldyn simulation of FliM occupancy (23,27). In the Smoldyn simulation, the FliM occupancies of two motors positioned 0.2 and 1.8 μm away from the receptor patch were decreased, with a time difference of ∼100 ms between them. This time difference is consistent with the distance dependency of the response time that we measured. In the Smoldyn simulation, the time difference of FliM occupancy between two motors was reproduced by assuming the diffusion of CheY and CheY-P molecules and the polar localization of CheZ, which dephosphorylates CheY-P (8,13). Therefore, in a living E. coli cell, the diffusion of CheY-P and CheY molecules and the dephosphorylation of CheY-P at the receptor patch play key roles in the directed propagation of the decreased CheY-P concentration. From the distance dependency of the response time, we estimated the diffusion coefficient of the CheY and CheY-P molecules to be 14.3 ± 0.8 μm2/s. The diffusion coefficient of CheY in filamentous cells after an impulse stimulus from an iontophoretic pipette was estimated to be 10 μm2/s (20). The diffusion coefficient of CheY estimated from the time difference of switching between two motors was 11.7 μm2/s (21). The diffusion coefficient of GFP-fused CheY estimated by fluorescence correlation spectroscopy was 4.6 μm2/s (12). By tracking a single protein molecule in a live E. coli cell, English et al. (28) determined the diffusion coefficient of a fluorescent protein with a molecular mass comparable to that of CheY to be 8–16 μm2/s. Our estimated diffusion coefficient of CheY and CheY-P is consistent with the values estimated in previous investigations. Therefore, the component in the response time that depends on the distance from the receptor patch is derived from the time of diffusion of CheY and CheY-P molecules in the cytoplasm of a live E. coli cell.
We found that the response time also included a component that did not depend on the distance from the receptor patch, represented by the intercept in Fig. 3 B. This component included the time required for some enzymatic reactions, such as the dephosphorylation of CheY-P, the inactivation of CheA’s activity in the receptor patch, the dissociation of CheY-P from the flagellar motor, and the conformational change of the flagellar motor. Therefore, the intercept for the approximation line (tReaction) of the relationship between the response time and the distance from the receptor patch represents the time of these enzymatic reactions occurring in a live E. coli cell in response to serine. These times were estimated in previous reports. By measuring the ensemble FRET between CheY-YFP and CFP-FliM in a cell population after photoreleasing aspartate from a caged compound, Sourjik and Berg (8) determined the time constant for the dephosphorylation of CheY-P by CheZ to be ∼450 ms. In other reports, a similar time constant (∼330 ms) for the dephosphorylation of CheY-P was obtained (15). The inclusion of a 65 ms response delay in tReaction was also reported (8). On the other hand, the off-rate of CheY-P’s binding to FliM was reported to be <67 ms and the time required for a conformational change of the flagellar motor was reported to be ∼20 ms (8,29), both of which are shorter than the time required for CheY-P’s dephosphorylation. The recognition of attractant by the receptor and the inactivation of the autophosphorylation activity of CheA were thought to be fast enough to ignore (8). According to these previous investigations, the majority of the tReaction is the time required for CheY-P’s dephosphorylation by CheZ. Some other stochastic components, such as the size of the drop in CheY-P concentration, the time it takes for the drop in CheY-P concentration to propagate to the motor, and the stochastic switching of the motor under a certain CheY-P concentration, should be incorporated into the response time. However, we did not distinguish these components from the response time that was measured in this study. In addition, the time required for the oligomerization of CheZ might be included in the tReaction, as proposed in the previous Smoldyn simulation (23).
In our measurements, the response time was comparable to the CW duration in the absence of serine stimulus when less than 0.1 μM serine was applied (Fig. 3 C). On the other hand, the response time was shorter and constant (∼240 ms) when serine was added at 0.6 μM or higher. Therefore, an E. coli cell that is adapted to a condition without serine could respond to serine above 0.1 μM. In a previous study, the effect of serine concentration on the kinase activity was estimated by the ensemble FRET between chemotactic proteins in a cell population (24,30). In that study, the kinase activity in the receptor patch was altered by a range of serine concentrations similar to the cellular responsse we measured, and the activity was inhibited when the serine concentration was above 1 μM. A similar result was reported for the kinase activity in a nonmethylated receptor cluster measured in vitro (25). Therefore, the cellular sensitivity defined by the response time was comparable to the sensitivity of the kinase activity for the applied serine. The apparent dissociation constant estimated from the relationship between the response time and the released serine concentration was 0.18 μM. Therefore, E. coli cells that are adapted to a condition without serine exhibit a narrow dynamic range of cellular sensitivity in which they respond to increasing serine concentrations over 0.18 μM, which is derived from the sensitivity of the kinase activity in the receptor patch.
The estimated dissociation constant (0.18 μM) for the serine concentration is much smaller than the apparent dissociation constant for serine’s binding to its receptor, Tsr (35.6 μM) (31), suggesting that the receptor patch is more sensitive to serine recognition than the Tsr monomer for inhibiting the autophosphorylation activity of CheA. If there were no cooperativity in the binding of serine to Tsr, the occupancy of the Tsr by serine could be estimated by Roccu = [S] / ([S] + KDTsr) (19), where Roccu, [S], and KDTsr are the receptor occupancy, serine concentration, and apparent dissociation constant of Tsr for serine, respectively. The receptor occupancy at 0.6 μM serine was estimated to be 1.7%. This means that if 10,000 of Tsr molecules are incorporated into a receptor patch (32), an E. coli cell that is adapted to 0 μM serine will exhibit the maximum response to serine when only 170 Tsr molecules are occupied by serine. A similar estimation was proposed for the receptor occupancy in the receptor patch for αMeAsp (19). In that case, it was demonstrated that cells exhibit a response time of ∼0.2 s when the change in receptor occupancy is as small as 2%, and that larger changes in receptor occupancy do not change the response time. Fitting to the Hill equation suggested cooperative processes in the chemotactic response reactions, such as the binding of serine by Tsr, the inhibition of CheA’s activity, the dephosphorylation of CheY-P, the dissociation of CheY-P from the motor, and the conformational change of the motor from a CW to a CCW state. As discussed above, the sensitivity of the cellular response (Fig. 3 C) and the sensitivity of kinase activity to serine (24,25) were comparable. This result suggests that the cellular sensitivity to serine might be derived from a cooperative mechanism at the receptor patch, as proposed previously (6), in which the change in the activity of chemoreceptors by the binding of attractant propagates to the surrounding, nonbound chemoreceptors. Therefore, by the clustering of receptor molecules and their cooperative function in a receptor patch, an E. coli cell can sense serine concentrations lower than the dissociation constant of Tsr. It is known that E. coli cells can shift the range of detectable serine concentrations by changing the receptor occupancy required for serine-recognition through receptor methylation; consequently, an E. coli cell could detect a wide range of serine concentrations (33).
Using an instantaneously applied serine signal, we also measured the cellular response to a decrease in serine concentration. In our system, only the initial CCW duration was significantly prolonged by the addition of the serine stimulus, whereas the distribution of the second and third CCW durations after the stimulus were comparable to that of the CCW duration before the serine stimulus (Fig. 4 B). These results indicated that only the initial CCW duration represented the cellular response to the decrease in serine concentration, and the cell had recovered by the time of the second and third CCW durations. It was recently shown that two flagellar motors on the same cell coordinately switch their rotational direction (21,34) and that the binding of CheY-P to a motor is essential to induce CW rotation (14). These findings indicated that CheY-P molecules bind to two flagellar motors with similar timing to generate switching coordination. Therefore, we propose that as a result of the spontaneous and cooperative activation or inactivation of the receptor patch, an increase or decrease in CheY-P concentration occurs for every switching event under steady-state conditions in wild-type E. coli cells. Such a dynamic change in the CheY-P concentration causes a large change in the probability of rotational switching of the motor. The restart of rotational switching after the initial CCW duration is probably due to a restart of the spontaneous activation and inactivation of the receptor patch, and consequent induction of increased and decreased CheY-P concentrations in a wild-type E. coli cell.
The duration of the response defined in Fig. 4 A includes the time interval required for spontaneous activation of the receptor patch after a reduction in the serine concentration. The time interval required for the spontaneous activation would correspond to the average CCW duration in the absence of a serine stimulus. The duration of the cellular response was represented by the time when the released serine concentration was reduced to 0.2 μM plus the average CCW duration in the absence of serine stimulus. Therefore, an E. coli cell that is adapted to the condition without serine would sense the decrease in serine concentration after the photorelease of serine and recover from the response at ∼0.2 μM. These results indicate that the E. coli cells respond to a similar serine concentration regardless of whether the attractant concentration is increasing or decreasing, suggesting that there is no hysteresis in the recognition for either the increase or the decrease in serine concentration in an E. coli cell. Previous studies demonstrated a strong cooperative relationship between the CheY-P concentration and the CW bias (the fraction of time spent rotating in the CW direction) by comparing the CW bias among E. coli cells that contained different CheY-P concentrations (11,12), indicating that the CW bias can be used to estimate the intracellular concentration of CheY-P. Because the switching probability would depend on the decrease in CheY-P concentration after addition of the serine stimulus, the initial CheY-P concentration upon addition of the serine stimulus should affect the length of the response time. Therefore, if the CW bias represents the intracellular concentration of CheY-P in the steady state of a wild-type cell, the length of the response time should also correlate with the CW bias. In this study, we measured the response time of cells that had a different CW bias, from 0.1 to 0.4, and found that the response times were not correlated with the CW bias (Fig. 2 C). A similar lack of correlation between the response time and the cell’s CW bias (0.1–0.7) was also reported in a previous article (19). Thus, the cellular response time is similar even if the cells have a different CW bias, indicating that the initial CheY-P concentration upon addition of the serine stimulus was similar among the cells with different CW biases. Therefore, the CW bias would not represent the intracellular concentration of CheY-P in cells with an intact chemotaxis system. As discussed above, to coordinate the rotational switching between two motors by binding CheY-P, the change in CheY-P concentration, which changes the probability of rotational switching of the motor, would occur during every switching event under steady-state conditions in a wild-type E. coli cell. Therefore, the CW bias might represent the probability for the activation and inactivation of a receptor patch to produce the dynamic change in CheY-P concentration in a cell with an intact chemotaxis system.
In this study, the intracellular signaling and cellular response of E. coli induced by an attractant were quantitatively determined in a single E. coli cell. The measured sensitivity of the single-cell response for an instantaneously applied serine stimulus was confirmed to be comparable to that of the kinase activity in a receptor patch estimated from previous in vitro and in vivo investigations. We also demonstrated that an E. coli cell that has originally adapted to a no-serine condition recognizes the same concentration of serine regardless of whether the serine concentration is increasing or decreasing. Our single-cell measurements demonstrated that the directed propagation of a decreased CheY-P concentration, which is derived from the diffusion of CheY and CheY-P molecules, is involved in E. coli’s intracellular signaling for an attractant. These quantitative measurements of cellular behavior and the dynamics of protein molecules in a cell at the moment of cellular response provide, to our knowledge, new perspectives for understanding the signal transduction process in the E. coli chemotaxis system.
Acknowledgments
We thank Prof. Ikuro Kawagishi (Hosei University), Dr. Yoshiyuki Sowa (Hosei University), Dr. Tatsuo Shibata (RIKEN), Dr. Hiroto Tanaka (NICT), and Dr. Hiroaki Kojima (NICT) for useful discussions.
This work was supported by Grants-in-Aid for Scientific Research from MEXT KAKENHI (23115004 to A. I.) and JSPS KAKENHI (24657098 to A. I.). This work was supported in part by the Management Expenses Grants for National Universities Corporations from the Ministry of Education, Culture,Sports, Science and Technology of Japan (MEXT).
Supporting Material
Supporting Citations
References (35,36) appear in the Supporting Material.
References
- 1.Darnton N.C., Turner L., Berg H.C. On torque and tumbling in swimming Escherichia coli. J. Bacteriol. 2007;189:1756–1764. doi: 10.1128/JB.01501-06. [DOI] [PMC free article] [PubMed] [Google Scholar]
- 2.Macnab, R. 1996. Flagella and motility. In Escherichia coli and Salmonella. F. C. Neidhardt, editor in chief. American Society for Microbiology, Washington, DC. 123–145.
- 3.Wadhams G.H., Armitage J.P. Making sense of it all: bacterial chemotaxis. Nat. Rev. Mol. Cell Biol. 2004;5:1024–1037. doi: 10.1038/nrm1524. [DOI] [PubMed] [Google Scholar]
- 4.Kim S.H., Wang W., Kim K.K. Dynamic and clustering model of bacterial chemotaxis receptors: structural basis for signaling and high sensitivity. Proc. Natl. Acad. Sci. USA. 2002;99:11611–11615. doi: 10.1073/pnas.132376499. [DOI] [PMC free article] [PubMed] [Google Scholar]
- 5.Briegel A., Ortega D.R., Jensen G.J. Universal architecture of bacterial chemoreceptor arrays. Proc. Natl. Acad. Sci. USA. 2009;106:17181–17186. doi: 10.1073/pnas.0905181106. [DOI] [PMC free article] [PubMed] [Google Scholar]
- 6.Bray D., Levin M.D., Morton-Firth C.J. Receptor clustering as a cellular mechanism to control sensitivity. Nature. 1998;393:85–88. doi: 10.1038/30018. [DOI] [PubMed] [Google Scholar]
- 7.Stewart R.C. Kinetic characterization of phosphotransfer between CheA and CheY in the bacterial chemotaxis signal transduction pathway. Biochemistry. 1997;36:2030–2040. doi: 10.1021/bi962261k. [DOI] [PubMed] [Google Scholar]
- 8.Sourjik V., Berg H.C. Binding of the Escherichia coli response regulator CheY to its target measured in vivo by fluorescence resonance energy transfer. Proc. Natl. Acad. Sci. USA. 2002;99:12669–12674. doi: 10.1073/pnas.192463199. [DOI] [PMC free article] [PubMed] [Google Scholar]
- 9.Bren A., Eisenbach M. The N terminus of the flagellar switch protein, FliM, is the binding domain for the chemotactic response regulator, CheY. J. Mol. Biol. 1998;278:507–514. doi: 10.1006/jmbi.1998.1730. [DOI] [PubMed] [Google Scholar]
- 10.Welch M., Oosawa K., Eisenbach M. Phosphorylation-dependent binding of a signal molecule to the flagellar switch of bacteria. Proc. Natl. Acad. Sci. USA. 1993;90:8787–8791. doi: 10.1073/pnas.90.19.8787. [DOI] [PMC free article] [PubMed] [Google Scholar]
- 11.Scharf B.E., Fahrner K.A., Berg H.C. Control of direction of flagellar rotation in bacterial chemotaxis. Proc. Natl. Acad. Sci. USA. 1998;95:201–206. doi: 10.1073/pnas.95.1.201. [DOI] [PMC free article] [PubMed] [Google Scholar]
- 12.Cluzel P., Surette M., Leibler S. An ultrasensitive bacterial motor revealed by monitoring signaling proteins in single cells. Science. 2000;287:1652–1655. doi: 10.1126/science.287.5458.1652. [DOI] [PubMed] [Google Scholar]
- 13.Cantwell B.J., Draheim R.R., Manson M.D. CheZ phosphatase localizes to chemoreceptor patches via CheA-short. J. Bacteriol. 2003;185:2354–2361. doi: 10.1128/JB.185.7.2354-2361.2003. [DOI] [PMC free article] [PubMed] [Google Scholar]
- 14.Fukuoka H., Sagawa T., Ishijima A. Direct imaging of intracellular signaling components that regulate bacterial chemotaxis. Sci. Signal. 2014;7:ra32. doi: 10.1126/scisignal.2004963. [DOI] [PubMed] [Google Scholar]
- 15.Kentner D., Sourjik V. Dynamic map of protein interactions in the Escherichia coli chemotaxis pathway. Mol. Syst. Biol. 2009;5:238. doi: 10.1038/msb.2008.77. [DOI] [PMC free article] [PubMed] [Google Scholar]
- 16.Khan S., Castellano F., Trentham D.R. Excitatory signaling in bacterial probed by caged chemoeffectors. Biophys. J. 1993;65:2368–2382. doi: 10.1016/S0006-3495(93)81317-1. [DOI] [PMC free article] [PubMed] [Google Scholar]
- 17.Khan S., Spudich J.L., Trentham D.R. Chemotactic signal integration in bacteria. Proc. Natl. Acad. Sci. USA. 1995;92:9757–9761. doi: 10.1073/pnas.92.21.9757. [DOI] [PMC free article] [PubMed] [Google Scholar]
- 18.Jasuja R., Keyoung J., Khan S. Chemotactic responses of Escherichia coli to small jumps of photoreleased L-aspartate. Biophys. J. 1999;76:1706–1719. doi: 10.1016/S0006-3495(99)77329-7. [DOI] [PMC free article] [PubMed] [Google Scholar]
- 19.Segall J.E., Manson M.D., Berg H.C. Signal processing times in bacterial chemotaxis. Nature. 1982;296:855–857. doi: 10.1038/296855a0. [DOI] [PubMed] [Google Scholar]
- 20.Segall J.E., Ishihara A., Berg H.C. Chemotactic signaling in filamentous cells of Escherichia coli. J. Bacteriol. 1985;161:51–59. doi: 10.1128/jb.161.1.51-59.1985. [DOI] [PMC free article] [PubMed] [Google Scholar]
- 21.Terasawa S., Fukuoka H., Ishijima A. Coordinated reversal of flagellar motors on a single Escherichia coli cell. Biophys. J. 2011;100:2193–2200. doi: 10.1016/j.bpj.2011.03.030. [DOI] [PMC free article] [PubMed] [Google Scholar]
- 22.Ryu W.S., Berry R.M., Berg H.C. Torque-generating units of the flagellar motor of Escherichia coli have a high duty ratio. Nature. 2000;403:444–447. doi: 10.1038/35000233. [DOI] [PubMed] [Google Scholar]
- 23.Lipkow K. Changing cellular location of CheZ predicted by molecular simulations. PLOS Comput. Biol. 2006;2:e39. doi: 10.1371/journal.pcbi.0020039. [DOI] [PMC free article] [PubMed] [Google Scholar]
- 24.Vaknin A., Berg H.C. Single-cell FRET imaging of phosphatase activity in the Escherichia coli chemotaxis system. Proc. Natl. Acad. Sci. USA. 2004;101:17072–17077. doi: 10.1073/pnas.0407812101. [DOI] [PMC free article] [PubMed] [Google Scholar]
- 25.Li G., Weis R.M. Covalent modification regulates ligand binding to receptor complexes in the chemosensory system of Escherichia coli. Cell. 2000;100:357–365. doi: 10.1016/s0092-8674(00)80671-6. [DOI] [PubMed] [Google Scholar]
- 26.Terwilliger T.C., Wang J.Y., Koshland D.E., Jr. Kinetics of receptor modification. The multiply methylated aspartate receptors involved in bacterial chemotaxis. J. Biol. Chem. 1986;261:10814–10820. [PubMed] [Google Scholar]
- 27.Lipkow K., Andrews S.S., Bray D. Simulated diffusion of phosphorylated CheY through the cytoplasm of Escherichia coli. J. Bacteriol. 2005;187:45–53. doi: 10.1128/JB.187.1.45-53.2005. [DOI] [PMC free article] [PubMed] [Google Scholar]
- 28.English B.P., Hauryliuk V., Elf J. Single-molecule investigations of the stringent response machinery in living bacterial cells. Proc. Natl. Acad. Sci. USA. 2011;108:E365–E373. doi: 10.1073/pnas.1102255108. [DOI] [PMC free article] [PubMed] [Google Scholar]
- 29.Bai F., Branch R.W., Berry R.M. Conformational spread as a mechanism for cooperativity in the bacterial flagellar switch. Science. 2010;327:685–689. doi: 10.1126/science.1182105. [DOI] [PubMed] [Google Scholar]
- 30.Frank V., Koler M., Vaknin A. The physical and functional thermal sensitivity of bacterial chemoreceptors. J. Mol. Biol. 2011;411:554–566. doi: 10.1016/j.jmb.2011.06.006. [DOI] [PubMed] [Google Scholar]
- 31.Tajima H., Imada K., Kawagishi I. Ligand specificity determined by differentially arranged common ligand-binding residues in bacterial amino acid chemoreceptors Tsr and Tar. J. Biol. Chem. 2011;286:42200–42210. doi: 10.1074/jbc.M111.221887. [DOI] [PMC free article] [PubMed] [Google Scholar]
- 32.Li M., Hazelbauer G.L. Cellular stoichiometry of the components of the chemotaxis signaling complex. J. Bacteriol. 2004;186:3687–3694. doi: 10.1128/JB.186.12.3687-3694.2004. [DOI] [PMC free article] [PubMed] [Google Scholar]
- 33.Han X.S., Parkinson J.S. An unorthodox sensory adaptation site in the Escherichia coli serine chemoreceptor. J. Bacteriol. 2014;196:641–649. doi: 10.1128/JB.01164-13. [DOI] [PMC free article] [PubMed] [Google Scholar]
- 34.Mears P.J., Koirala S., Chemla Y.R. Escherichia coli swimming is robust against variations in flagellar number. eLife. 2014;3:e01916. doi: 10.7554/eLife.01916. [DOI] [PMC free article] [PubMed] [Google Scholar]
- 35.Longsworth L.G. Diffusion measurements, at 25°, of aqueous solutions of amino acids, peptides and sugars. J. Am. Chem. Soc. 1953;75:5705–5709. [Google Scholar]
- 36.Coe J.R., Jr., Godfrey T.B. Viscosity of water. J. Appl. Phys. 1944;15:625–626. [Google Scholar]
Associated Data
This section collects any data citations, data availability statements, or supplementary materials included in this article.