

Abstract
Protein aggregation is linked to more than 30 human pathologies, including Alzheimer’s and Parkinson’s diseases. Since small oligomers that form at the beginning of the fibrillation process probably are the most toxic elements, therapeutic strategies involving fibril fragmentation could be detrimental. An alternative approach, named kinetic inhibition, aims to prevent fibril formation by using small ligands that stabilize the parent protein. The factors that govern fibrillation lag times during kinetic inhibition are largely unknown, notwithstanding their importance for designing effective long-term therapies. Inhibitor-bound species are not likely to be incorporated into the core of mature fibrils, although their presence could alter the kinetics of the fibrillation process. For instance, inhibitor-bound species may act as capping elements that impair the nucleation process and/or fibril growth. Here, we address this issue by studying the effect of two natural inhibitors on the fibrillation behavior of lysozyme at neutral pH. We analyzed a set of 79 fibrillation curves obtained in lysozyme alone and a set of 37 obtained in the presence of inhibitors. We calculated the concentrations of the relevant species at the beginning of the curves using the inhibitor-binding constants measured under the same experimental conditions. We found that inhibitor-bound protein species do not affect fibrillation onset times, which are mainly determined by the concentration of unbound protein species present in equilibrium. In this system, knowledge of the fibrillation kinetics and inhibitor affinities suffices to predict the effect of kinetic inhibitors on fibrillation lag times. In addition, we developed a new methodology to better estimate fibrillation lag times from experimental curves.
Introduction
Protein aggregation is associated with more than 30 human pathologies, including Alzheimer’s disease, Parkinson’s disease, and type II diabetes (1). Since the crucial interactions that stabilize the cross-β-sheet structure of the fibrils found in such diseases are provided by the peptide backbone, the potential to form amyloid structures is an intrinsic property of many naturally expressed proteins. In this sense, several proteins not linked to aggregation pathologies can form amyloid fibers under suitable conditions, which usually involve a perturbation of the native structure (2–4). Moreover, mutations that reduce the conformational stability of proteins can also favor their conversion into structures that are able to form fibrils. For instance, mutations that destabilize the tetrameric assembly of transthyretin (5) or the tertiary structure of lysozyme (6) are linked to the early-onset variants of the associated pathologies. Several strategies have been proposed to treat these diseases (7). The efficacy of any treatment will depend on the molecular nature of the toxic species and their mechanism of toxicity. In this regard, growing evidence points to the small oligomers that form during the initial stages of fibrillation as the most toxic species (8–11). In this scenario, strategies aimed at breaking mature fibrils could be detrimental because they could increment the concentration of these putatively more toxic oligomers. An alternative approach is to reduce the concentration of the small oligomeric forms. This can be achieved either by accelerating their conversion into mature and less toxic fibrils (12) or by inhibiting their formation from the parent soluble protein. For instance, it has been shown that small compounds such as epigallocatechin-3-gallate, an abundant compound in green tea leaves, can favor the formation of innocuous off-pathway oligomeric species (13,14). An alternative approach, termed kinetic inhibition, involves stabilizing the native protein conformation by small ligands to inhibit its initial conversion into oligomers (15). The recent approval of tafamidis to treat the systemic amyloidosis caused by transthyretin illustrates the therapeutic potential of this approach (16). This drug stabilizes the native tetrameric form of the protein, thus inhibiting its dissociation into monomers, the rate-limiting step of this fibrogenic pathway. In some cases, a parallelism between the binding free energy of small compounds and their efficiency to inhibit fibril formation has been observed (17). For example, the concentration of trifluoroethanol that is needed to trigger the fibrillation of human acylphosphatase increases in the presence of anions that bind to the protein, displaying a good correlation with the free energy of stabilization upon binding (18).
Inhibitor-bound protein species are not likely to be incorporated into the core of mature fibrils, although their presence could affect the kinetics of fibrillation. For example, they could act as nucleation sites of fibril growth or may function as capping elements of growing fibrils. In both scenarios, these species would change the kinetics of fibrillation because they would no longer be passive bystanders in the process. In this regard, it has been found that intact, full-length lysozyme inhibits the fibrillation process of the nicked protein that takes place under acidic conditions, presumably by acting as a capping element of the growing protofibrils (19). Given the promising applications of this strategy, it is important to determine whether inhibitor-bound species alter the kinetics of fibrillation processes. In addition, to forecast the outcome of long-term therapies, it would be useful to predict the fibrillation lag times in the presence of kinetic inhibitors. Here, we address these issues by studying the fibrillation kinetics of hen lysozyme, one of the most commonly employed systems in this area of knowledge (20,21). This protein can readily form cross-β-fibrils under diverse experimental conditions, and there are several examples of the effect of small molecules on this process. For instance, the natural lysozyme inhibitor N,N′,N″-triacetylchitotriose (tri-GlcNAc) has been shown to retard lysozyme fibrillation in a dose-dependent manner (22). In this work, we studied the effect of the natural inhibitors N,N′-diacetylchitobiose (di-GlcNAc) and N,N′,N″-triacetylchitotriose on the kinetics of lysozyme fibrillation. As a result, we were able to identify the main factors that govern fibrillation lag times during kinetic inhibition in this system.
Materials and Methods
Materials
Chicken lysozyme (three times crystallized), thioflavin T (ThioT), guanidinium hydrochloride (Gdn-HCl), di-GlcNAc, and tri-GlcNAc were purchased from Sigma-Aldrich (St. Louis, MO).
Lysozyme unfolding studies
For lysozyme unfolding studies, 1 mg/ml lysozyme in 20 mM KH2PO4 (pH 6.3) and the indicated concentrations of Gdn-HCl were incubated for 16 h at 45°C. Fluorescence spectra were acquired at the same temperature in 4 mm path-length fluorescence cells (Starna Cells, Atascadero, CA) using a JASCO FP-6500 spectrofluorometer endowed with a Peltier-effect thermostatized cell holder (JASCO International, Tokyo, Japan). The excitation wavelength was 295 nm and spectra were acquired from 300 to 420 nm at 50 nm/min. Bandpass excitation and emission were 3 nm. The spectra shown are the average of four scans after subtracting the appropriate blanks. Far-UV circular dichroism (CD) spectra were acquired at 45°C in 1 mm cells (Hellma) using a JASCO J-815 spectropolarimeter endowed with a Peltier-effect thermostatized cell holder. The spectra shown are the average of four scans at 50 nm/min after subtracting the appropriate blanks. A model describing a two-state unfolding transition was fitted to the measured fluorescence intensity at 354 nm or the CD signal at 220 nm using the data collected with 0.5–6.5 M Gdn-HCl.
Determination of inhibitor dissociation constants
Inhibitor dissociation constants were determined by titrating a lysozyme solution (10.2 μM) in 20 mM KH2PO4 (pH 6.3) with or without the addition of 3 M Gdn-HCl. Inhibitor binding was followed from the changes of the intrinsic fluorescence of lysozyme using a JASCO FP-6500 spectrofluorometer. Titrations were performed by sequentially adding the ligands from a stock solution made in the same buffer (with or without 3 M Gdn-HCl). The excitation wavelength was set to 295 nm and the emission spectra were recorded from 300 to 400 nm. Bandpass excitation and emission were set to 1 and 5 nm, respectively. Spectra measurements were recorded after an equilibration time of 15 min, when no further changes in the spectra were detected. Each spectrum is the average of four scans. A model considering ligand binding and protein denaturation equilibria were fitted to the recorded fluorescence intensity at 319 nm (see Supporting Material for further details).
Fibril formation experiments
An aliquot of a concentrated solution of lysozyme (30 mg/ml) in 20 mM KH2PO4 (pH 6.3) was diluted in a 1 × 1 cm fluorescence cell (Starna Cells) to reach a final volume of 3 ml and a final concentration of 3 M Gdn-HCl, 20 mM KH2PO4 (pH 6.3). Both solutions were preheated at 45°C. Samples were stirred with a magnetic bar at 500 rpm and kept at 45°C. Fibril formation was followed by light scattering or by ThioT fluorescence using a JASCO FP-6500 spectrofluorometer endowed with a thermostatized cell holder. Light scattering was performed by irradiating and detecting the scattered light at 360 nm. Bandpass excitation and emission were set to 1 nm. For fluorescence detection, ThioT was added to the initial solution to reach a final concentration of 20 μM. Excitation and emission wavelengths were 440 nm (1 nm bandpass) and 485 nm (5 nm bandpass), respectively. In both experiments, the time response of the detector was set to 8 s to reduce noise and data points were acquired every 10 s.
Determination of curve parameters
The relevant kinetic parameters tlag and t1/2 were extracted by fitting the following equation to the data (23):
where F is the fluorescence signal, Fmax is the maximum steady-state fluorescence, tm is the point of the maximum elongation rate, and v describes the asymmetry of the curve. The lag time (tlag) is the time where the tangent at tm crosses the initial baseline and is given by tm − (1 + v)/k. In addition, the growth halftime (t1/2) is given by tm − k−1 × ln((2v − 1)/v). Curve fitting was done with OriginPro 8.6. In addition, we developed a second method to estimate more accurately the time required for the onset of fibrillation. This method is a numeric implementation of a variational approach in which a split derivatable function is fitted to the initial portion of the experimental curves (up to 5% progression). The split function is composed of a linear function (F = a + b × t, for t ≤ τ) followed by a quadratic function (F = a + b × t + c × (t − τ)2, for t > τ). The intersection point between both functions (τ) is used as a variational parameter to generate a set of test functions, which are individually fitted to the experimental data. Numerical calculations were performed with an Excel Visual Basic script written ad hoc. The quadratic error of the fittings for all possible τ displays a global minimum at a particular time (named τlag). This latter parameter accurately reflects the time when the signal first departs from the initial baseline.
Analysis of fibrillation kinetics
The kinetic model developed by Knowles et al. (24) was globally fitted to the lysozyme fibrillation curves measured in the absence of inhibitors. This model takes into account the size of the growth nuclei (nc) and the kinetics constants of primary nucleation (kn), polymerization (k+), and secondary nucleation (k−). The concentration of monomer (M(t)) in the fibers as a function of time is given by
where mtot is the total protein concentration and κ = (2 mtot k+ k−)1/2. In the absence of fibrils at the beginning of the incubation, . To connect the concentration of fibers at a given time with the measured ThioT fluorescence signal, a calibration curve was determined. To this end, we measured the fluorescence intensity of serial dilutions of a fibril sample made with 5 mg/ml lysozyme. A sigmoid curve was fitted to these data. In addition, the detection limit of the assay was estimated by linear extrapolation of the measured signal for the more diluted samples. Global fitting of the kinetic models were performed with OriginPro 8.6 with a script that transforms the concentration of fibers predicted by the kinetic model into its corresponding fluorescence signal using the calibration function. For the fitting procedure, these values were then compared with the experimental measurements.
Fibril formation followed by CD spectroscopy
Fibrillation of 1.5 mg/ml lysozyme with or without the addition of 1.5 mM tri-GlcNAc was followed by light scattering at 360 nm. At the indicated times, aliquots of 25 μl were diluted with 250 μl of 20 mM KH2PO4, 3 M Gdn-HCl (pH 6.3) at 20°C. At this temperature, the fibrillation process halts without reversion of the aggregated products. Far-UV CD spectra were acquired immediately at 20°C in 1 mm cells (Hellma) using a JASCO J-815 spectropolarimeter. The spectra shown are the average of 10 scans acquired at 50 nm/min after blank subtraction.
Transmission electron microscopy and atomic force microscopy sample preparation and imaging
Fibrils that formed with 1.5 mg/ml lysozyme incubated for 10 h with or without the addition of 1.5 mM tri-GlcNAc were centrifuged at 9300 g for 5 min and resuspended in H2O. For atomic force microscopy (AFM), a drop of 20 μl was deposited onto freshly cleaved muscovite mica. After 5 min, the sample was gently washed with 0.5 ml Milli-Q water to remove molecules that were not firmly attached to the mica and blown dry with nitrogen. Tapping-mode AFM was performed using a Multimode-AFM with a Nanoscope IIa-Quadrex controller (Digital Instruments, Veeco Metrology Group; Santa Barbara, CA) with a J-type piezoelectric scanner. Images were processed using WSxM3_0Beta12_5 software (Nanotec, Madrid, Spain) (25). Transmission electron microscopy (TEM) images of fibrils stained during 50 s with 2% (w/v) uranyl acetate were acquired with an EM 301 Philips microscope at 60 kV. All images were taken at the Center of Advanced Microscopy (School of Sciences, University of Buenos Aires).
Results
Lysozyme fibrillation at neutral pH
To understand the mechanism of fibril formation, we first determined the conditions that were required to drive native lysozyme to a fibril-prone state. Gdn-HCl-induced unfolding of lysozyme at 45°C and pH 6.3 under nonreducing conditions was followed by intrinsic fluorescence (Fig. S1 A) and far-UV CD (Fig. S1 B). The aim of this experiment was to characterize the unfolding behavior of lysozyme under these particular conditions, a piece of information that is not available in the literature. Both techniques revealed a major transition centered at 3 M Gdn-HCl. In addition, far-UV CD displayed a minor change at low Gdn-HCl concentrations (<0.5 M), probably due to a small readjustment of the native fold. A two-state unfolding transition model was fitted to both data sets collected with 0.5–6.5 M Gdn-HCl (Fig. S1 C). The ΔGH20 and [Gdn-HCl]50 values calculated from the fluorescence experiment were 27.9 kJ.mol−1 and 2.97 M, respectively. Similar values were obtained from the CD data (ΔGH20 = 28.8 kJ.mol−1, [Gdn-HCl]50 = 3.01 M). This coincidence suggests a two-state unfolding mechanism without significantly populated intermediates. This result is at variance with the thermal unfolding of lysozyme at acidic pH (26,27) or in the presence of trifluoroethanol (28), in which molten globule-like intermediates are populated at equilibrium. On the other hand, the unfolding curve was performed under equilibrium conditions after a 16 h incubation, and therefore the folding intermediates found in kinetic experiments were not detected here (29,30).
Lysozyme incubated at intermediate Gdn-HCl concentrations forms amyloid fibrils within a few hours (31). Here, we employed similar conditions (45°C and 3 M Gdn-HCl) to generate a set of fibrillation curves. ThioT fluorescence (Fig. 1 C) and light scattering at 360 nm (Fig. S2 A) recorded during this process displayed a sigmoid-shaped curve typical of a nucleation-elongation mechanism. Far-UV CD spectra revealed the generation of species rich in β sheet, with an ellipticity minimum at 218 nm (Fig. S2 B). The amyloid nature of the product formed was further confirmed by AFM (Fig. 1 A) and TEM (Fig. S3, A and B).
Figure 1.

Fibril formation by lysozyme. (A and B) AFM image of fibrils formed with 1.5 mg/ml lysozyme (A) without or (B) with the addition of 1.5 mM tri-GlcNAc. (C) Normalized ThioT fluorescence of 79 fibrillation curves with lysozyme concentrations ranging from 5 to 0.025 mg/ml. Individual conditions were measured in quadruplicate, quintuplicate, or sextuplicate. (D) Curve parameters were calculated by fitting a sigmoid function to the experimental curves. In this case, c0 = 0.15 mg/ml.
We generated a set of 79 lysozyme fibrillation curves followed by ThioT fluorescence, and normalized their signal to better compare their shape (Fig. 1 C). The original nonnormalized curves are shown in Fig. S4. The protein concentration spanned over 2 orders of magnitude, ranging from 5 mg/ml (340 μM) to 0.025 mg/ml (1.7 μM). The fluorescence curves were normalized and the kinetic parameters tlag and t1/2 were calculated as described by Pedersen et al. (23) (Fig. 1 D).
Even though ThioT may affect the fibrillation process, the same method was applied for curves generated with and without inhibitors, and any spurious effect would be expected to affect both sets of experiments similarly. The alternative method, which measures ThioT fluorescence of an aliquot, usually involves a 20- to 50-fold dilution of the samples. This procedure impairs the sensitivity of the assay and seriously overestimates the real lag times of the more diluted samples. In the protocol employed here, the ThioT fluorescence signal changes linearly with fibril content at low concentration, i.e., at the beginning of the fibrillation process, and saturates at high fiber concentration. We chose this approach because we were interested in detecting the onset times of fibrillation, and therefore our conclusions are based on this parameter. To find a suitable kinetic model to describe this system, we had to relate the calculated fibril concentrations from the models to the experimental signal. To this end, we performed a calibration curve by measuring the ThioT fluorescence of serial dilutions of a fibril sample generated with 5 mg/ml lysozyme (Fig. S5). A nonlinear response of ThioT fluorescence above 0.5 mg/ml of fibrils was observed, probably due to inner filter effects. A sigmoid function fitted well to these data. In addition, a detection limit of 0.47 μM was estimated by linear extrapolation of the signal measured at low protein concentration (Fig. S5 B). The sigmoid function was employed to calculate the expected signals for fibril concentrations above the detection limit; otherwise, a null signal was assumed. This procedure reproduces the observed lag phase of the curves, where the concentration of fibrils is below the detection limit of the assay. It should also be noted that at basic pH, ThioT may suffer a reversible hydroxylation process that modifies its spectral features. This modification is negligible under the experimental conditions employed here (32).
Classical nucleation-elongation models state that t1/2 and the initial protein concentration (c0) are related by the equation log(t1/2) = a − ((n + 1)/2) × log(c0), where n is the initial nucleus size. Even though in this system these variables show a linear relationship (Fig. 2 A), the calculated n has a negative value (n = −0.30). This is because the data set displays a subdependence between log t1/2 and log c0, a typical feature of fibrillation processes that are affected by secondary nucleation (33). In these experiments, the samples were stirred with a magnetic bar, which facilitates fibril fragmentation. To test this possibility, we incubated 1 mg/ml lysozyme under similar conditions but without stirring. No changes in ThioT fluorescence could be detected, even after incubation for 50 h (Fig. S6). Even though stirring may also accelerate the primary nucleation and fibril elongation steps, if only a primary nucleation mechanism is active, the calculated nucleus size from the log-log plot should be a positive number. In addition, we cannot rule out the possibility that the observed subdependence of t1/2 can also be due to a slow unimolecular process, such as a conformational change that occurs before the onset of fibrillation. Normalized fluorescence curves were rescaled following the procedure proposed by Flyvbjerg et al. (34), where the time axis is replaced by a rescaled time (t/t1/2). Usually this procedure collapses all curves into a single one. In the system studied here, the shape of the rescaled curves clearly depended on protein concentration (Fig. 2 B).
Figure 2.
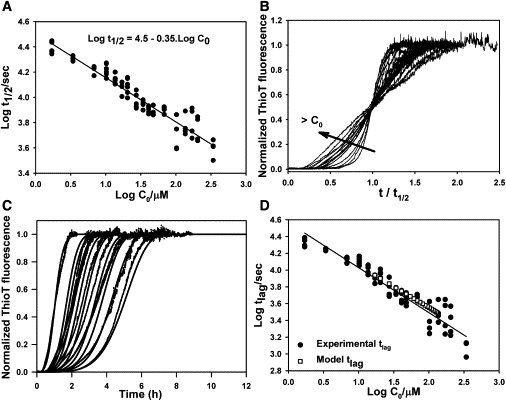
Global fitting of fibrillation curves. (A) Dependence of t1/2 on the initial concentration of lysozyme (c0). (B) Rescaled curve where t was replaced by t/t1/2. Only one example of each concentration is shown. (C) Comparison of the calculated fibrillation curves using the analytical solution of a model that considers secondary nucleation (solid lines) and the experimental data (dotted lines). The curves shown span a range of lysozyme concentrations from 0.15 to 1.5 mg/ml. (D) Experimental tlag (black circles) for all experimental curves and calculated tlag (white squares) of simulated curves for lysozyme concentrations of 1.5–0.15 mg/ml.
Several kinetic models were fitted to the fibrillation data. During the fitting procedures, the fibril concentration predicted by the models was transformed into the expected ThioT fluorescence signal using the calibration curve shown in Fig. S5 and compared with the experimental curves. Models that did not consider secondary nucleation were successfully fitted to all individual curves, but failed when we tried a global fit within a broad range of protein concentrations. We obtained better agreement when we applied the analytical solution developed by Knowles et al. (24), which results from solving the differential equations that describe a system in which both primary and secondary nucleation processes are operating. Secondary nucleation can be due to either lateral nucleation or fibril fragmentation. The model uses three kinetic constants, which describe primary nucleation (kn), polymerization (k+), and secondary nucleation (k−). Several nucleus size were tested, and a model that considers secondary nucleation by fragmentation and a monomeric nucleus (n = 1) worked properly (fitted parameters: k+ × k− = 1.5 10−9 μM−1s−2, kn/k− = 0.059). By using this model, we could globally fit the curves ranging from 0.15 to 1.5 mg/ml, reproducing their overall shape and lag times (Fig. 2, C and D). Nevertheless, this model failed when we attempted a global fit of data acquired over the complete range of concentrations (0.025–5 mg/ml), suggesting that the underlying fibrillation mechanism could be even more complicated (Fig. S7). For instance, the fragmentation probabilities could vary along the fibrils and depend on their length, or changes in the solution viscosity may affect some of the bimolecular kinetic constants. These parameters are considered constant by this model, but may vary as fibril concentration increases along the curves, which may also depend on the initial total protein concentration. In addition, an alternative version of this model, which considers a monomer-dependent secondary nucleation, did not fit our data.
Global fitting of the model over the complete range of lysozyme concentrations works adequately for intermediate protein concentrations, but predicts a faster evolution for the more concentrated samples and, conversely, a slower behavior for the more diluted ones (Fig. S7). As we mentioned above, this model does not consider unimolecular events that occur before the onset of fibrillation, which could act as a bottleneck that alters the shape of the curves. This effect is expected to be more pronounced for the more concentrated samples, where it might act as the rate-limiting step. We explored this possibility by studying the unfolding and refolding kinetics of lysozyme. To this end, we measured the fluorescence intensity at 354 nm of native or unfolded lysozyme in 7 M Gdn-HCl after dilution to reach a final concentration of 3 M Gdn-HCl. These measurements were accomplished by manual mixing, with an estimated dead time of ∼15 s. Single-exponential curves could be fitted for both experiments, yielding a half lifetime of 55 and 49 s for the unfolding and refolding curves, respectively (Fig. S8). The fibrillation curves of the more concentrated samples displayed tlags of ∼1000 s and the final plateau was reached after ∼8000 s, meaning that fibrillation was slower than the major conformational changes of the protein. Nevertheless, the nature of the initial aggregating species is unknown and its kinetics of formation may affect the experimental curves.
To study the evolution of the kinetic constants along the data set, we fitted each fibrillation curve individually. We should point out that only two out of three kinetics constants of the analytical solution can be determined independently, and for this reason only the expressions kn/k− and k+ × k− can be calculated. The last expression displays a marked decreasing trend as the protein concentration increases, whereas kn/k− displays a more subtle variation (Fig. S9 A). Even though it is not possible to determine the individual kinetic constants, it is constructive to follow their behavior after assuming that one parameter remains constant along the data set. For instance, if the secondary nucleation k− is set to a unitary value, k+ is equal to k+ × k− and kn is identical to kn/k−. Under this assumption, the fibrillation constant k+ shows a marked decreasing trend when the total protein concentration is increased, displaying a 28-fold variation between its extreme values. The primary nucleation constant kn displays a similar behavior but with a smaller slope, showing a 5-fold variation (Fig. S9 B). Since fibril fragmentation is a unimolecular process, in principle its kinetic constant k− likely will not depend on the medium viscosity. Conversely, k+ and kn describe bimolecular events and their values are expected to depend on that feature. Furthermore, this dependence will be magnified for the fibrillation constant k+, since that process involves bigger species. Therefore, we can speculate that viscosity changes that occur as the protein concentration increases or along each fibrillation curve could explain at least in part the results of the global fitting. Nevertheless, one should bear in mind that a good fitting of a model only supports a plausible mechanism, and is far from being a definitive proof.
Two effects related to the nonlinear response of the fluorescence signal are worth mentioning. First, the calculated fibril concentrations obtained using the analytical solution clearly display a positive slope at time zero (Fig. S10 A). By contrast, a lag phase with zero slope is evident in the experimental curves. This difference is due to the detection limit of the assay, because the fibril concentration must exceed this limit in order to be detected. This effect is taken into account in the calibration curve used here, and the calculated signals are very similar to those measured experimentally (Fig. S10 B). Second, we found that the rescaling procedure failed to collapse the experimental curves into a single one (Fig. 2 B). Rescaling of the predicted fibrillation curves assuming a linear signal response indeed renders a complete collapse of all curves (Fig. S10 C), which shows that this kinetic model also follows the rescaling property. By contrast, an analogous procedure with the calculated fluorescence signal using the calibration curve (Fig. S10 D) yielded a result similar to those observed experimentally. This shows that the lack of collapse is at least in part due to the nonlinear signal response.
Finally, even though filament fragmentation increases the complexity of the process, other usual protocols for fibril formation without stirring involve harder conditions than those employed here (such as pH 1–2 and 57–70°C) (35,36). Under these conditions, lysozyme suffers an extensive unfolding and therefore the natural inhibitors employed here bind very poorly to the protein. For instance, the dissociation constant of tri-GlcNAc in 3 M Gdn-HCl at 45°C is 0.13 mM (Fig. 3 A), whereas at pH 2 and 70°C no significant binding could be measured even at 2 mM ligand concentration (Fig. S11). This observation precluded the use of such conditions for this study. By contrast, 3 M Gdn-HCl lies in the middle of the unfolding curve at this temperature (Fig. S1 C), and therefore half of the protein population remains in the native conformation and inhibitors can bind at relatively low concentrations.
Figure 3.
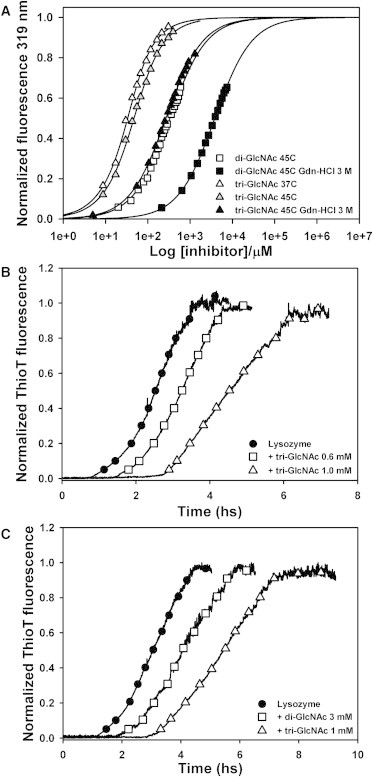
Effect of inhibitors on lysozyme fibrillation. (A) Lysozyme fluorescence intensity at 319 nm for increasing concentrations of di-GlcNAc (squares) and tri-GlcNAc (triangles). The lines represent the fitting to a model that considers binding and unfolding equilibria. (B) Fibril formation by 0.5 mg/ml lysozyme followed by ThioT fluorescence with the indicated concentrations of tri-GlcNAc. (C) Fibril formation by 0.3 mg/ml lysozyme followed by ThioT fluorescence with the indicated concentrations of di-GlcNAc or tri-GlcNAc.
Effect of kinetic inhibitors on the onset time of lysozyme fibrillation
We studied lysozyme binding to the natural inhibitors di-GlcNAc and tri-GlcNAc by performing intrinsic fluorescence spectroscopy under the same conditions employed for fibril formation. In this milieu, lysozyme displays a fluorescence maximum at 346 nm and inhibitor binding exerts a blue shift of this maximum (λmax = 334 and 333 nm for di-GlcNAc and tri-GlcNAc, respectively) (Fig. S12). A model that takes into account protein denaturation and ligand-binding equilibria was fitted to the measured fluorescence intensity at 319 nm (Fig. 3 A). To this end, we employed the unfolding constant at 3 M Gdn-HCl derived from the unfolding experiment (Kunf = 1) (Fig. S1 C). Ligand dissociation constants in 3 M Gdn-HCl and 45°C span over one order of magnitude (1.9 mM for di-GlcNAc and 0.13 mM for tri-GlcNAc), representing a ΔΔG0binding of 7 kJ/mol. In the absence of Gdn-HCl, the dissociation constants at 45°C are lower (0.33 mM for di-GlcNAc and 30 μM for tri-GlcNAc), in agreement with previous observations (37). In addition, the dissociation constant for tri-GlcNAc in the absence of Gdn-HCl and at physiological temperature is 16 μM (Fig. 3 A).
We next studied the effect of the inhibitors on fibril formation. In these experiments, protein concentrations varied between 0.05 and 1.5 mg/ml, and inhibitor concentrations ranged from 1 to 5 mM for di-GlcNAc and from 0.5 to 2.5 mM for tri-GlcNAc. We acquired a total of 37 curves using different combinations of protein and inhibitor concentrations (see Table S1 for details). The CD spectra along the fibrillation curve in the presence of tri-GlcNAc (Fig. S2 C) were similar to those measured with the protein alone (Fig. S2 B), displaying a slower change but reaching a similar final spectrum (Fig. S2 D). Moreover, fibrils formed by lysozyme in the presence of inhibitors displayed the same morphology as those obtained with lysozyme alone, as revealed by AFM (Fig. 1 B) and TEM (Fig. S3, C and D). These results indicate that the inhibitors did not alter the final structure of the fibrils.
The presence of inhibitors induced a delay on tlag and a reduced slope of the fibrillation curves in a dose-dependent manner (Fig. 3 B), and these changes were enhanced as the affinity of the inhibitor increased (Fig. 3 C). Qualitatively similar results have been obtained in other systems with different proteins and inhibitors (16,17). To rule out possible nonspecific contributions of the sugars, we performed similar experiments in the presence of 10 mM α-methylmannoside. This compound did not bind to lysozyme (Fig. S13 A) and it did not affect the fibrillation behavior of the protein (Fig. S13 B).
Since the unfolding and ligand dissociation constants are known, we were able to calculate the concentration of unbound species (native and denatured) at the beginning of the experiments. In addition, from the tlag versus protein concentration curves in the absence of inhibitors (Fig. 2 D), we could estimate the expected lag time for any protein concentration within this range. This estimation was performed for the total protein concentration in solution and for the concentration of unbound species present at equilibrium. A comparison between the experimental tlag in the presence of inhibitors and the estimated values using either the total protein concentration or the concentration of unbound species showed that the latter better described the observed tlag (Fig. S14), although a poor correlation was displayed.
ThioT fluorescence usually increases at earlier times than tlag calculated by the extrapolation method (Fig. 1 D). Therefore, calculated tlag obtained by this procedure overestimates the time required for the detection of the initial fluorescence increment. This difference is more pronounced for slow-progressing curves, such as those measured in the presence of inhibitors. For this reason, we developed a new method to estimate fibrillation lag times more accurately. This method is a numeric variational approach in which a split derivatable function is fitted to the initial segment of the experimental curves (up to 5% progression). This split function is composed of a straight line followed by a quadratic polynomial. The contact time between both functions (τ) is used as a parameter to generate a set of test functions, which are individually fitted to the experimental data. The quadratic error of the fittings for each τ presents a global minimum at a particular time (named τlag). This point accurately reflects the moment when the experimental signal first departs from the initial baseline, yielding a more precise estimation of lag times (Fig. 4 A). In all cases, τlag is lower than tlag, with the difference being higher for the slower curves measured in the presence of inhibitors (Fig. S15). In addition, the stochastic nature of the fibrillation process is evidenced by the greater dispersion of τlag values as the total protein concentration employed decreases (Fig. S16).
Figure 4.

Analysis of fibrillation using τlag. (A) Variational calculus of τlag. A split continuous function composed of a linear function (black line) followed by a quadratic function (gray line) was fitted to the initial part of a 0.15 mg/ml lysozyme fibrillation curve. The right axis shows the quadratic error for all τ values tested. τlag is the τ where the error is minimal (arrow). (B) Calculated τlag for all experimental curves in the absence of inhibitors.
The τlag values were calculated for all experimental curves with and without inhibitors. In the absence of inhibitors, a log-log plot of τlag versus protein concentration displayed a linear behavior (Fig. 4 B). An empirical function was fitted to this data, allowing the prediction of τlag for any protein concentration. We used this function to estimate the expected τlag in the presence of inhibitors, considering either the total protein concentration or the concentration of unbound species. Interestingly, the latter values clearly displayed a good correlation with the experimental τlag regardless of the inhibitor considered (Fig. 5, A and B). These results show that in this system, the fibrillation-onset times are mainly determined by the concentration of unbound protein species present in the binding equilibrium.
Figure 5.
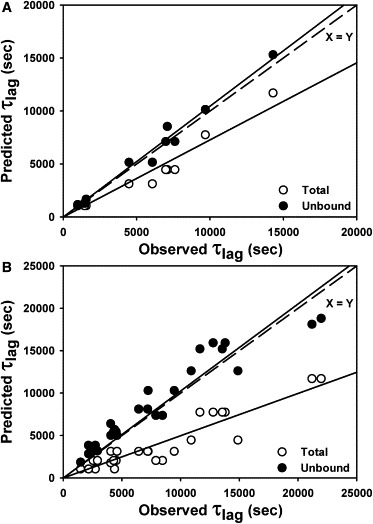
Comparison of experimental and calculated values of τlag. (A and B) Observed τlag and the calculated τlag using either the total protein concentration (white circles) or the concentration of unbound species (black circles) for fibrillation curves measured in the presence of (A) di-GlcNAc and (B) tri-GlcNAc. Continuous lines represent a linear regression for each cluster of data. The dashed line is the identity function.
It should be mentioned that the effect of the inhibitors in shifting the lag times depends not only on the degree of displacement of the ligand-binding equilibrium but also on the total protein concentration employed. For instance, if enough inhibitor is added to bind two-thirds of the total protein, when the lysozyme concentration is 1.5 mg/ml the expected shift of lag times will be ∼1000 s, whereas when a lysozyme concentration of 0.15 mg/ml is used, a shift of ∼6000 s will be observed. This is because the lag times depend nonlinearly on the total protein concentration. For this reason, a dose-response curve can only be performed for a set of curves employing the same concentration of total lysozyme. In such cases, one can clearly observe an increase of τlag when the inhibitor concentration is increased (Fig. S17).
Discussion
Kinetic inhibition is a promising approach to treat protein-misfolding diseases (7). By targeting the initial steps of the fibrillation process, this strategy diminishes the concentration of early oligomeric forms, which are postulated to be the most dangerous species (8–11). The recent approval of tafamidis to treat the systemic amyloidosis caused by transthyretin illustrates the potential of this approach (16). Moreover, alternative strategies involving the disruption of mature fibrils could increment the concentration of small oligomeric species, probably leading to unexpected and dangerous consequences. This observation emphasizes the need to fully understand the fibrillation process and the underlying mechanism of toxicity to facilitate the development of effective therapies.
Fibrillation from folded proteins usually involves a conformational change of the native structure before it is incorporated into fibrils. For this reason, inhibitor-bound species are not expected to be found in the core of the fibrils, although they could affect the fibrillation kinetics. Depending on the structural change involved in fibril formation and the nature of the interacting surfaces, inhibitor-bound species may function as capping elements of growing fibrils or as alternative nucleation sites. In both scenarios, these species will no longer be passive bystanders in the process and thus will affect fibrillation lag times. For example, unnicked lysozyme delays the fibrillation of the nicked protein at acidic pH and high temperature (19). To explore this issue, we performed a quantitative study of the effect of two natural inhibitors on the fibrillation kinetics of hen lysozyme.
Correlations between inhibitor affinities for the target proteins and their effect on the fibrillation processes have been observed in other systems (17,18). Small ligand binding involves a variable amount of unbound protein, which in turn could lead to fibril formation. Our aim in this work was to study the time course of a fibrillation process in the presence of a kinetic inhibitor, focusing our attention on the onset times of fibril formation. To this end, we first studied the behavior of chicken lysozyme in Gdn-HCl. Under this condition, the protein formed amyloid fibrils within hours, as revealed by ThioT fluorescence, CD spectroscopy, TEM, and AFM. This process follows a complex mechanism, probably involving secondary nucleation due to fibril fragmentation. In agreement with these results, an analytical solution of a model that considers this kind of secondary nucleation could be fitted to our data within a broad protein concentration range (24).
The natural inhibitors di-GlcNAC and tri-GlcNAc delayed the onset of fibrillation in a dose-dependent manner. At equal inhibitor concentrations, tri-GlcNAc exerted a stronger effect than di-GlcNAc, as would be expected considering the higher affinity of the former. Using the lysozyme unfolding curve and the measured inhibitor binding constants, we calculated the concentration of the relevant species at the beginning of the fibrillation curves. We used this information to predict the expected tlag considering the total protein concentration or the concentration of unbound protein species. A comparison of the observed tlags in the presence of inhibitors with the predicted values showed a better correlation with values calculated using the concentration of unbound species. Nevertheless, this correlation was poor and depended on the inhibitor identity. This is because tlag calculated using the extrapolation method overestimates the time of the initial fluorescence signal change, and this effect is more dramatic for slow-progressing curves such as those obtained in the presence of inhibitors. For this reason, we developed a method based on a variational approach. The lag times calculated through this method (τlag) more accurately reflect the fibrillation onset times. Using this approach, we performed an analysis similar to the one described above. The results showed that the experimental τlag correlated well with the τlag calculated using the concentration of unbound species present in the binding equilibrium. Moreover, this correlation held true for both inhibitors regardless of their affinity for the target protein. On the other hand, it has been shown that stabilizing osmolytes such as glycerol or sorbitol can alter the kinetics of fibril assembly through semispecific mechanisms (38). These effects require high osmolite concentrations, within the molar range. The highest inhibitor concentration employed here was 5 mM; therefore, it is not likely that such effects made any important contribution in this study.
In summary, we found that for the particular system studied here, the onset times of fibril formation are mainly dictated by the concentration of unbound protein species present in the binding equilibrium. In principle, the initial behavior of this system is insensitive to the presence of the ligand-protein complex. Most importantly, knowledge about the aggregation kinetics of the target protein and the affinity of the inhibitors suffices to predict the onset times of fibrillation. It remains to be established whether this conclusion can be extrapolated to other systems. In such scenarios, effective therapies based on kinetic inhibition should take into account the long-term effect of unbound species and control their concentration accordingly to prevent the eventual initiation of deleterious processes.
Acknowledgments
We thank Susana Raffo and Marta Bravo for technical assistance.
This work was supported by grants from the Agencia Nacional de Promoción Científica y Tecnológica (FONCYT, PICT 2010-0376) and the University of Buenos Aires (UBACyT X187), Argentina. G.E.G., C.D., and J.J.C. are research fellows of CONICET. L.L. is a member of the Ministry of Agriculture of Argentina.
Footnotes
Rodrigo S. Pagano and Máximo López Medus contributed equally to this work.
Supporting Material
References
- 1.Chiti F., Dobson C.M. Protein misfolding, functional amyloid, and human disease. Annu. Rev. Biochem. 2006;75:333–366. doi: 10.1146/annurev.biochem.75.101304.123901. [DOI] [PubMed] [Google Scholar]
- 2.Guijarro J.I., Sunde M., Dobson C.M. Amyloid fibril formation by an SH3 domain. Proc. Natl. Acad. Sci. USA. 1998;95:4224–4228. doi: 10.1073/pnas.95.8.4224. [DOI] [PMC free article] [PubMed] [Google Scholar]
- 3.Chiti F., Webster P., Dobson C.M. Designing conditions for in vitro formation of amyloid protofilaments and fibrils. Proc. Natl. Acad. Sci. USA. 1999;96:3590–3594. doi: 10.1073/pnas.96.7.3590. [DOI] [PMC free article] [PubMed] [Google Scholar]
- 4.Hamada D., Dobson C.M. A kinetic study of β-lactoglobulin amyloid fibril formation promoted by urea. Protein Sci. 2002;11:2417–2426. doi: 10.1110/ps.0217702. [DOI] [PMC free article] [PubMed] [Google Scholar]
- 5.Hurshman Babbes A.R., Powers E.T., Kelly J.W. Quantification of the thermodynamically linked quaternary and tertiary structural stabilities of transthyretin and its disease-associated variants: the relationship between stability and amyloidosis. Biochemistry. 2008;47:6969–6984. doi: 10.1021/bi800636q. [DOI] [PMC free article] [PubMed] [Google Scholar]
- 6.Booth D.R., Sunde M., Pepys M.B. Instability, unfolding and aggregation of human lysozyme variants underlying amyloid fibrillogenesis. Nature. 1997;385:787–793. doi: 10.1038/385787a0. [DOI] [PubMed] [Google Scholar]
- 7.Härd T., Lendel C. Inhibition of amyloid formation. J. Mol. Biol. 2012;421:441–465. doi: 10.1016/j.jmb.2011.12.062. [DOI] [PubMed] [Google Scholar]
- 8.Lashuel H.A., Hartley D., Lansbury P.T., Jr. Neurodegenerative disease: amyloid pores from pathogenic mutations. Nature. 2002;418:291. doi: 10.1038/418291a. [DOI] [PubMed] [Google Scholar]
- 9.Campioni S., Mannini B., Chiti F. A causative link between the structure of aberrant protein oligomers and their toxicity. Nat. Chem. Biol. 2010;6:140–147. doi: 10.1038/nchembio.283. [DOI] [PubMed] [Google Scholar]
- 10.Baglioni S., Casamenti F., Stefani M. Prefibrillar amyloid aggregates could be generic toxins in higher organisms. J. Neurosci. 2006;26:8160–8167. doi: 10.1523/JNEUROSCI.4809-05.2006. [DOI] [PMC free article] [PubMed] [Google Scholar]
- 11.Reixach N., Deechongkit S., Buxbaum J.N. Tissue damage in the amyloidoses: Transthyretin monomers and nonnative oligomers are the major cytotoxic species in tissue culture. Proc. Natl. Acad. Sci. USA. 2004;101:2817–2822. doi: 10.1073/pnas.0400062101. [DOI] [PMC free article] [PubMed] [Google Scholar]
- 12.Bieschke J., Herbst M., Wanker E.E. Small-molecule conversion of toxic oligomers to nontoxic β-sheet-rich amyloid fibrils. Nat. Chem. Biol. 2012;8:93–101. doi: 10.1038/nchembio.719. [DOI] [PubMed] [Google Scholar]
- 13.Ehrnhoefer D.E., Bieschke J., Wanker E.E. EGCG redirects amyloidogenic polypeptides into unstructured, off-pathway oligomers. Nat. Struct. Mol. Biol. 2008;15:558–566. doi: 10.1038/nsmb.1437. [DOI] [PubMed] [Google Scholar]
- 14.Meng F., Abedini A., Raleigh D.P. The flavanol (-)-epigallocatechin 3-gallate inhibits amyloid formation by islet amyloid polypeptide, disaggregates amyloid fibrils, and protects cultured cells against IAPP-induced toxicity. Biochemistry. 2010;49:8127–8133. doi: 10.1021/bi100939a. [DOI] [PMC free article] [PubMed] [Google Scholar]
- 15.Hammarström P., Wiseman R.L., Kelly J.W. Prevention of transthyretin amyloid disease by changing protein misfolding energetics. Science. 2003;299:713–716. doi: 10.1126/science.1079589. [DOI] [PubMed] [Google Scholar]
- 16.Bulawa C.E., Connelly S., Labaudinière R. Tafamidis, a potent and selective transthyretin kinetic stabilizer that inhibits the amyloid cascade. Proc. Natl. Acad. Sci. USA. 2012;109:9629–9634. doi: 10.1073/pnas.1121005109. [DOI] [PMC free article] [PubMed] [Google Scholar]
- 17.Wiseman R.L., Green N.S., Kelly J.W. Kinetic stabilization of an oligomeric protein under physiological conditions demonstrated by a lack of subunit exchange: implications for transthyretin amyloidosis. Biochemistry. 2005;44:9265–9274. doi: 10.1021/bi050352o. [DOI] [PubMed] [Google Scholar]
- 18.Chiti F., Taddei N., Ramponi G. Reduction of the amyloidogenicity of a protein by specific binding of ligands to the native conformation. Protein Sci. 2001;10:879–886. doi: 10.1110/ps.42401. [DOI] [PMC free article] [PubMed] [Google Scholar]
- 19.Mishra R., Sörgjerd K., Hammarström P. Lysozyme amyloidogenesis is accelerated by specific nicking and fragmentation but decelerated by intact protein binding and conversion. J. Mol. Biol. 2007;366:1029–1044. doi: 10.1016/j.jmb.2006.11.084. [DOI] [PubMed] [Google Scholar]
- 20.Swaminathan R., Ravi V.K., Chandra N. Lysozyme: a model protein for amyloid research. Adv. Protein Chem. Struct. Biol. 2011;84:63–111. doi: 10.1016/B978-0-12-386483-3.00003-3. [DOI] [PubMed] [Google Scholar]
- 21.Dumoulin M., Kumita J.R., Dobson C.M. Normal and aberrant biological self-assembly: insights from studies of human lysozyme and its amyloidogenic variants. Acc. Chem. Res. 2006;39:603–610. doi: 10.1021/ar050070g. [DOI] [PubMed] [Google Scholar]
- 22.Kumar S., Ravi V.K., Swaminathan R. Suppression of lysozyme aggregation at alkaline pH by tri-N-acetylchitotriose. Biochim. Biophys. Acta. 2009;1794:913–920. doi: 10.1016/j.bbapap.2009.01.009. [DOI] [PubMed] [Google Scholar]
- 23.Pedersen J.S., Flink J.M., Otzen D.E. Sulfates dramatically stabilize a salt-dependent type of glucagon fibrils. Biophys. J. 2006;90:4181–4194. doi: 10.1529/biophysj.105.070912. [DOI] [PMC free article] [PubMed] [Google Scholar]
- 24.Knowles T.P., Waudby C.A., Dobson C.M. An analytical solution to the kinetics of breakable filament assembly. Science. 2009;326:1533–1537. doi: 10.1126/science.1178250. [DOI] [PubMed] [Google Scholar]
- 25.Horcas I., Fernández R., Baro A.M. WSXM: a software for scanning probe microscopy and a tool for nanotechnology. Rev. Sci. Instrum. 2007;78:013705. doi: 10.1063/1.2432410. [DOI] [PubMed] [Google Scholar]
- 26.Sasahara K., Demura M., Nitta K. Partially unfolded equilibrium state of hen lysozyme studied by circular dichroism spectroscopy. Biochemistry. 2000;39:6475–6482. doi: 10.1021/bi992560k. [DOI] [PubMed] [Google Scholar]
- 27.Dhulesia A., Cremades N., Dobson C.M. Local cooperativity in an amyloidogenic state of human lysozyme observed at atomic resolution. J. Am. Chem. Soc. 2010;132:15580–15588. doi: 10.1021/ja103524m. [DOI] [PMC free article] [PubMed] [Google Scholar]
- 28.D’Amico M., Raccosta S., Manno M. Existence of metastable intermediate lysozyme conformation highlights the role of alcohols in altering protein stability. J. Phys. Chem. B. 2011;115:4078–4087. doi: 10.1021/jp106748g. [DOI] [PubMed] [Google Scholar]
- 29.Kiefhaber T. Kinetic traps in lysozyme folding. Proc. Natl. Acad. Sci. USA. 1995;92:9029–9033. doi: 10.1073/pnas.92.20.9029. [DOI] [PMC free article] [PubMed] [Google Scholar]
- 30.Bieri O., Wildegger G., Kiefhaber T. A salt-induced kinetic intermediate is on a new parallel pathway of lysozyme folding. Biochemistry. 1999;38:12460–12470. doi: 10.1021/bi9909703. [DOI] [PubMed] [Google Scholar]
- 31.Vernaglia B.A., Huang J., Clark E.D. Guanidine hydrochloride can induce amyloid fibril formation from hen egg-white lysozyme. Biomacromolecules. 2004;5:1362–1370. doi: 10.1021/bm0498979. [DOI] [PubMed] [Google Scholar]
- 32.Foderà V., Groenning M., Leone M. Thioflavin T hydroxylation at basic pH and its effect on amyloid fibril detection. J. Phys. Chem. B. 2008;112:15174–15181. doi: 10.1021/jp805560c. [DOI] [PubMed] [Google Scholar]
- 33.Cohen S.I., Vendruscolo M., Knowles T.P. From macroscopic measurements to microscopic mechanisms of protein aggregation. J. Mol. Biol. 2012;421:160–171. doi: 10.1016/j.jmb.2012.02.031. [DOI] [PubMed] [Google Scholar]
- 34.Flyvbjerg H., Jobs E., Leibler S. Kinetics of self-assembling microtubules: an “inverse problem” in biochemistry. Proc. Natl. Acad. Sci. USA. 1996;93:5975–5979. doi: 10.1073/pnas.93.12.5975. [DOI] [PMC free article] [PubMed] [Google Scholar]
- 35.Arnaudov L.N., de Vries R. Thermally induced fibrillar aggregation of hen egg white lysozyme. Biophys. J. 2005;88:515–526. doi: 10.1529/biophysj.104.048819. [DOI] [PMC free article] [PubMed] [Google Scholar]
- 36.Raccosta S., Martorana V., Manno M. Thermodynamic versus conformational metastability in fibril-forming lysozyme solutions. J. Phys. Chem. B. 2012;116:12078–12087. doi: 10.1021/jp303430g. [DOI] [PubMed] [Google Scholar]
- 37.Saint-Blancard J., Allary M., Jollès P. The influence of urea and guanidine chloride on the binding of the binding of the bacterial substrate and inhibitors to hen lysozyme at physiological temperature (40 degrees) (∗) Biochimie. 1975;57:1163–1166. doi: 10.1016/s0300-9084(76)80578-0. [DOI] [PubMed] [Google Scholar]
- 38.Sukenik S., Harries D. Insights into the disparate action of osmolytes and macromolecular crowders on amyloid formation. Prion. 2012;6:26–31. doi: 10.4161/pri.6.1.18132. [DOI] [PMC free article] [PubMed] [Google Scholar]
Associated Data
This section collects any data citations, data availability statements, or supplementary materials included in this article.