Abstract
BACKGROUND:
This study was undertaken to identify the prevalence of pulmonary embolism (PE) in the emergency department (ED) of an urban teaching hospital and also to test a Bayesian model in estimating the number of CT pulmonary angiography (CTA) expected to be performed in an emergency department.
METHODS:
The data for this study was obtained through a retrospective review of electronic medical records for all ED patients suspected of PE who underwent chest CTA or ventilation perfusion scanning (V/Q) between 2009 and 2010. The data is presented as means and standard deviation for continuous variables and percentages with 95% confidence intervals (95%CI) for proportions. The prevalence of PE was used as pre-test probability in the Bayesian model. Post-test probability was obtained using a Fagan nomogram and likelihood ratios for CTA.
RESULTS:
A total of 778 patients (560 females) with mean age of 50 years (range 18–98 years) were enrolled (98.3% underwent chest CTA and 1.7% underwent V/Q scan). A total of 69 patients had PE, rendering an overall prevalence of 8.9% (95%CI, 7.1% to 11.1%) for PE. We calculated that 132 CTA’s per year could be avoided in our institution, without compromising safe exclusions of PE (keeping post-test probability of PE below 2%).
CONCLUSIONS:
Despite differences in our patient populations and /or study designs, the prevalence of PE in our institution is about average compared to other institutions. Our proposed model for calculating redundant chest CTA is simple and can be used by institutions to identify overuse of CTA.
KEY WORDS: Pulmonary embolism, Emergency, CT pulmonary angiography
INTRODUCTION
Pulmonary embolism (PE) is a common, serious and potentially fatal complication of thrombus formation within the deep venous circulation. It is the third leading cause of death[1] with an average of 650 000 PE-related deaths in the US annually. Emergency department (ED) physicians often face the dilemma of whether or not to pursue the diagnosis of PE in patients who present with signs and symptoms suggestive of pulmonary embolism such as dyspnea, chest pain, unexplained tachycardia, syncope, hyperventilation and other more nonspecific complaints.[2] Moreover, choosing the correct diagnostic modality to investigate the possibility of PE, amongst a plethora of tests including pulmonary angiography, magnetic resonance imaging (MRI), echocardiography, ultrasound, d-Dimer, ventilation perfusion scanning (V/ Q) and CT pulmonary angiography (CTA) is a complex decision in the ED. This decision is dependent upon a number of factors including patient stability, availability of resources and pre-test probability of PE.
Since the availability of CTA in the ED, its use has been increased, while having no significant improvement in ruling out PE.[3–5] The available studies indicate that the yield of CTA in most institutions is between 6% to 13%.[5–10] Multiple studies argue that the application of validated clinical decision rules has not decreased the amount of CTA performed for ruling in or ruling out PE.[6,11] While the benefit of the imaging lies in helping unravel other diagnosis that might need acute or sub acute intervention (mass, consolidation, dissection, etc),[12] there are multiple risk factors associated with it. Such side-effects include contrast-induced nephropathy especially to those who are at a higher risk of kidney damage (patients with hypertension, diabetes mellitus etc) or radiation to internal organs, which has been suggested to cause up to 2% of cancers nationwide.[13] Furthermore, obtaining a CTA in a busy ED is time-consuming, ultimately slowing down work flow and increasing patient length-of-stay.[5]
To address this issue, we propose to identify the prevalence of PE in the ED of an urban teaching hospital. Once this information is obtained, a Bayesian theorem model could be used to calculate whether unnecessary chest CTAs are being done. When this model is used, the inverse question can also be answered, i.e one can determine if the number of scans can be reduced while maintaining an acceptable miss rate of 2% (When pulmonary angiography is used as a gold standard, its specificity is approximately 98%).[14] Once one has this information, the ED can determine whether too many CTAs are being ordered or not.[15]
METHODS
The data for this study was obtained through a retrospective review of electronic medical records for all ED patients suspected of PE who had undergone chest CTA or V/Q scans between January 2009 and January 2010 in an urban academic hospital. This study was approved by the institutional review board (IRB). Patients (≥18 years of age) received a chest CTA or V/Q scans to rule out PE were included in the study. Patients were excluded if they had a history of PE or a chest CTA and V/Q performed for reasons other than PE (trauma, aortic dissection, etc.) or underwent imaging studies for PE diagnosis more than 24 hours after ED arrival to avoid false inclusions of those patients who developed PE during their hospital stay. Moreover any studies considered as non-conclusive by the radiologist were also excluded.
Patients’ medical records were reviewed through Quadramed (Quadramed Corporation, Reston, VA), the electronic medical record system at KCHC. The results for CTA and V/Q scans that were interpreted by radiologists were retrieved from our institution’s electronic radiography software (Philips Healthcare PACS Imaging System, Andover, MA). Demographics (including age, sex) and physical findings (including vital signs, indications for imaging, data pertaining to chief complaints and incidental findings other than PE) were also reported. All the retrieved data were directly transferred to an electronic database (SPSS version 15) (no paper data collection sheet was used).
Data analysis
To calculate the prevalence of PE in our ED patients, we divided the number of positive chest CTA and V/ Q scans by the total number of patients enrolled in the study. The prevalence was reported as percentage with a 95% confidence interval (CI). The groups were compared using Student’s t test and the Chi-square test for continuous and categorical variables, respectively.
Moreover we also calculated the number of chest CTA that could be avoided without compromising the safe exclusion of PE (post-test probability less than 2%). A 2×2 table was generated to calculate a sensitivity of 95%, a specificity of 90% and likelihood ratios of chest CTA for diagnosing PE. Furthermore, a Bayesian model was used to calculate post-test probability of PE in different scenarios by adjusting the number of true negative chest CTAs. The number of true negative CTAs was reduced to a level until any further reduction would pass 2% for the post-test probability of PE. The last number was used to indicate the minimum number of CTAs that are expected to be performed (given the prevalence of PE in our institution) in order to maintain the post-test probability of PE below 2%. By extracting the number of true negative chest CTAs obtained initially by the final adjusted number, the number of chest CTAs that could be reduced without compromising the safe post-test probability of PE was calculated.
A sample size analysis revealed that 144 patients were required in each group (PE and no PE) to reach a 95%CI with±5% width of the calculated proportion. We used 10% as the estimated prevalence of PE. Statistical analyses were made using SPSS for Windows version 15 (SPSS Inc., Chicago, IL, USA). Bayesian model calculations were carried out using a valid diagnostic test calculator (http://araw.mede.uic.edu/cgi-alansz/testcalc.pl).
RESULTS
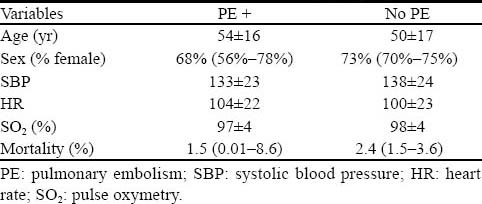
During the study period, a total of 1029 chest CTAs and V/Q scans were performed in our institution. Two hundred and fifty-one (24%) patients did not meet the inclusion criteria. The final analysis was performed on 778 patients (560 females and 218 males) with a mean age of 50 years (range 18–98 years), of whom 765 (98.3%) patients had chest CTAs and 13 (1.7%) patients underwent lung V/Q scans. The patient demographics, vital signs and mortality rate of the two groups of patients (with or without PE) are presented in Table 1. The patient characteristics were similar between the two groups except for age, as patients with PE were older than those without PE (mean difference 4.8; 95%CI 0.8 to 8.9).
Table 1.
Patient characteristics of the two study groups (n=778)
A total of 69 patients had PE, rendering an overall prevalence of 8.9% (95%CI, 7.1% to 11.1%) for PE in our institution. Two hundred and forty-one patients (a prevalence of 34%, 95%CI, 31% to 38%) of the remaining 709 patients had non-PE significant findings on their chest CTAs (Table 2). The post-test probability of PE in our patients after a negative chest CTA was 1% (95%CI, 0.2%–1.5%). The 2×2 tables and the Fagan nomogram are presented in Figures 1 and 2, respectively. Gradually, the number of true negative tests in the 2×2 tables were reduced until further decreasing the number would push the upper level of 95%CI for post-test probability beyond 2%. A total of 504 negative chest CTAs (out of a total sample size of 647, 132 less chest CTA) would produce a post-test probability of 1% (95%CI, 0% to 2%) after a negative CTA (Figures 3 and 4). Any further reduction in the number of true negative chest CTAs would push the upper level of confidence interval for post-test probability over 2%. We assumed that we could reduce the number of chest CTAs in our institution by 132 per year without compromising the post-test probability of the tests in our patients suspected of PE.
Table 2.
An estimated prevalence of PE of recent studies compared with the present study
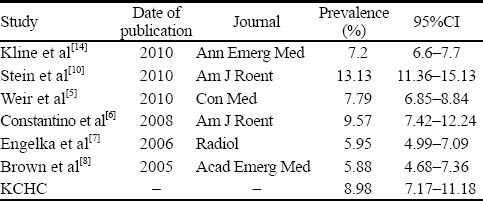
Figure 1.
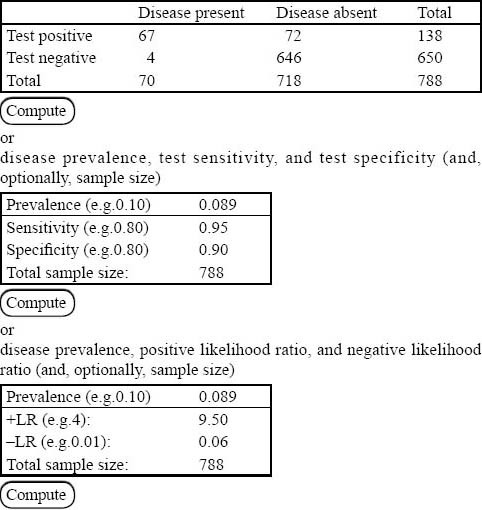
A sample of 2×2 table that could be used to calculate sensitivity, specificity, and likelihood ratios (positive and negative).
Figure 2.
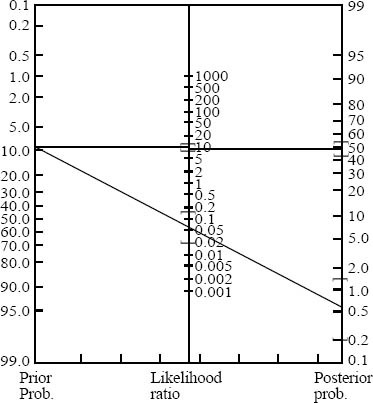
How likelihood ratios of a positive or negative test (chest CT angiogram) can change the pre-test probability of PE.
Figure 3.
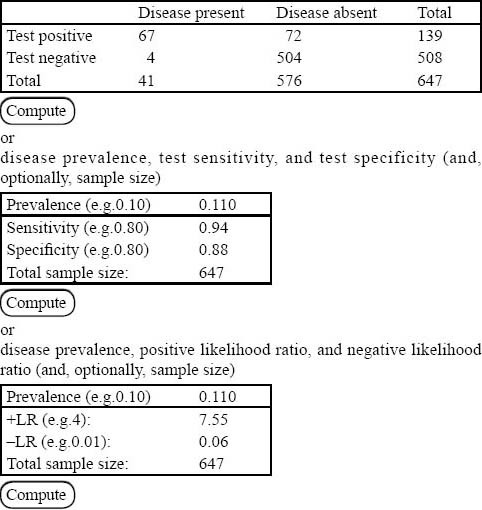
How the number of positive and negative chest CTA s could affect the prevalence and test characteristics (compared with Figure 1).
Figure 4.
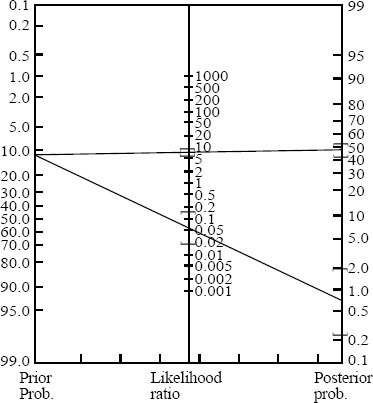
How the number of positive and negative chest CTAs could affect the post-test probability of disease on Fagan nomogram (compared with Figure 2).
DISCUSSION
The prevalence of pulmonary embolism in our institution was found to be 8.98% which is remarkably similar to the other recent studies reporting a range from 5.88% to 13.3% (Table 3), despite differences in study designs, populations, and inclusion/exclusion criteria. Previous studies have proposed methods to reduce the number of chest CTAs for patients suspected of PE. In 2010, Stein et al[10] determined a technique to reduce radiation exposure to patients suspected of PE by increasing the use of low-radiation V/Q scan while decreasing the use of high-radiation chest CTA. Implementing educational intervention and imaging algorithm result in a 20% fall in effective radiation dose without a compromise in patient safety.
Table 3.
Non-PE findings in patients who had negative chest CTA for PE (n=709)
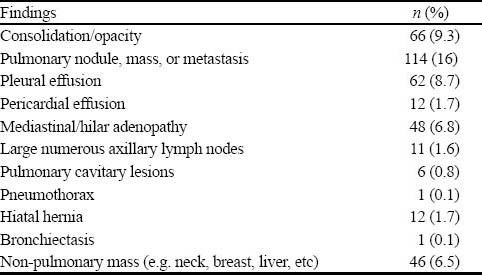
Our study proposed a simple and user friendly method to determine if unnecessary chest CTA is conducted relative to the prevalence of PE at a given institution and a technique to calculate the number of scans that can be reduced while maintaining an acceptable missing rate of 2%. This approach allows the ED administration in an ED to implement policies or strategies (e.g. clinical decision rules) to reduce the number of CTAs, which would in turn minimize radiation exposure, contrast induced nephropathy, renal failure, allergic reactions, ED waiting times, patient length-of-stay and overall costs.
The results of our study could be generalized and applied to other institutions. Despite differences in our patients and/or study designs, the prevalence of PE in our institution is about average compared to other institutions (Table 3). Moreover, when estimating the number of chest CTAs that can be potentially eliminated while maintaining a post-test probability of less than 2%, our study assumed that none of the eliminated CTAs was false negative. This assumption was made to estimate a target number for the reduction of chest CTAs ordered by utilizing an accurate clinical decision rule without increasing the missing rate above 2%. Once a clinical decision rule is developed and implemented, the number of chest CTAs ordered before and after the implementation of the rule can be compared to each other and to the target number of reduced CTAs.
Limitations
There are some limitations in this study with respect to data that may affect the accuracy of the results. While missing and inaccurate data are an inherent limitation of most retrospective reviews, our study attempted to mitigate these limitations by broadening the search criteria to include many more outcome variables as chief complaints, vital signs, age, sex, and indications for imaging in addition to a diagnosis of PE. Regardless, the retrospective design of the study also exposes the results to biases inherent in such designs. Our proposed model for calculating redundant chest CTA needs to be validated to ensure that it does not compromise patient safety.
Footnotes
Funding: This was an unfunded study.
Ethical approval: This study was approved by the Institutional Review Board (IRB).
Conflicts of interest: The authors declare that there is no conflict of interest.
Contributors: TM and BP wrote the initial draft. All authors contributed to the design, interpretation of the study and to further drafts.
REFERENCES
- 1.Gillum RF. Pulmonary embolism and thrombophlebitis in the United States, 1970–1985. Am Heart J. 1987;114:1262–1264. doi: 10.1016/0002-8703(87)90212-2. [DOI] [PubMed] [Google Scholar]
- 2.Calder KK, Herbert M, Henderson SO. The mortality of untreated pulmonary embolism in emergency department patients. Ann Emerg Med. 2005;45:302–310. doi: 10.1016/j.annemergmed.2004.10.001. [DOI] [PubMed] [Google Scholar]
- 3.Donohoo JH, Mayo-Smith WW, Pezzullo JA, Egglin TK. Utilization patterns and diagnostic yield of 3421 consecutive multidetector row computed tomography pulmonary angiograms in a busy emergency department. J Comput Assist Tomogr. 2008;32:421–425. doi: 10.1097/RCT.0b013e31812e6af3. [DOI] [PubMed] [Google Scholar]
- 4.Prologo JD, Gilkeson RC, Diaz M, Asaad J. CT pulmonary angiography: a comparative analysis of the utilization patterns in emergency department and hospitalized patients between 1998 and 2003. Am J Roentgenol. 2004;183:1093–1096. doi: 10.2214/ajr.183.4.1831093. [DOI] [PubMed] [Google Scholar]
- 5.Weir ID, Drescher F, Cousin D, Fraser T, Ronald L, Lewis B, et al. Trends in use and yield of chest computed tomography with angiography for diagnosis of pulmonary embolism in a Connecticut hospital emergency department. Conn Med. 2010;74:5–9. [PubMed] [Google Scholar]
- 6.Costantino MM, Randall G, Gosselin M, Brandt M, Spinning K, Vegas CD. CT angiography in the evaluation of acute pulmonary embolus. Am J Roentgenol. 2008;191:471–474. doi: 10.2214/AJR.07.2552. [DOI] [PubMed] [Google Scholar]
- 7.Engelke C, Rummeny EJ, Marten K. Pulmonary embolism at multi-detector row CT of chest: one-year survival of treated and untreated patients. Radiology. 2006;239:563–575. doi: 10.1148/radiol.2392050118. [DOI] [PubMed] [Google Scholar]
- 8.Brown MD, Vance SJ, Kline JA. An emergency department guideline for the diagnosis of pulmonary embolism: an outcome study. Acad Emerg Med. 2005;12:20–25. doi: 10.1197/j.aem.2004.08.046. [DOI] [PubMed] [Google Scholar]
- 9.Courtney DM, Kline JA, Kabrhel C, Moore L, Smithline A, Nordenholz E, et al. Clinical features from the history and physical examination that predict the presence or absence of pulmonary embolism in symptomatic emergency department patients: results of a prospective, multicenter study. Ann Emerg Med. 2010;55:307–315 e1. doi: 10.1016/j.annemergmed.2009.11.010. [DOI] [PMC free article] [PubMed] [Google Scholar]
- 10.Stein EG, Haramati LB, Chamarthy M, Sprayregen S, Davitt MM, Freeman LM. Success of a safe and simple algorithm to reduce use of CT pulmonary angiography in the emergency department. Am J Roentgenol. 2010;194:392–397. doi: 10.2214/AJR.09.2499. [DOI] [PubMed] [Google Scholar]
- 11.van Belle A, Buller HR, Huisman MV, Huisman PM, Kaasjager K, Kamphuisen PW, et al. Effectiveness of managing suspected pulmonary embolism using an algorithm combining clinical probability, D-dimer testing, and computed tomography. JAMA. 2006;295:172–179. doi: 10.1001/jama.295.2.172. [DOI] [PubMed] [Google Scholar]
- 12.Richman PB, Courtney DM, Friese J, Matthews J, Field A, Petri R, et al. Prevalence and significance of nonthromboembolic findings on chest computed tomography angiography performed to rule out pulmonary embolism: a multicenter study of 1,025 emergency department patients. Acad Emerg Med. 2004;11:642–647. [PubMed] [Google Scholar]
- 13.Brenner DJ, Hall EJ. Computed tomography—an increasing source of radiation exposure. N Engl J Med. 2007;357:2277–2284. doi: 10.1056/NEJMra072149. [DOI] [PubMed] [Google Scholar]
- 14.Kline JA. Further illumination of the test threshold approach in the care of emergency department patients with symptoms of pulmonary embolism. Ann Emerg Med. 2010;55:327–330. doi: 10.1016/j.annemergmed.2010.01.005. [DOI] [PubMed] [Google Scholar]
- 15.Kline JA, Webb WB, Jones AE, Hernandez-Nino J. Impact of a rapid rule-out protocol for pulmonary embolism on the rate of screening, missed cases, and pulmonary vascular imaging in an urban US emergency department. Ann Emerg Med. 2004;44:490–502. doi: 10.1016/j.annemergmed.2004.03.018. [DOI] [PubMed] [Google Scholar]


