

Abstract
Background
Healthcare acquired infections (HAIs) are a leading cause of morbidity and mortality after cardiac surgery. Prior work has identified a number of patient-related risk factors associated with HAIs. We hypothesized that rates of HAIs would differ across institutions, in part attributed to differences in case mix.
Methods and Results
We analyzed 20,896 patients undergoing isolated coronary artery bypass grafting (CABG) surgery at 33 medical centers in Michigan between 1/1/2009–6/30/2012. Overall HAIs included pneumonia, sepsis/septicemia, and surgical site infections, including deep sternal wound, thoracotomy, and harvest/cannulation site infections. We excluded patients presenting with endocarditis. Predicted rates of HAIs were estimated using multivariable logistic regression. Overall rate of HAI was 5.1% (1,071 of 20,896) [isolated pneumonia: 3.1% (n=644), isolated sepsis/septicemia: 0.5% (n=99), isolated deep sternal wound infection: 0.5% (n=96), isolated harvest/cannulation site: 0.5% (n=97), isolated thoracotomy: 0.02% (n=5), multiple infections: 0.6% (n=130)]. HAI subtypes differed across strata of center-level HAI rates. While predicted risk of HAI differed in absolute terms by 2.8% across centers (3.9%–6.7%, min:max), observed rates varied 18.2% (0.9%–19.1%).
Conclusions
There was an 18.2% difference in observed HAI rates across medical centers among patients undergoing isolated CABG surgery. This variability could not be explained by patient case mix. Future work should focus on the impact of other factors (e.g. organizational and systems of clinical care) on risk of HAIs.
Keywords: infection, surgery, cardiopulmonary bypass
INTRODUCTION
Healthcare-acquired infections (HAIs) occur in up to 3.5% of patients undergoing coronary artery bypass grafting (CABG) surgery.1 In 2008, Medicare stopped reimbursing hospitals for the treatment of mediastinitis following CABG surgery, given that it is a byproduct of the care received during the hospitalization and exposes patients to elevated risk of morbidity and mortality.2 Though mediastinitis has received the lion’s share of attention, patients may develop a broader spectrum of HAIs, including pneumonia, sepsis, septicemia, and other surgical site infections including leg, superficial, and deep sternal wound infections. Patients exposed to HAIs experience elevated morbidity and mortality,1 and may incur an additional $30,000–$50,000 of expenditures related to their hospitalization.3, 4
Prior work has informed our understanding of the epidemiology of HAIs in the setting of cardiac surgery. Fowler and colleagues reported an infection rate of 3.7% within a national dataset of over 300,000 adult cardiac surgical procedures.1 These data were used to develop a risk prediction model for HAIs; the model included 12 commonly available pre- and intra-operative variables. Pasquali and colleagues reported a similar rate of infections within a congenital cardiac surgical population, although they also noted variability across participating centers (0.9%–9.8%) and higher utilization rates and costs among centers with higher infection rates.5 Less is known regarding institution-level variability in HAI rates within the adult cardiac surgical population.
This prospective cohort study was undertaken to compare observed and expected rates of HAIs across all 33 institutions performing isolated CABG surgery in the state of Michigan.
METHODS
Patient Population
The Michigan Society of Thoracic and Cardiovascular Surgeons Quality Collaborative (MSTCVS-QC) is a multidisciplinary group consisting of all 33 hospitals performing adult cardiac surgery in the state of Michigan.6, 7 It began in 2001 as a cardiac surgeon-led quality collaborative extension of the Michigan Society of Thoracic and Cardiovascular Surgeons, and eventually became partially funded by the Blue Cross/Blue Shield of Michigan insurance company. Initial and subsequent quality efforts have focused on un-blinded and transparent data review of process and outcome measures for all participating programs, with the intention of improving the outcome of cardiac surgery throughout the state of Michigan. The Collaborative meets quarterly to review various process and outcome results such as internal mammary artery utilization, operative mortality, incidence of stroke, renal failure, wound infection, prolonged ventilation, and blood utilization, among others.
All programs in the MSTCVS-QC utilize the Society of Thoracic Surgeons (STS) data collection form and submit data on a quarterly basis to both the STS database and the MSTCVS-QC data warehouse. Data managers meet quarterly for ongoing education and training in data abstraction and outcomes reporting. In addition, there are scheduled conference calls and webinars that focus specifically on issues related to institutional quality initiatives and/or data definitions. Data audits are conducted annually by a core group of trained quality collaborative nurses to ensure data integrity. Audits for all 33 MSTCVS hospitals are performed either as an on-site audit over a 2-day period, or as a remote desk audit through electronic medical record access. Audits entail review of a total of 20 records. During each audit, values on 76 data variables (including those related to post-operative infections) within the patient’s medical record are compared against submitted records. The STS adult cardiac surgery database training manual is used to define all infections, which does not include post-operative urinary tract infections. Since November 2012, 18 MSTCVS-QC hospitals have been audited, with an overall accuracy score of 98.1%. All hospitals are encouraged to correct discrepancies and resubmit all corrected data to the MSTCVS data warehouse.
Adult cases with operative dates between January 1, 2009 and June 30, 2012 were considered for inclusion. We excluded cases in which the patient presented with active or treated endocarditis, leaving a total of 20,896 isolated CABG procedures retained for analysis.
We received IRB approval for the study (HUM00084088) from the University of Michigan’s Institutional Review Board, with a waiver of informed consent.
Outcome Measures
Infection was defined as the presence of any pneumonia, sepsis or septicemia, harvest or cannulation site infection, deep sternal wound infection, or thoracotomy/parasternal site infection.
Statistical Analysis
Covariates were chosen and categorized based on prior work by Fowler and colleagues1; a small number of variables was modified or excluded after accounting for differences across the versions of the STS data form used during the time period of the study.
A generalized linear mixed model was used to compute predicted rates of infection. The model accounted for center- and surgeon-level variation using random intercepts. Because surgeons may practice at multiple centers, these effects were not nested. Variables found significant during univariate analysis were considered for inclusion in the model. A time variable by year was included to account for trends over time. The final model, based on backwards selection, retained those covariates with p<0.10, including age, body mass index, cardiovascular disease, smoking status, ejection fraction, dyslipidemia, hypertension, chronic lung disease, immunosuppressive therapy, peripheral arterial disease, diabetes mellitus, congestive heart failure, New York Heart Association Class, cardiogenic shock, and anticoagulant usage.
Predicted probabilities of infection were determined based solely on the fixed effects (patient characteristics) of the mixed model. The predicted rate for a center is interpreted as the rate given the patient characteristics in that center, assuming all centers and surgeons perform as a typical center and surgeon. Therefore, differences in predicted rates are due to differences in case mix only. Centers were categorized as having low (<4.5%, n=14), medium (4.5–6.9%, n=15), or high (≥7.0%, n=4) observed infection rates.
Infection subtypes were compared within strata of center rates. Any case with two or more infection types was placed into the “multiple infections” category. Isolated thoracotomy incision cases were excluded from statistical comparisons of subtypes due to small sample sizes within this category.
Demographics are presented as the number and percentage or mean and standard deviation. Infected and non-infected cases were compared using the Student’s t-test, chi-square and Fisher’s exact test, as appropriate.
RESULTS
The overall rate of HAI was 5.1% (1,071 of 20,896).
Pre-operative characteristics of patients (stratified by the presence or absence of infections) are displayed in Table 1. As expected, patients developing infections are more likely to be older, have higher body mass index, and have greater extent of comorbid disease. Our final pre-operative model that was used to derive our predicted rates is shown in Table 2. The C statistic for our risk model was 0.75.
Table 1.
Pre- and Intra-operative Characteristics
| Overall (N = 20,896) |
Infection (N = 1,071) |
No Infection (N = 19,825) |
p | |
|---|---|---|---|---|
| Demographics | ||||
| Age, Mean (SD) | 65.0 (10.5) | 66.7 (10.9) | 64.9 (10.5) | < 0.001 |
| < 55, N (%) | 3458 (16.5) | 152 (14.2) | 3306 (16.7) | < 0.001 |
| 55 – 59, N (%) | 2814 (13.5) | 122 (11.4) | 2692 (13.6) | |
| 60 – 64, N (%) | 3545 (17.0) | 164 (15.3) | 3381 (17.1) | |
| 65 – 69, N (%) | 3726 (17.8) | 184 (17.2) | 3542 (17.9) | |
| 70 – 74, N (%) | 3137 (15.0) | 171 (16.0) | 2966 (15.0) | |
| 75 – 79, N (%) | 2427 (11.6) | 139 (13.0) | 2288 (11.5) | |
| 80 – 84, N (%) | 1401 (6.7) | 105 (9.8) | 1296 (6.5) | |
| ≥ 85, N (%) | 388 (1.9) | 34 (3.2) | 354 (1.8) | |
| Race: White, N (%) | 18629 (89.2) | 910 (85.0) | 17719 (89.4) | < 0.001 |
| Gender: Male, N (%) | 15199 (72.7) | 742 (69.3) | 14457 (72.9) | 0.009 |
| BMI | ||||
| Mean (SD) | 30.3 (6.1) | 31.3 (7.3) | 30.3 (6) | < 0.001 |
| ≤ 30, N (%) | 11184 (53.5) | 503 (47.0) | 10681 (53.9) | < 0.001 |
| 30 – 40, N (%) | 8267 (39.6) | 442 (41.3) | 7825 (39.5) | |
| > 40, N (%) | 1445 (6.9) | 126 (11.8) | 1319 (6.7) | |
| Comorbid Disease | ||||
| Dyslipidemia, N (%) | 18431 (88.2) | 921 (86.0) | 17510 (88.3) | 0.021 |
| Hypertension, N (%) | 18392 (88.0) | 984 (91.9) | 17408 (87.8) | 0.000 |
| Smoker*, N (%) | 6199 (29.7) | 394 (36.8) | 5805 (29.3) | < 0.001 |
| Chronic Lung Disease, N (%) | < 0.001 | |||
| None | 15417 (73.8) | 630 (58.8) | 14787 (74.6) | |
| Mild | 3151 (15.1) | 215 (20.1) | 2936 (14.8) | |
| Moderate | 1233 (5.9) | 84 (7.8) | 1149 (5.8) | |
| Severe | 1095 (5.2) | 142 (13.3) | 953 (4.8) | |
| Immunosuppresive therapy, N (%) | 740 (3.5) | 85 (7.9) | 655 (3.3) | < 0.001 |
| Peripheral Arterial Disease, N (%) | 3437 (16.4) | 307 (28.7) | 3130 (15.8) | < 0.001 |
| CVD, N (%) | 3277 (15.7) | 241 (22.5) | 3036 (15.3) | < 0.001 |
| Prior CVA, N (%) | 1533 (7.3) | 116 (10.8) | 1417 (7.1) | < 0.001 |
| Diabetes Mellitus, N (%) | 8798 (42.1) | 540 (50.4) | 8258 (41.7) | < 0.001 |
| Dialysis, N (%) | 480 (2.3) | 40 (3.7) | 440 (2.2) | 0.001 |
| Anticoagulants, N (%) | 9088 (43.5) | 561 (52.4) | 8527 (43.0) | < 0.001 |
| Cardiac anatomy and function | ||||
| Prior CABG Procedure, N (%) | 631 (3.0) | 37 (3.5) | 594 (3.0) | 0.393 |
| Prior Valve Procedure, N (%) | 44 (0.2) | 4 (0.4) | 40 (0.2) | 0.286 |
| Prior Other Cardiac Procedure, N (%)** | 170 (0.8) | 4 (0.4) | 166 (0.8) | 0.115 |
| Valvular insufficiency, moderate or severe, N (%) | 1678 (8.0) | 123 (11.5) | 1555 (7.8) | < 0.001 |
| Number of Diseased Vessels, N (%) | < 0.001 | |||
| None | 36 (0.2) | 2 (0.2) | 34 (0.2) | |
| One | 862 (4.1) | 21 (2.0) | 841 (4.2) | |
| Two | 4319 (20.7) | 181 (16.9) | 4138 (20.9) | |
| Three | 15679 (75.0) | 867 (81.0) | 14812 (74.7) | |
| Cardiogenic shock, N (%) | 346 (1.7) | 69 (6.4) | 277 (1.4) | < 0.001 |
| Ejection Fraction, N (%) | < 0.001 | |||
| Not Done | 250 (1.2) | 23 (2.1) | 227 (1.1) | |
| ≤ 35 | 2706 (12.9) | 221 (20.6) | 2485 (12.5) | |
| 35 – 50 | 5992 (28.7) | 331 (30.9) | 5661 (28.6) | |
| > 50 | 11948 (57.2) | 496 (46.3) | 11452 (57.8) | |
| CHF, N (%) | 2579 (12.3) | 289 (27.0) | 2290 (11.6) | < 0.001 |
| NYHA Class, N (%)*** | < 0.001 | |||
| Class I | 87 (0.4) | 8 (2.8) | 79 (3.4) | |
| Class II | 536 (2.6) | 41 (14.2) | 495 (21.6) | |
| Class III | 1066 (5.1) | 105 (36.3) | 961 (42.0) | |
| Class IV | 890 (4.3) | 135 (46.7) | 755 (33.0) | |
BMI indicates body mass index; CVD, cerebrovascular disease; CVA, cerebrovascular accident; CABG, coronary artery bypass graft; CHF, chronic heart failure; NYHA, New York Heart Association
Indicates if the patient had smoked cigarettes any time during the year prior to the procedure
Current cigarette smoking was available in STS 2.73 but not in 2.61
This is "other cardiac" (non-CABG, non-Valve), meaning "previous intrapericardial or great vessel procedures".
Available only for those with CHF
Table 2.
Model for Prediction of Healthcare-Acquired Infections*
| OR | 95% CI | p | |
|---|---|---|---|
| (Intercept) | 0.01 | (0.01, 0.02) | < 0.001 |
| Year | |||
| 2009 | Reference | Reference | Reference |
| 2010 | 0.93 | (0.79, 1.10) | 0.417 |
| 2011 | 0.99 | (0.84, 1.18) | 0.940 |
| 2012 | 0.92 | (0.75, 1.14) | 0.467 |
| Age | |||
| < 55 | Reference | Reference | Reference |
| 55 – 59 | 1 | (0.78, 1.28) | 0.983 |
| 60 – 64 | 1.07 | (0.84, 1.35) | 0.595 |
| 65 – 69 | 1.26 | (1.00, 1.59) | 0.053 |
| 70 – 74 | 1.43 | (1.12, 1.83) | 0.004 |
| 75 – 79 | 1.67 | (1.29, 2.17) | <0.001 |
| 80 – 84 | 2.28 | (1.71, 3.04) | <0.001 |
| ≥ 85 | 2.86 | (1.87, 4.35) | <0.001 |
| BMI | |||
| ≤ 30 | Reference | Reference | Reference |
| 30 – 40 | 1.4 | (1.21, 1.61) | <0.001 |
| > 40 | 2.45 | (1.96, 3.06) | <0.001 |
| CVD | 1.18 | (1.00, 1.38) | 0.046 |
| Smoker | 1.48 | (1.27, 1.72) | <0.001 |
| Ejection Fraction | |||
| Not Done | 1.75 | (1.09, 2.81) | 0.020 |
| ≤ 35 | 1.23 | (1.02, 1.49) | 0.030 |
| 35 – 50 | 1.16 | (1.00, 1.34) | 0.056 |
| > 50 | Reference | Reference | Reference |
| Dyslipidemia | 0.75 | (0.62, 0.91) | 0.003 |
| Hypertension | 1.37 | (1.07, 1.74) | 0.011 |
| Chronic Lung Disease: Mild, Moderate or Severe | 1.55 | (1.35, 1.79) | <0.001 |
| Immunosuppresive therapy | 1.97 | (1.53, 2.54) | <0.001 |
| Peripheral Arterial Disease | 1.72 | (1.48, 2.00) | <0.001 |
| Diabetes Mellitus | 1.18 | (1.03, 1.35) | 0.016 |
| CHF, non-Class IV | 1.53 | (1.25, 1.86) | <0.001 |
| NYHA Class IV | 2.19 | (1.74, 2.77) | <0.001 |
| Cardiogenic shock | 3.42 | (2.49, 4.69) | <0.001 |
| Anticoagulants | 1.22 | (1.07, 1.40) | 0.003 |
BMI indicates body mass index; CVD, cerebrovascular disease; CHF, congestive heart failure; NYHA, New York Heart Association.
C-statistic 0.75
Rates of HAI subtypes varied: isolated pneumonia: 3.1% (n=644), isolated sepsis/septicemia: 0.5% (n=99), isolated deep sternal wound infection: 0.5% (n=96), isolated harvest/cannulation site: 0.5% (n=97), isolated thoracotomy: 0.02% (n=5), and multiple infections: 0.6% (n=130).
We explored whether HAI subtypes varied across centers (Figure 1). HAIs at low-rate centers were predominantly driven by isolated pneumonia (49%), followed by isolated harvest/cannulation site infection (17%) and isolated deep sternal wound infection (12%). In contrast, HAIs at high-rate centers were driven predominantly by isolated pneumonia (70%), multiple infections (14%), and sepsis/septicemia (10%). The rate of isolated pneumonia varied from 1.5% in low HAI rate centers to 8.4% in high HAI rate centers. The rate of HAI subtypes across centers is shown in Figure 1.
Figure 1.
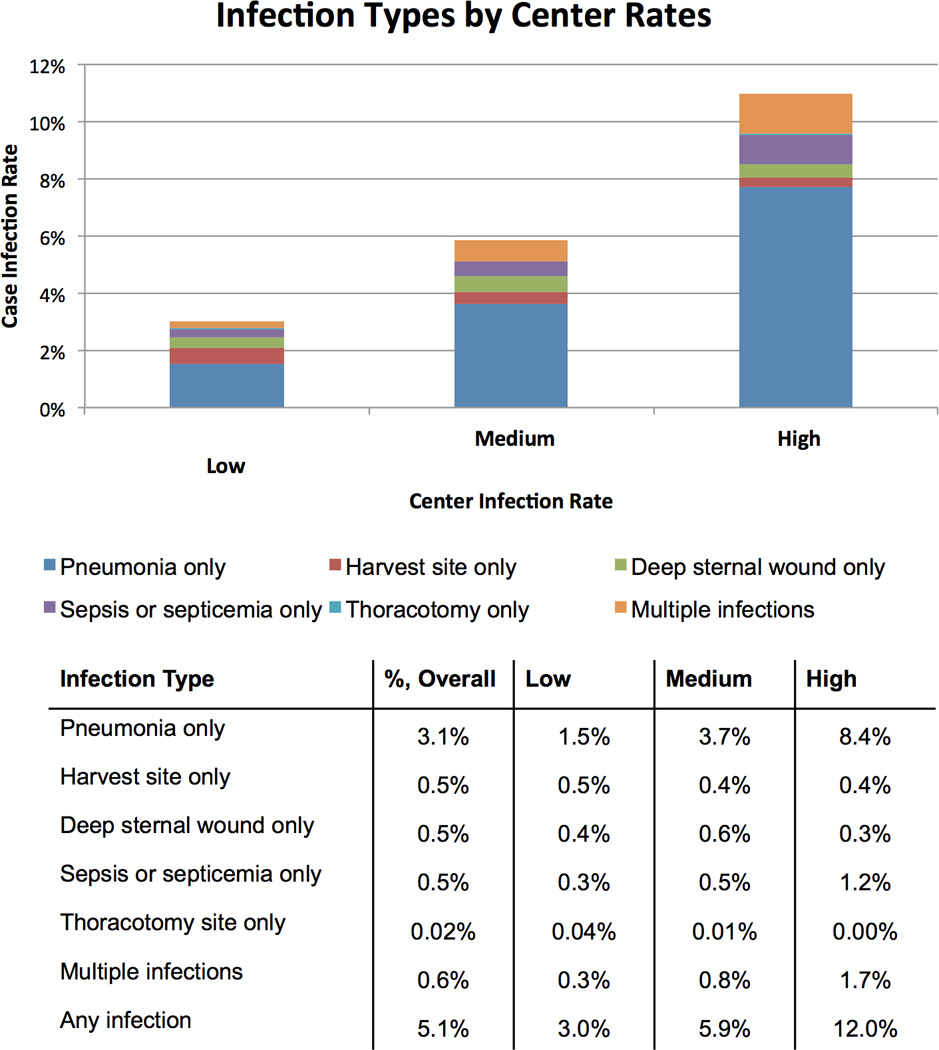
Hospital-acquired infection subtype by strata of medical center. Centers are categorized as having low (<4.5%, n=14), medium (4.5–6.9%, n=15), or high (≥7.0%, n=4) infection rates. Rates of infection subtypes (pneumonia only, harvest site only, deep sternal wound only, sepsis or septicemia only, thoracotomy only, multiple infections) are reported across each strata of center.
Comparison of the observed and predicted HAI rate across centers is displayed in Figure 2. The median (25th, 75th percentile) for the observed and predicted rates across centers is 5.5% (3.4%, 6.2%) and 4.7% (4.3%, 5.2%), respectively. Predicted risk of HAI differed in absolute terms by 2.8% across centers, while observed rates differed by 18.2% (Figure 2).
Figure 2.
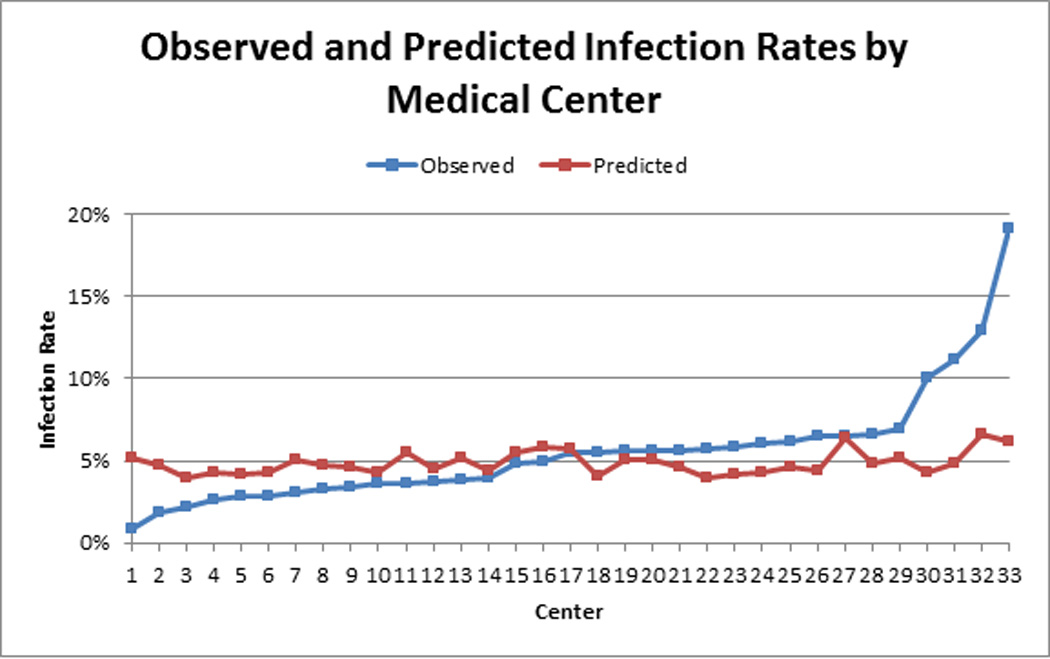
Observed and predicted infection rates by medical center. Predicted rates were estimated based on year of procedure, age, body mass index, cerebrovascular disease, smoking, ejection fraction, dyslipidemia, hypertension, chronic lung disease, immunosuppressive therapy, peripheral arterial disease, diabetes mellitus, congestive heart failure, NY Heart Association Class, cardiogenic shock, and use of anticoagulants.
DISCUSSION
We leveraged an audited a statewide cardiac surgical registry to identify the variability in center-specific HAI rates. Our findings predicted a 2.8% absolute difference in HAI rates across centers due to differences in case mix. However, we observed an 18.2% absolute difference in actual rates of HAI. Isolated pneumonia was the predominant HAI subtype, followed by patients having multiple infections. Relative to patients at low HAI rate centers, patients at high HAI rate centers proportionally had more isolated pneumonia and multiple infections and less isolated harvest cannulation site infections.
Investigators have defined HAIs differently, thus complicating direct comparisons of HAI rates across published reports. Traditionally, investigators have reported infections related specifically to the surgical and harvest site, with a primary focus on deep sternal wound infections. Using this lens, deep sternal wound infection rates range from 0.4%–1.8%1, 8–14, while the overall surgical site infection rate (including superficial sternal and lower extremity harvest or cannulation site infections) has been reported between 3.0%–8.5%.8–10 While less frequently reported, cardiac surgery patients may develop a broader spectrum of infections, including sepsis or septicemia (0.95%)3 and pneumonia (3.6%)8. The variation across centers in infection rates in our present study is consistent with findings reported by Pasquali and colleagues illustrating variation in infections across medical centers for patients in the setting of congenital heart surgery.5
Prior work has demonstrated the short- and long-term risks and costs associated with infections following cardiac surgery. Fowler and colleagues demonstrated that patients developing major infections (surgical site infections or septicemia) after CABG surgery were more likely to experience prolonged lengths of stay >14 days (47.0% vs. 5.9%) or death (17.3% vs. 3.0%).1 Braxton and colleagues examined the long-term impact of mediastinitis on 4-year survival following isolated CABG surgery for patients in Northern New England. Patients developing mediastinitis had significantly higher risk of mortality (35% vs. 11%), with an adjusted hazards ratio of 3.09, p<0.001.2 Within the state of Michigan, patients exposed to non-surgical site infections such as sepsis or pneumonia at low mortality hospitals experience 20.3% and 7.6% mortality rates, respectively.15 Beyond the risk of mortality, exposure to an HAI is associated with an additional cost of $30,000–$50,000.3 Within a congenital heart surgery population, Pasquali and colleagues reported that 15% of the variability in length of stay and cost across 28 participating hospitals was explained by variation in HAIs.5
Our group and others have demonstrated the value of utilizing quality improvement collaboratives as a vector for engaging frontline clinical team members. The Northern New England Cardiovascular Disease Study Group (NNECDSG) documented the benefit of systematically training and supporting clinical staff members in quality improvement methods. Clinical registry data were coupled with generalizable knowledge from the literature to help establish best practices. The group reported a 24% reduction in in-hospital mortality subsequent to CABG through the active engagement of front-line clinical team members.16 Our statewide collaborative has used similar strategies to markedly improve the utilization of the internal mammary artery in CABG surgery, especially among initially low-rate centers, as well as reduce blood utilization.6, 17 Other regional collaboratives throughout the state of Michigan (e.g., the Michigan Surgical Quality Collaborative and the Michigan Bariatric Surgery Collaborative) have effectively engaged clinical teams across a number of surgical domains, including bariatric, general, and vascular surgery.18 In all cases, sustainable improvements are a consequence of identifying best practices across institutions, understanding sources of this variation in terms of discrete processes of clinical care, engaging frontline clinicians, and implementing and assessing the impact of changes in practice. Share and colleagues estimated that the Michigan Surgical Quality Collaborative specifically prevented surgical complications among 2,500 patients, and saved $20 million annually.18
Traditional approaches to improving cardiac surgery have focused on modifying surgical practices in the operating room. Such strategies have included the wide-scale adoption of minimally invasive approaches for harvesting the saphenous vein.19 Nonetheless, our current data suggest that this conceptual model may yield only modest gains. Targeted efforts to reduce HAI rates likely should focus on reducing other types of infections. In the context of these findings, stakeholder engagement by collaborators outside of the traditional clinical boundaries of cardiac surgery is paramount to better understanding the best practices for post-operative critical care. In our analysis, pneumonia was a primary driver of HAI rates. Interventions aimed at preventing pneumonia and other pulmonary complications may include: encouraging pre-operative respiratory muscle training20 and smoking cessation,21, 22 improving post-operative analgesia,23, 24 encouraging post-operative incentive spirometry use,25 and selective use of post-operative continuous positive airway pressure.26, 27 Future research is warranted to assess the effectiveness of these interventions in reducing the pneumonia-related HAI rates in this setting.
Pronovost, working with colleagues from the Michigan Health and Hospital Association Keystone Collaborative, recently leveraged such a multi-disciplinary approach to reduce bloodstream infections.28 The investigators developed and implemented best practices across 108 intensive care units in Michigan, yielding a 66% reduction in the rate of catheter-related bloodstream infections. Would such an approach work for reducing HAIs in the setting of cardiac surgery?
While clinical registry data is certainly important for engaging clinical staff members, other factors may also have important contributions for optimizing HAI performance. There is a growing understanding that checklists and computer-based reminders, while helpful in formulating treatment algorithms, may not be the only adjunct to ensure appropriate HAI prevention.29 Effective institutional practices likely include a deeply rooted culture of safety, institutional certified infection control experts, and strong leadership.30–32 Such factors are not traditionally collected through clinical registry data, thus hiding their impact from traditional risk models and quality assurance activities.31–33 In our analysis, four centers appear to be high outliers for observed HAI rates. However, the predicted rate of HAI does not differ markedly from other centers, suggesting that this difference in observed HAI rates is not due to differences in case mix. Institutional and/or surgeon-level factors may play a role in explaining this variation. The impact of these factors on HAI rates is the subject of future investigation by our group.
We recognize some limitations to the present study. First, while we cannot rule out any potential reporting bias concerning HAI rates, centers within the state of Michigan are audited for completeness and accuracy of their data randomly by both the Society of Thoracic Surgeons and automatically every other year by the MSTCVS-QC. Second, our dataset does not contain information regarding post-discharge infections other than surgical site infections, resulting in a potential underestimation of the true rate. Nonetheless, we used standardized measures derived and used by the Society of Thoracic Surgeons in the adult cardiac surgical database. Third, as in any non-randomized trial, we cannot rule out the effects of unmeasured confounding. Nonetheless, we have adjusted for commonly cited patient-level factors and accounted for center- and surgeon-level variation in our hierarchical model.
In summary, we demonstrate large variation in HAI rates following cardiac surgery across all 33 hospitals participating in the MSTCVS-QC, even after adjustment. The observed variation is largely due to rates of pneumonia and multiple infections across centers. We hypothesize that efforts to reduce this variation should focus on developing and supporting multi-disciplinary clinical care teams across traditional silos of care.
Supplementary Material
Acknowledgments
The authors wish to acknowledge the editorial review provided by Amanda Schuetz.
Funding Sources: This project was supported by grant number R01HS022535 from the Agency for Healthcare Research and Quality. The content is solely the responsibility of the authors and does not necessarily represent the official views of the Agency for Healthcare Research and Quality. Terry Shih is supported by a grant from the National Institutes of Health (5T32HL07612309).
Footnotes
Disclosures: The authors have no disclosures.
References
- 1.Fowler VG, Jr, O'Brien SM, Muhlbaier LH, Corey GR, Ferguson TB, Peterson ED. Clinical predictors of major infections after cardiac surgery. Circulation. 2005;112:I358–I365. doi: 10.1161/CIRCULATIONAHA.104.525790. [DOI] [PubMed] [Google Scholar]
- 2.Braxton JH, Marrin CA, McGrath PD, Ross CS, Morton JR, Norotsky M, Charlesworth DC, Lahey SJ, Clough RA, O'Connor GT. Northern New England Cardiovascular Disease Study Group. Mediastinitis and long-term survival after coronary artery bypass graft surgery. Ann Thorac Surg. 2000;70:2004–2007. doi: 10.1016/s0003-4975(00)01814-2. [DOI] [PubMed] [Google Scholar]
- 3.Brown PP, Kugelmass AD, Cohen DJ, Reynolds MR, Culler SD, Dee AD, Simon AW. The frequency and cost of complications associated with coronary artery bypass grafting surgery: Results from the United States Medicare Program. Ann Thorac Surg. 2008;85:1980–1986. doi: 10.1016/j.athoracsur.2008.01.053. [DOI] [PubMed] [Google Scholar]
- 4.Speir AM, Kasirajan V, Barnett SD, Fonner E., Jr Additive costs of postoperative complications for isolated coronary artery bypass grafting patients in Virginia. Ann Thorac Surg. 2009;88:40–45. doi: 10.1016/j.athoracsur.2009.03.076. discussion 45–46. [DOI] [PubMed] [Google Scholar]
- 5.Pasquali SK, Sun JL, d'Almada P, Jaquiss RD, Lodge AJ, Miller N, Kemper AR, Lannon CM, Li JS. Center variation in hospital costs for patients undergoing congenital heart surgery. Circ Cardiovasc Qual Outcomes. 2011;4:306–312. doi: 10.1161/CIRCOUTCOMES.110.958959. [DOI] [PMC free article] [PubMed] [Google Scholar]
- 6.Johnson SH, Theurer PF, Bell GF, Maresca L, Leyden T, Prager RL. A statewide quality collaborative for process improvement: Internal mammary artery utilization. Ann Thorac Surg. 2010;90:1158–1164. doi: 10.1016/j.athoracsur.2010.05.047. discussion 1164. [DOI] [PubMed] [Google Scholar]
- 7.Prager RL, Armenti FR, Bassett JS, Bell GF, Drake D, Hanson EC, Heiser JC, Johnson SH, Plasman FB, Shannon FL, Share D, Theurer P, Williams J. Cardiac surgeons and the quality movement: The Michigan experience. Semin Thorac Cardiovasc Surg. 2009;21:20–27. doi: 10.1053/j.semtcvs.2009.03.008. [DOI] [PubMed] [Google Scholar]
- 8.Alwaqfi NR, Khader YS, Ibrahim KS, Eqab FM. Coronary artery bypass grafting: 30-day operative morbidity analysis in 1046 patients. J Clin Med Res. 2012;4:267–273. doi: 10.4021/jocmr1020w. [DOI] [PMC free article] [PubMed] [Google Scholar]
- 9.Berrios-Torres SI, Mu Y, Edwards JR, Horan TC, Fridkin SK. Improved risk adjustment in public reporting: Coronary artery bypass graft surgical site infections. Infect Control Hosp Epidemiol. 2012;33:463–469. doi: 10.1086/665313. [DOI] [PubMed] [Google Scholar]
- 10.Cristofolini M, Worlitzsch D, Wienke A, Silber RE, Borneff-Lipp M. Surgical site infections after coronary artery bypass graft surgery: Incidence, perioperative hospital stay, readmissions, and revision surgeries. Infection. 2012;40:397–404. doi: 10.1007/s15010-012-0275-0. [DOI] [PubMed] [Google Scholar]
- 11.ElBardissi AW, Aranki SF, Sheng S, O'Brien SM, Greenberg CC, Gammie JS. Trends in isolated coronary artery bypass grafting: An analysis of the Society of Thoracic Surgeons Adult Cardiac Surgery Database. J Thorac Cardiovasc Surg. 2012;143:273–281. doi: 10.1016/j.jtcvs.2011.10.029. [DOI] [PubMed] [Google Scholar]
- 12.Kubota H, Miyata H, Motomura N, Ono M, Takamoto S, Harii K, Oura N, Hirabayashi S, Kyo S. Deep sternal wound infection after cardiac surgery. J Cardiothorac Surg. 2013;8:132. doi: 10.1186/1749-8090-8-132. [DOI] [PMC free article] [PubMed] [Google Scholar]
- 13.Shahian DM, O'Brien SM, Filardo G, Ferraris VA, Haan CK, Rich JB, Normand SL, DeLong ER, Shewan CM, Dokholyan RS, Peterson ED, Edwards FH, Anderson RP. The Society of Thoracic Surgeons 2008 cardiac surgery risk models: Part 1--coronary artery bypass grafting surgery. Ann Thorac Surg. 2009;88:S2–S22. doi: 10.1016/j.athoracsur.2009.05.053. [DOI] [PubMed] [Google Scholar]
- 14.Milano CA, Kesler K, Archibald N, Sexton DJ, Jones RH. Mediastinitis after coronary artery bypass graft surgery. Risk factors and long-term survival. Circulation. 1995;92:2245–2251. doi: 10.1161/01.cir.92.8.2245. [DOI] [PubMed] [Google Scholar]
- 15.Reddy HG, Shih T, Englesbe MJ, Shannon FL, Theurer PF, Herbert MA, Paone G, Bell GF, Prager RL. Analyzing "failure to rescue": Is this an opportunity for outcome improvement in cardiac surgery? Ann Thorac Surg. 2013;95:1976–1981. doi: 10.1016/j.athoracsur.2013.03.027. discussion 1981. [DOI] [PMC free article] [PubMed] [Google Scholar]
- 16.O'Connor GT, Plume SK, Olmstead EM, Morton JR, Maloney CT, Nugent WC, Hernandez F, Jr, Clough R, Leavitt BJ, Coffin LH, Marrin CA, Wennberg D, Birkmeyer JD, Charlesworth DC, Malenka DJ, Quinton HB, Kasper JF. A regional intervention to improve the hospital mortality associated with coronary artery bypass graft surgery. The Northern New England Cardiovascular Disease Study Group. JAMA. 1996;275:841–846. [PubMed] [Google Scholar]
- 17.Paone G, Brewer R, Likosky DS, Theurer PF, Bell GF, Cogan CM, Prager RL. Transfusion rate as a quality metric: Is blood conservation a learnable skill? Ann Thorac Surg. 2013;96:1279–1286. doi: 10.1016/j.athoracsur.2013.05.045. [DOI] [PubMed] [Google Scholar]
- 18.Share DA, Campbell DA, Birkmeyer N, Prager RL, Gurm HS, Moscucci M, Udow-Phillips M, Birkmeyer JD. How a regional collaborative of hospitals and physicians in Michigan cut costs and improved the quality of care. Health Aff (Millwood) 2011;30:636–645. doi: 10.1377/hlthaff.2010.0526. [DOI] [PubMed] [Google Scholar]
- 19.Dacey LJ, Braxton JH, Jr, Kramer RS, Schmoker JD, Charlesworth DC, Helm RE, Frumiento C, Sardella GL, Clough RA, Jones SR, Malenka DJ, Olmstead EM, Ross CS, O'Connor GT, Likosky DS. Long-term outcomes of endoscopic vein harvesting after coronary artery bypass grafting. Circulation. 2011;123:147–153. doi: 10.1161/CIRCULATIONAHA.110.960765. [DOI] [PubMed] [Google Scholar]
- 20.Hulzebos EH, Helders PJ, Favie NJ, De Bie RA, Brutel de la Riviere A, Van Meeteren NL. Preoperative intensive inspiratory muscle training to prevent postoperative pulmonary complications in high-risk patients undergoing cabg surgery: A randomized clinical trial. JAMA. 2006;296:1851–1857. doi: 10.1001/jama.296.15.1851. [DOI] [PubMed] [Google Scholar]
- 21.Arabaci U, Akdur H, Yigit Z. Effects of smoking on pulmonary functions and arterial blood gases following coronary artery surgery in turkish patients. Jpn Heart J. 2003;44:61–72. doi: 10.1536/jhj.44.61. [DOI] [PubMed] [Google Scholar]
- 22.Al-Sarraf N, Thalib L, Hughes A, Tolan M, Young V, McGovern E. Effect of smoking on short-term outcome of patients undergoing coronary artery bypass surgery. Ann Thorac Surg. 2008;86:517–523. doi: 10.1016/j.athoracsur.2008.03.070. [DOI] [PubMed] [Google Scholar]
- 23.Lahtinen P, Kokki H, Hynynen M. Pain after cardiac surgery: A prospective cohort study of 1-year incidence and intensity. Anesthesiology. 2006;105:794–800. doi: 10.1097/00000542-200610000-00026. [DOI] [PubMed] [Google Scholar]
- 24.Taillefer MC, Carrier M, Belisle S, Levesque S, Lanctot H, Boisvert AM, Choiniere M. Prevalence, characteristics, and predictors of chronic nonanginal postoperative pain after a cardiac operation: A cross-sectional study. J Thorac Cardiovasc Surg. 2006;131:1274–1280. doi: 10.1016/j.jtcvs.2006.02.001. [DOI] [PubMed] [Google Scholar]
- 25.Haeffener MP, Ferreira GM, Barreto SS, Arena R, Dall'Ago P. Incentive spirometry with expiratory positive airway pressure reduces pulmonary complications, improves pulmonary function and 6-minute walk distance in patients undergoing coronary artery bypass graft surgery. Am Heart J. 2008;156:900 e901–900 e908. doi: 10.1016/j.ahj.2008.08.006. [DOI] [PubMed] [Google Scholar]
- 26.Zarbock A, Mueller E, Netzer S, Gabriel A, Feindt P, Kindgen-Milles D. Prophylactic nasal continuous positive airway pressure following cardiac surgery protects from postoperative pulmonary complications: A prospective, randomized, controlled trial in 500 patients. Chest. 2009;135:1252–1259. doi: 10.1378/chest.08-1602. [DOI] [PubMed] [Google Scholar]
- 27.Hillis LD, Smith PK, Anderson JL, Bittl JA, Bridges CR, Byrne JG, Cigarroa JE, Disesa VJ, Hiratzka LF, Hutter AM, Jr, Jessen ME, Keeley EC, Lahey SJ, Lange RA, London MJ, Mack MJ, Patel MR, Puskas JD, Sabik JF, Selnes O, Shahian DM, Trost JC, Winniford MD. 2011 AACF/AHA guideline for coronary artery bypass graft surgery: A report of the American College of Cardiology Foundation/American Heart Association Task Force on Practice Guidelines. Circulation. 2011;124:e652–e735. doi: 10.1161/CIR.0b013e31823c074e. [DOI] [PubMed] [Google Scholar]
- 28.Pronovost P, Needham D, Berenholtz S, Sinopoli D, Chu H, Cosgrove S, Sexton B, Hyzy R, Welsh R, Roth G, Bander J, Kepros J, Goeschel C. An intervention to decrease catheter-related bloodstream infections in the ICU. N Engl J Med. 2006;355:2725–2732. doi: 10.1056/NEJMoa061115. [DOI] [PubMed] [Google Scholar]
- 29.Saint S, Krein SL, Manojlovich M, Kowalski CP, Zawol D, Shojania KG. Introducing the patient safety professional: Why, what, who, how, and where? J Patient Saf. 2011;7:175–180. doi: 10.1097/PTS.0b013e318230e585. [DOI] [PMC free article] [PubMed] [Google Scholar]
- 30.Krein SL, Hofer TP, Kowalski CP, Olmsted RN, Kauffman CA, Forman JH, Banaszak-Holl J, Saint S. Use of central venous catheter-related bloodstream infection prevention by US hospitals. Mayo Clin Proc. 2007;82:672–678. doi: 10.4065/82.6.672. [DOI] [PubMed] [Google Scholar]
- 31.Krein SL, Damschroder LJ, Kowalski CP, Forman J, Hofer TP, Saint S. The influence of organizational context on quality improvement and patient safety efforts in infection prevention: A multi-center qualitative study. Soc Sci Med. 2010;71:1692–1701. doi: 10.1016/j.socscimed.2010.07.041. [DOI] [PubMed] [Google Scholar]
- 32.Krein SL, Kowalski CP, Hofer TP, Saint S. Preventing hospital-acquired infections: A national survey of practices reported by US Hospitals in 2005 and 2009. J Gen Intern Med. 2012;27:773–779. doi: 10.1007/s11606-011-1935-y. [DOI] [PMC free article] [PubMed] [Google Scholar]
- 33.Saint S, Kowalski CP, Banaszak-Holl J, Forman J, Damschroder L, Krein SL. The importance of leadership in preventing healthcare-associated infection: Results of a multisite qualitative study. Infect Control Hosp Epidemiol. 2010;31:901–907. doi: 10.1086/655459. [DOI] [PubMed] [Google Scholar]
Associated Data
This section collects any data citations, data availability statements, or supplementary materials included in this article.