Abstract
Chlorogenic acid (ChA) is proposed as the major bioactive compounds of Lonicerae Japonicae Flos (LJF). Forty-two Wistar rats were randomly divided into seven groups to investigate the pharmacokinetics and tissue distribution of ChA, via oral administration of LJF extract, using ibuprofen as internal standard, employing a high performance liquid chromatography in conjunction with tandem mass spectrometry. Analytes were extracted from plasma samples and tissue homogenate by liquid–liquid extraction with acetonitrile, separated on a C 18 column by linear gradient elution, and detected by electrospray ionization mass spectrometry in negative selected multiple reaction monitoring mode. Our results successfully demonstrate that the method has satisfactory selectivity, linearity, extraction recovery, matrix effect, precision, accuracy, and stability. Using noncompartment model to study pharmacokinetics, profile revealed that ChA was rapidly absorbed and eliminated. Tissue study indicated that the highest level was observed in liver, followed by kidney, lung, heart, and spleen. In conclusion, this method was suitable for the study on pharmacokinetics and tissue distribution of ChA after oral administration.
1. Introduction
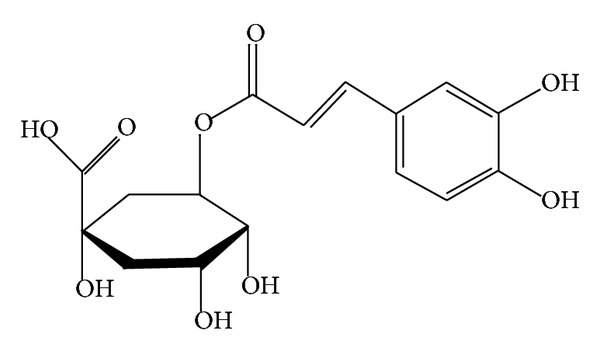
Lonicerae Japonicae Flos (LJF) (Lonicera japonica Thunb), as a traditional Chinese medicine, was used widely in diseases such as wind-heat common cold and hot blood poison dysentery for its main property of clearing heat and detoxication [1]. The accumulated evidence has demonstrated that LJF has dozens of chemical components such as chlorogenic acid (ChA) (Figure 1), adinoside A, and stryspinoside [2, 3]. As the main active ingredient of LJF, ChA not only is the most abundant phenolic acid in LJF but also is usually used to control the quality of the LJF by its exact content [4]. ChA can prevent oxidation and microbial infection, protect cardiovascular system and liver, decrease blood pressure, and attenuate inflammation and pain [5, 6]. Furthermore, ChA can also inhibit the replication and viability of Enterovirus 71 in vitro [7] and show effective activity of antibacterial and antibiofilm [8, 9]. Additionally, ChA can reduce liver inflammation and fibrosis through inhibition of toll-like receptor 4 signaling pathway [10], attenuate ventricular remodeling after myocardial infarction [11], relieve acute and inflammatory pain [12], and prevent from lens opacity and cytotoxicity in human lens epithelial cells [13]. Concerning the multiple biological activity of ChA, investigating the pharmacokinetic profile and tissue distribution of ChA is instant requirement for its clinic application.
Figure 1.

Chemical structures of chlorogenic acid.
In this study, we investigated firstly the pharmacokinetic and tissue distribution of ChA extract from LJF in vivo by using high performance liquid chromatography in conjunction with tandem mass spectrometry (HPLC-MS/MS). A rapid and sensitive HPLC-MS/MS method was developed and validated to describe the pharmacokinetics and tissue distribution of ChA after oral administration of LJF extract in rats.
2. Experiment
2.1. Materials and Reagents
LJF was bought in Changsha. The reference standards of ChA and ibuprofen were supplied by China National Institute for the Control of Pharmaceutical and Biological Products (Beijing, China). Acetonitrile (ACN) and methanol (MEOH), HPLC grade, were acquired from Merck (Darmstadt, Germany). Formic acid was of HPLC grade and purchased from ROE SCIENTIFIC INC. (Beijing, China).
2.2. Animals, Drug Administration, and Sampling
Wistar rats weighting 180–220 g, half male and half female, were purchased from Changsha Tianqing Biotechnology Limited Company (Changsha, China). The rats were housed for 1 week, room temperature (22 ± 2°C), relative humidity (45–60%), and 12 h dark/light cycle controlled facility with free access to food and tap water. In this study, 42 rats were randomly assigned to seven groups, and rats fasted with free access to water for 12 h before being dosed. LJF extract was dissolved with 20% PEG400 and administered orally at a dose of 400 mg/kg.
Blood samples and tissue samples were collected at 10, 30, 60, 120, 180, and 240 min after dose. Blood samples were put into heparinized microcentrifuge tubes, followed by centrifuging at approximately 11000 r/min for 5 min. The resulting plasma layers were separated and stored in microcentrifuge tubes at −80°C until the analysis. Tissue samples were weighed rapidly and put into normal saline solution to remove the blood by blotting on filter paper and were minced and homogenized with physiological saline solution (1 : 2, w/v) thoroughly in ice-bath. These tissue homogenates were stored at −80°C until the analysis.
2.3. Preparation of Calibration Standard and Quality Control Samples
The stock solution of ChA was prepared by accurately weighing 10.00 mg of ChA reference substance into 10 mL volumetric flasks and dissolving in MEOH to give a final concentration of 1.000 g/L, so did ibuprofen. The standard solutions of ChA with concentrations of 78.20, 156.30, 312.50, 625.00, 1250.00, 2500.00, 5000.00, and 10000.00 μg/L were prepared by further dilution of the stock solution with MEOH. The working solutions of ibuprofen (5 mg/L) were obtained by dilution of the stock solution with MEOH. All the solutions were stored at 4°C and brought to room temperature before use.
To prepare the standard calibration samples, 20 μL of ChA standard solutions was added to 200 μL of controlled blank plasma. The mixture was vortex-mixed thoroughly to get the final standard concentrations of 7.820, 15.630, 31.250, 62.500, 125.000, 250.000, 500.000, and 1000.000 μg/L. The quality control (QC) samples with the concentration of 15.630, 125.000, and 800.000 μg/L were prepared by fortifying 20 μL of ChA standard solution to 200 μL of controlled blank plasma. These samples were stored at −20°C.
2.4. Sample Preparation
The preparation of LJF extract was operated as follows: 200 g of LJF with 2000 mL 85% ETOH was refluxed three times each for 2 hours. Subsequently, the solution was concentrated under reduced pressure and dried with microwave, yielding an extract with the content of 16.7% (ChA) detected by HPLC-MC/MC, which was much higher than the content of 2.51% (ChA) in LJF.
Twenty microliters of internal standard liquid (5 mg/L ibuprofen) which was added, during analysis, to 200 μL of biosamples of tissue homogenate, plasma, standard calibration samples, or QC samples followed by addition of 20 μL of internal standard liquid (5 mg/L ibuprofen), was added; then 400 μL of acetonitrile was added to precipitate protein. The biological samples were swirled for 1 min and were centrifuged at 11000 r/min for 10 min at 4°C. The obtained supernatant was filtered via a 0.22 μm filter membrane, and 5 μL of supernatant was injected into the HPLC-MS for analysis.
2.5. Instrumentation and HPLC-MS/MS Conditions
The HPLC-MS/MS system consists of an UFLC-20A high performance liquid chromatograph (Shimadzu Corporation, Japan), including an autosampler and temperature controlled column compartment, and an API 4000 mass spectrometer/mass spectrometer (AB SCIEX, America) with an electrospray ionization source (ESI). The signal acquisition, peak integration, and concentration determination were performed using the Analyst 1.5.1 software, supplied by AB SCIEX (Boston, America), too.
Chromatographic separation was performed on guard column C 18 column (3 μm, 4 mm × 2.0 mm, Phenomenex, Torrance, CA, USA) and Luna C 18 column (3 μm, 50 mm × 2.0 mm, Phenomenex). The autosampler temperature was maintained at 25°C and the column at 4°C. A gradient of 0.01% formic acid in methanol (solvent A) and 0.01% formic acid in water (solvent B) was used as follows: 95% B at 0.00 to 0.50 mins, 20% B at 0.50 to 2.00 mins, and 95% B at 2.00 to 4.50 mins. The flow rate was 0.4 mL/min.
The mass spectrometer equipped with an ESI (in the positive mode) source was performed in negative ion MRM mode, set with the capillary voltage of 4500 V; the pressure of ion source gas (N2) 1 is 4.5 × 10⁵ Pa and 2 is 5.5 × 10⁵ Pa; the air curtain gas (N2) is 2.0 × 10⁵ Pa. The monitor ions of chlorogenic acid are from m/z 353.0 to m/z 191.1, declustering potential (DP) of 56 V, collision energy (CE) of 21 eV, while ibuprofen is from m/z 204.9 to m/z 161.0, DP of 53 V, CE of 11 eV.
2.6. Method Validation
2.6.1. Selectivity
In order to investigate potential interference from endogenous compounds that could coelute with the analyte and the internal standard, 200 μL of blank rat plasma from six different sources with or without standard solutions of ChA and ibuprofen and plasma samples was tested after the administration.
2.6.2. Linearity and Lower Limit of Quantification (LLOQ)
Linearity of calibration curve was determined by plotting the peak area ratio (y) of ChA to internal standard versus the concentration (x) of ChA. Series calibration standards of plasma and different tissues were prepared as descried above for analysis. Results were fitted to linear regression analysis using 1/x as the weighting factor.
2.6.3. Extraction Recovery and Matrix Effect
To calculate recovery, QC samples were analyzed at low (15.63 μg/L), medium (125.00 μg/L), and high (800.00 μg/L) concentration in quintuplicate after the preparation method described above. The peak area of ChA (A1) and ibuprofen (A2) in plasma samples was noted. Besides, 20 μL of internal standards as well as 600 μL of mobile phases was added to each concentration of 200 μL of QC samples followed by swirling for 30 sec. And 5 μL of mix solution was taken for injection. The peak area of ChA (A1′) and ibuprofen (A2′) in blood samples was noted.
The recovery was calculated by using the following formula: ChA in standard plasma samples (%) = A1/A1′; ibuprofen in standard plasma samples (%) = A1/A2′.To calculate matrix effect (ME), 20 μL of internal standards was added to each concentration of 200 μL of QC samples; also, 600 μL of blank plasma or mobile phases, swirled for 30 sec, and 5 μL of mix solution were taken for injection. The peak area of ChA (A3, A4) and ibuprofen (A3′, A4′) in plasma samples was recorded. ME can be determined by using the following formula: ChA in standard plasma samples (%) = A3/A3′; ibuprofen in standard plasma samples (%) = A4/A4′.
2.6.4. Accuracy and Precision
In order to determine the intraday accuracy and precision, five replications of all low, medium, and high concentration QC samples were performed on the same day and calculated each concentration of samples according to the calibration curve. The interday accuracy and precision were assessed by analyzing three batches on different days. The criteria for data acceptability are as follows: accuracy was determined by the ratio of calculated concentration and nominal concentration, precision was evaluated by relative standard derivative (RSD), and both accuracy and precision were within 15%.
2.6.5. Stability
Freeze-thaw stability was determined by assessing the QC samples after three freeze and thaw cycles at room temperature and at −80°C. The short-term stability was evaluated by keeping the QC samples at room temperature for 3 h and 6 h. The postpreparative stability was conducted by reanalyzing the QC samples after 6 h and 12 h in the autosampler at 4°C. The long-term stability of ChA was determined by placing the QC samples at −80°C for 30 days. For all storage conditions, replications of all low, medium, and high concentration QC samples were analyzed after the operation and the experimental results were obtained through chromatographic area and compared with the nominal values.
3. Results
3.1. Method Validation
3.1.1. Selectivity
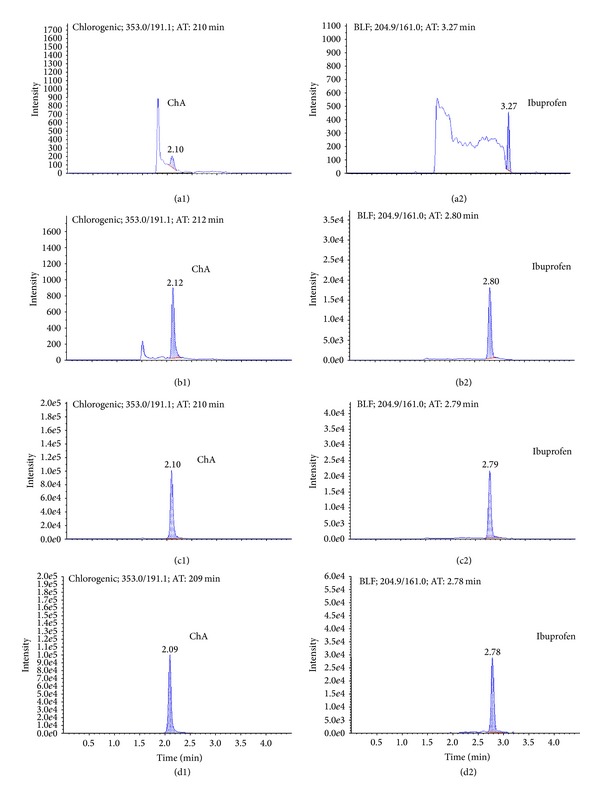
No interfering peaks were observed at the retention time of ChA (2.1 min) and internal standard (ibuprofen, 2.8 min) in all conditions (Figure 2).
Figure 2.

Representative mass spectrum of ChA and ibuprofen. (a1) Blank plasma sample of ChA. (a2) Blank plasma sample of ibuprofen. (b1) Standard calibration plasma sample with ChA at LLOQ level (7.820 μg/L). (b2) Standard calibration plasma sample with ibuprofen at LLOQ level. (c1) Plasma sample after administration of LJF extract of ChA. (c2) Plasma sample after administration of LJF extract of ibuprofen. (d1) Liver sample of ChA. (d2) Liver sample of ibuprofen.
3.1.2. Linearity and Lower Limit of Quantification (LLOQ)
The back-calculated concentrations (mean ± SD) of ChA from the representative calibration standards by HPLC-MS/MS determination were within the acceptance limits. The correlation coefficient of calibration curve is larger than 0.99, suggesting a good linearity within the range from 7.820 μg/L to 1000.000 μg/L. The LLOQ of ChA is 7.820 μg/L in plasma sample and tissues.
3.1.3. Extraction Recovery and Matrix Effect
Extraction recovery and matrix effect were computed. The mean extraction recovery at three concentrations of ChA was 94.7% and of ibuprofen was 93.8%. The mean matrix effect at three concentrations of ChA was 96.7% and of ibuprofen was 94.9%.
3.1.4. Accuracy and Precision
Accuracy and precision data for intra- and interday plasma samples were within the scope of the standard (Table 1). The intra- and interday mean accuracy were within 5.0%; the intra- and interday precision (RSD%) values were less than 8%.
Table 1.
Accuracy and precision of ChA in plasma samples.
| Added concentration (μg/L) | Mean measured concentration (μg/L) | Accuracy (%) |
RSD (%) |
|---|---|---|---|
| Intraday (n = 5) | |||
| 15.63 | 15.70 | 100.4 | 6.4 |
| 125.00 | 127.60 | 102.1 | 7.1 |
| 800.00 | 839.00 | 104.9 | 7.6 |
| Interday (n = 15) | |||
| 15.63 | 15.71 | 100.5 | 6.7 |
| 125.00 | 123.90 | 99.1 | 6.4 |
| 800.00 | 834.00 | 104.3 | 7.9 |
3.1.5. Stability
The stability data of ChA under four conditions are listed in Table 2. The ChA in plasma has been stable for 6 h at room temperature, for 12 h in autosampler, after 3 freeze-thaw cycles, and for 30 days stored at −80°C.
Table 2.
The stability of plasma samples.
| Stability type | Time and n | Added concentration (μg/L) | Mean measured concentration (μg/L) | Accuracy (%) |
RSD (%) |
|---|---|---|---|---|---|
| Short-term stability | 3 h (n = 3) | 15.63 | 14.30 | 91.5 | 7.0 |
| 125.00 | 131.4 | 105.1 | 5.7 | ||
| 800.00 | 825.5 | 103.2 | 3.0 | ||
| 6 h (n = 3) | 15.63 | 14.22 | 91.0 | 6.8 | |
| 125.00 | 133.6 | 106.9 | 6.2 | ||
| 800.00 | 806.5 | 100.8 | 5.4 | ||
|
| |||||
| Postpreparative stability | 6 h (n = 5) | 15.63 | 14.30 | 91.5 | 7.0 |
| 125.00 | 131.4 | 105.1 | 5.7 | ||
| 800.00 | 825.5 | 103.2 | 3.0 | ||
| 12 h (n = 5) | 15.63 | 15.252 | 97.6 | 9.5 | |
| 125.00 | 130.3 | 104.2 | 6.4 | ||
| 800.00 | 842 | 105.3 | 7.1 | ||
|
| |||||
| Freeze-thaw stability | After 3 freeze-thaw cycles (n = 3) |
15.63 | 13.74 | 87.9 | 7.7 |
| 125.00 | 127.3 | 101.9 | 6.4 | ||
| 800.00 | 771.3 | 96.4 | 4.6 | ||
|
| |||||
| Long-term stability | After 30 days (n = 3) | 15.63 | 13.66 | 87.4 | 5.2 |
| 125.00 | 122.1 | 97.7 | 3.1 | ||
| 800.00 | 804.9 | 100.6 | 4.0 | ||
3.2. Pharmacokinetic Analysis
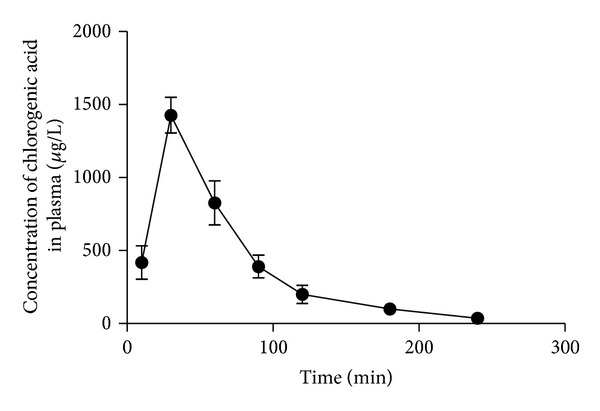
The pharmacokinetic analysis was processed with WinNonlin 6.1 software simulating data with noncompartmental model. Mean plasma concentration-time profile and the corresponding pharmacokinetic parameters of ChA after oral administration are shown in Figure 3 and Table 3. In this study, we found that ChA was absorbed and eliminated rapidly in rats, with low oral bioavailability. The half-lives of ChA in the plasma were about 0.8 h; the t max was 0.58 ± 0.13 h and C max was 1490 ± 0.16 ug/L.
Figure 3.

Plasma concentration-time profiles of ChA after oral administration. Each point represents the mean ± SD of 6 rats.
Table 3.
Pharmacokinetic parameters of ChA in rat plasma after oral administration (n = 6).
| Parameters | Value | Parameters | Value |
|---|---|---|---|
| C max (μg/L) | 1490.00 ± 160.00 | t 1/2 (h) | 0.80 ± 0.54 |
| t max (h) | 0.58 ± 0.13 | AUC0→t (μg∗h/L) | 1700.00 ± 320.00 |
| V/F (L) | 266.85 ± 144.89 | AUC0→∞ (μg∗h/L) | 1730.00 ± 330.00 |
| CL/F (L/h) | 238.53 ± 49.76 | MRT0→t (h) | 1.07 ± 0.09 |
3.3. Tissue Distribution Analysis
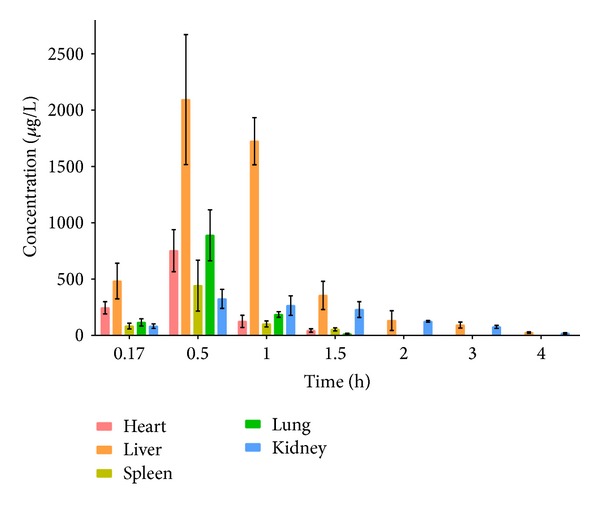
The concentration of ChA was determined in several organs, which indicated that ChA rapidly increased and then decreased accompanied by a wide distribution. Tissue distribution showed that the highest level was in the liver, followed by kidney, lung, heart, and spleen as shown in Figure 4. The concentrations in organs revealed that ChA was metabolized quickly and it almost cannot be detected in tissues after 4 h.
Figure 4.

Tissue distribution of ChA in rats after oral administration. Each point represents the mean ± SD of 6 rats.
4. Discussion
Considering the low solubility of ChA, 20% PEG400 was selected as solubilization to improve the dissolving capacity of ChA. And, according to our preliminary experiments, ChA is mainly distributed to the most abundant blood-supply tissues, such as liver and kidney, which implied that the distribution of ChA might depend on the blood flow and perfusion rate of the organ. Then, we explored the biotransformation of primary ChA in liver and kidney. ChA decreased more rapidly in liver than that in kidney, which showed that liver played a more important role as compared to kidney. Furthermore, it can be inferred that ChA might target liver and induce a protective effect. Farrell et al. have studied the absorption and metabolism of ChA in cultured gastric epithelial monolayers [14], but cell experiment has its intrinsic limits. Pharmacokinetics of ChA extracted from Shuang-Huang-Lian [15], Yin-Huang granules [16], Aidi lyophilizer [17], or Daqingye [18] was also studied, while little in LJF. Other methods, such as HPLC [17, 19], LC-MS/MS [15], RP-HPLC [16], or HPLCDAD [4], were used to detect ChA.
By using the animal experiment, we can explore multiple pharmacological effects of LJF extract (ChA) as possible. And HPLC-MS/MS applied in our study exhibited higher sensitivity than LC-MS/MS. As we know, in vivo study of pharmacokinetic and tissue distribution of LJF extract (ChA) is significantly meaningful. Pharmacokinetic study can contribute to better understand the efficacy and toxicity of ChA, furthermore, tissue distribution study is crucial to discover the main target sites and account for disposition [20]. So, we first found a HPLC-MS/MS method, which is simple, sensitive, and with a highly detective C max and short t max.
Although we established this method and found some important meaningful knowledge, there are still some respects that need to ameliorate. For the pharmacokinetic, further experimental data from animals even human in vivo study is needed to be conducted. For the tissue distribution, we determined the concentration of ChA in each organ; the method which is used for quantification of ChA in tissues needs to be verified, just like the method that is applied in quantification of ChA in rat plasma.
5. Conclusion
In conclusion, for the first time, a rapid, simple, and sensitive HPLC-MS/MS method was validated for the quantification of ChA in rat plasma and tissues. The specificity, linearity, extraction recovery, accuracy, and stability of the method were successfully established.
Acknowledgment
The authors wish to thank Professor Zengrong, Hunan University of Chinese Medicine, for his help in identifying LJF and detecting its content.
Conflict of Interests
The authors declare that there is no conflict of interests regarding the publication of this paper.
References
- 1.Li S, Chang C. Biological effects of chlorogenic acid and body health. Wei Sheng Yan Jiu. 2005;34(6):762–764. [PubMed] [Google Scholar]
- 2.Chen Y, Zhao Y, Wu S, Wang M, Feng X, Liang J. Water-soluble chemical constituents in flower buds of Lonicera macranthoides. Zhong Yao Cai. 2012;35(2):231–234. [PubMed] [Google Scholar]
- 3.Wang F, Jiang Y, Wang X, et al. Chemical constituents from flower buds of Lonicera japonica . Zhongguo Zhongyao Zazhi. 2013;38(9):1378–1385. [PubMed] [Google Scholar]
- 4.Kuixia C, Yingtao Z, Xiuwei Y, et al. Simultaneous quantification of ten phenolic acids in Lonicerae Japonicae Flos by HPLC-DAD. Journal of Chinese Pharmaceutical Sciences. 2013;22(6):521–526. [Google Scholar]
- 5.Zhao Y, Wang J, Ballevre O, Luo H, Zhang W. Antihypertensive effects and mechanisms of chlorogenic acids. Hypertension Research. 2012;35(4):370–374. doi: 10.1038/hr.2011.195. [DOI] [PubMed] [Google Scholar]
- 6.Shang X, Pan H, Li M, Miao X, Ding H. Lonicera japonica Thunb.: ethnopharmacology, phytochemistry and pharmacology of an important traditional Chinese medicine. Journal of Ethnopharmacology. 2011;138(1):1–21. doi: 10.1016/j.jep.2011.08.016. [DOI] [PMC free article] [PubMed] [Google Scholar]
- 7.Li X, Liu Y, Hou X, et al. Chlorogenic acid inhibits the replication and viability of enterovirus 71 in vitro . PLoS ONE. 2013;8(9) doi: 10.1371/journal.pone.0076007.e76007 [DOI] [PMC free article] [PubMed] [Google Scholar]
- 8.Karunanidhi A, Thomas R, Van Belkum A, Neela V. In vitro antibacterial and antibiofilm activities of chlorogenic acid against clinical isolates of stenotrophomonas maltophilia including the trimethoprim/sulfamethoxazole resistant strain. BioMed Research International. 2013;2013:7 pages. doi: 10.1155/2013/392058.392058 [DOI] [PMC free article] [PubMed] [Google Scholar]
- 9.Luis A, Silva F, Sousa S, Duarte AP, Domingues F. Antistaphylococcal and biofilm inhibitory activities of gallic, caffeic, and chlorogenic acids. Biofouling. 2013;30(1):69–79. doi: 10.1080/08927014.2013.845878. [DOI] [PubMed] [Google Scholar]
- 10.Shi H, Dong L, Jiang J, et al. Chlorogenic acid reduces liver inflammation and fibrosis through inhibition of toll-like receptor 4 signaling pathway. Toxicology. 2013;303:107–114. doi: 10.1016/j.tox.2012.10.025. [DOI] [PubMed] [Google Scholar]
- 11.Kanno Y, Watanabe R, Zempo H, Ogawa M, Suzuki J, Isobe M. Chlorogenic acid attenuates ventricular remodeling after myocardial infarction in mice. International Heart Journal. 2013;54(3):176–180. doi: 10.1536/ihj.54.176. [DOI] [PubMed] [Google Scholar]
- 12.Hara K, Haranishi Y, Kataoka K, et al. Chlorogenic acid administered intrathecally alleviates mechanical and cold hyperalgesia in a rat neuropathic pain model. European Journal of Pharmacology. 2014;723:459–464. doi: 10.1016/j.ejphar.2013.10.046. [DOI] [PubMed] [Google Scholar]
- 13.Kim YS, Kim NH, Lee YM, Kim JS. Preventive effect of chlorogenic acid on lens opacity and cytotoxicity in human lens epithelial cells. Biological & Pharmaceutical Bulletin. 2011;34(6):925–928. doi: 10.1248/bpb.34.925. [DOI] [PubMed] [Google Scholar]
- 14.Farrell TL, Dew TP, Poquet L, Hanson P, Williamson G. Absorption and metabolism of chlorogenic acids in cultured gastric epithelial monolayers. Drug Metabolism and Disposition. 2011;39(12):2338–2346. doi: 10.1124/dmd.111.040147. [DOI] [PubMed] [Google Scholar]
- 15.Ye JX, Wei W, Quan LH, Liu CY, Chang Q, Liao YH. An LC-MS/MS method for the simultaneous determination of chlorogenic acid, forsythiaside A and baicalin in rat plasma and its application to pharmacokinetic study of Shuang-huang-lian in rats. Journal of Pharmaceutical and Biomedical Analysis. 2010;52(4):625–630. doi: 10.1016/j.jpba.2010.01.035. [DOI] [PubMed] [Google Scholar]
- 16.Li X, Yu J, Luo J, et al. Determination and pharmacokinetic study of chlorogenic acid in rat dosed with Yin-Huang granules by RP-HPLC. Biomedical Chromatography. 2006;20(2):206–210. doi: 10.1002/bmc.555. [DOI] [PubMed] [Google Scholar]
- 17.Li Q, Sun L, Jia Y, Wang Z, Shen Z, Bi K. Determination and pharmacokinetic study of syringin and chlorogenic acid in rat plasma after administration of Aidi lyophilizer. Biomedical Chromatography. 2006;20(12):1315–1320. doi: 10.1002/bmc.698. [DOI] [PubMed] [Google Scholar]
- 18.Yuan B, Qiao M, Xu H, Wang L, Li F. Determination of chlorogenic acid in rat plasma by high performance chromatography after peritoneal administration of compound Daqingye injection. Yakugaku Zasshi. 2006;126(9):811–814. doi: 10.1248/yakushi.126.811. [DOI] [PubMed] [Google Scholar]
- 19.Gao R, Lin Y, Liang G, Yu B, Gao Y. Comparative pharmacokinetic study of chlorogenic acid after oral administration of Lonicerae Japonicae Flos and Shuang -Huang- Lian in normal and febrile rats. Phytotherapy Research. 2014;28(1):144–147. doi: 10.1002/ptr.4958. [DOI] [PubMed] [Google Scholar]
- 20.Zhang F, Gong X, Xiao B, Zhang C, Wang Z. Pharmacokinetics and tissue distribution of a bioactive sesquiterpenoid from Polygonum jucundum following oral and intravenous administrations to rats. Journal of Pharmaceutical and Biomedical Analysis. 2013;83:135–140. doi: 10.1016/j.jpba.2013.04.033. [DOI] [PubMed] [Google Scholar]


