Abstract
Spider silk has exceptional mechanical and biocompatibility properties. The goal of this study was optimization of the mechanical properties of synthetic spider silk thin films made from synthetic forms of MaSp1 and MaSp2, which compose the dragline silk of Nephila clavipes. We increased the mechanical stress of MaSp1 and 2 films solubilized in both HFIP and water by adding glutaraldehyde and then stretching them in an alcohol based stretch bath. This resulted in stresses as high as 206 MPa and elongations up to 35%, which is 4× higher than the as-poured controls. Films were analyzed using NMR, XRD, and Raman, which showed that the secondary structure after solubilization and film formation in as-poured films is mainly a helical conformation. After the post-pour stretch in a methanol/water bath, the MaSp proteins in both the HFIP and water-based films formed aligned β-sheets similar to those in spider silk fibers.
Introduction
Spider silk fibers have remarkable properties that could allow it to function in a variety of applications including textiles, biomedical, and manufacturing applications.1−10 Of particular interest is dragline silk with both a high strength and elongation.1 The Brown Recluse produces a ribbon type silk with high mechanical properties; unfortunately, it cannot be used in large scale production.11 In recent years, producing spider silks synthetically has become a major point of emphasis because spiders cannot be farmed as they are both territorial and cannibalistic. Efforts to produce recombinant spider silk proteins (rSSP) have focused on the production of fibers,2−4,12,13 while comparably little effort has been expended investigating alternative forms such as films, hydrogels, lyogels, and adhesives.
Dragline silk is used as the lifeline for the spider and as structural support in the web and is one of the strongest natural fibers known to man.1 Dragline silk is made up of two different proteins: major ampullate silk protein 1 (MaSp1) and major ampullate silk protein 2 (MaSp2), each with a molecular mass of around 300 kDa.14,15 Native dragline silk is spun starting in the gland as a viscous water-based liquid crystal16,17 in a micelle-like structure18 in a liquid dope. β-Sheets are induced and aligned by the friction of the duct as it decreases in diameter.19 β-Sheets are also formed by the removal of water from the liquid crystal16 or micelle-like structure.18
Nuclear magnetic resonance (NMR),5,20−27 Raman spectroscopy,28,29 and X-ray diffraction (XRD)21,30−33 show that secondary structures in spider dragline silk are mainly β-turn, β-sheet, and helical structures. β-Sheets confer mechanical strength to the silk and do not allow water penetration.27 β-Sheets are mainly produced from the alanine-rich regions, (An) and (GA)n in the protein. Type IIA turns are made from the GPGXX (X is usually Y or Q) and GPGQQ repeat units, and glycine-II-helices are produced from the GGX regions.6 These glycine-rich peptide regions allow penetration of water and increase strain, which contributes to the overall toughness of the silk.34
Synthetic spider silk fibers have been spun using rSSp to mimic natural spider silk properties.2−4,12,13 It has been shown that, in order to produce a strong fiber, the larger the protein size the better the strength.4 The actual spinning process is also difficult to mimic, as current systems have a syringe and push the liquid dope out of small diameter (0.005″ to 0.01″ ID) PEEK tubing,12 rather than the native pulling action. The secondary structures in the fibers need to be induced and then aligned, done by using a combination of a coagulation bath, liquid baths, and stretching.2−4,12 The fibers then have to be woven or braided together to form a product.
Minimal research has been done on rSSp films. Recombinant spider silk film formulations have recently been found to be a promising biological material for their ability to attach and cause proliferation of fibroblast cells.7 It was also found that the protein can be both genetically modified and chemically functionalized with cell adhesive peptides.35 This allows for further applications in the medical industry. Silkworm and spider silk films have also been studied for their biomedical applications using fibroblasts, osteoblast-like cells, and skin cells,7−10,36,37 all showing as much attachment as traditionally used materials. The chemical stability of rSSp has also been shown to be controllable using alcohol treatments38,39 and amino acid composition.40,41 The mechanical properties of spider silk films have been reported, but no reports have improved on the initial properties.42,43 Of the studies done on silkworm silk films only one was done to improve or to tailor the mechanical properties, which can make it a candidate for a biological material and scaffolds for tissue engineering.44
An advantage of using films over fibers is that films do not need to be woven together after processing to make functional products, which dramatically reduces the cost of production. The production of a film can be as simple as formulating a dope and pouring it. Dopes can also be modified by a change in formulation to have increased cell attachment,35,45 drug release,42 and mechanical properties.42,43 Film applications include coatings for medical devices,46,47 skin grafts,10,44,48 drug delivery,42 and cellular scaffolds.7,9,49 Improving and understanding the mechanical properties of films will provide a base for further research that tailors films to specific applications.
rSSPs are conventionally dissolved in 1,1,1,3,3,3-hexafluoro-2-propanol (HFIP) to create “dopes” that can be used to create fibers, films, gels, and foams, as well as electrospun fibers and mats.50−53 HFIP has been widely used and accepted as a standard solvent because it dissolves rSSPs at high concentrations (30% w/v), it is removed rapidly from the forming silk fiber, and it does not interfere with fiber formation. In addition, rSSPs are generally insoluble in aqueous solutions after purification.
There are significant problems with solvating rSSPs in HFIP or other organic solvents at an industrial scale. HFIP is toxic to human health and to the environment and has a high likelihood of having a cytological effect due to residual HFIP.53 HFIP is also not cost-effective nor is it simple to work with due to the need of a controlled environment. To date, however, there is no working process to efficiently dissolve rSSPs in any other solvent that would be less toxic and costly. There have been investigators that have used other solvents to produce fibers,2,16,17 but these have diminished mechanical properties. The inability to solubilize rSSPs in aqueous solvents limits the applications of synthetic spider silk.
This study presents a novel way of processing rSSp films with solubility in HFIP and the introduction of an aqueous solvent to decrease environmental impact, cost of processing, and toxicity. Even with the change of solvent, the mechanical properties of the films can be as high as, and in some cases, surpass those from films produced from HFIP. Post-pour processing methods were utilized to improve secondary recruitment and orientation and, thus, properties.
The proteins in this study are rSSps produced in the milk of transgenic goats, derived from the N. clavipes major ampullate silk proteins MaSp1 and MaSp2, which combine to form the dragline fiber. The films are fabricated using a liquid dope, with primarily HFIP or water used as a solvent, cast into a mold to produce films 10–30 μm thick. The protein concentration and solvent composition are varied to increase mechanical properties. Films are postcasting processed using a combination of vapor treatments, liquid treatments, and stretching to increase stress, strain, and energy to break. To our knowledge this is the first reported rSSp film production method tailoring mechanical properties. Improving the mechanical properties of rSSP films will widen potential applications for such materials.
Materials and Methods
MaSp1 and MaSp2 Purification
Milk from transgenic goats is first collected and frozen, and then 6–8 L of milk is thawed and defatted using a Milky cream separator (FJ60 by Clair). The defatted milk is brought to a pH of 9 using 0.1 M arginine-HCl with the milk solution at 4 °C for 30 min while stirring. The solution is then clarified and concentrated using tangential flow filtration (TFF) with 750 kDa and 50 kDa membrane filters with the 750 kDa permeate flowing into the 50 kDa with the permeate flowing back into the 750 kDa.54 The retentate from each 750 and 50 kDa column are recycled through their respective columns. The rSSPs are precipitated from the 50 kDa column retentate. Solid ammonium sulfate is added slowly to a concentration of 1.2 M while stirring to precipitate the rSSP from the remaining milk proteins. The solution is allowed to precipitate overnight and centrifuged at 15970g for 60 min. The supernatant is removed and the pellet is washed multiple times using dH2O, followed by centrifugation at 15970g for 60 min until the conductivity of the supernatant is below 20 mS/cm. rSSP pellets are then lyophilized to remove all water and tested for purity via Western blot analysis using αM5 as a primary antibody and AP conjugated donkey antirabbit as a secondary antibody (Santa Cruz Biotechnology).
PDMS Mold
The mold for the water-based films is made from a polydimethylsiloxane PDMS (Dow Corning) solution of 5:1 base to initiator and poured it into a 90 mm Petri dish to approximately 1 mm thick. The Petri dish and solution is then placed into a vacuum chamber for 20 min to remove all bubbles. They are then placed in an oven at 70 °C to cross-link overnight. The solidified PDMS is removed and cut using a forceps and a razor blade to four 30 × 7 mm strips (Figure 1), with care taken to keep it clean of particulates. The mold is then thoroughly cleaned using soap and water, followed by isopropanol (IPA).
Figure 1.
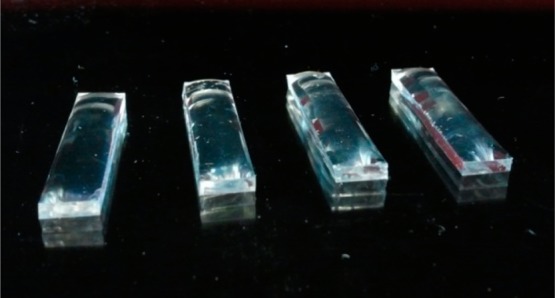
PDMS strips with poured spider silk dope over the top.
The mold to form the HFIP based films, due to spreading of the dope is made from a PDMS solution of 20:1 base to initiator and pouring it into a medium-sized Petri dish to 0.2 mm thick. The next steps are the same as for the water based film molds. The PDMS strips are placed in a new Petri dish side by side, avoiding touching, and a solution of 5:1 base to initiator PDMS solution is poured over the strips, with the solution at least 1 mm above the strip. The Petri dish with the PDMS is treated as above. The PDMS is removed from Petri dish and the 20:1 strips are carefully removed using forceps and a razor blade so as to not damage the 5:1 mold. The mold is then thoroughly cleaned using soap and water followed by isopropanol (IPA).
Dope Preparation
Water
Standard water-based films are made using dopes that contain 4% MaSp1, 2% MaSp2, and 3.5% 80/20 MaSp1/MaSp2 protein dissolved in water with additive. Additives were included in the dopes to improve solubility, antibiotics, and cross-linking. These additives include formic acid (FA; 0.1, 0.5, 1, 5, 10, 15, and 20%), acetic acid (10, 15, and 20%), arginine and glutamic acid (0.6, 12, 20, 30, 50, and 122 mM), urea (4, 8, 160 mM), ammonium hydroxide (50, 100, and 200 mM), kanamycin (50 μg/L), glutaraldehyde (GTA; 0.5 and 1 μL/mL), and imidazole (10 and 100 mM) using multiple concentrations. The dopes are microwaved, using a 700 W Magic Chef household microwave, for a period of 30 s on full power in a sealed 3 mL Wheaton glass vial to liquefy the dope and solubilize the protein. The dope is transferred into a microcentrifuge tube and spun at 18000g for 1 min, the supernatant is transferred to another microcentrifuge tube and the centrifugation repeated to remove any particulate matter. All films are then immediately poured and spread onto four 30 × 7 mm polydimethylsiloxane (PDMS) strips with 200 μL of dope on each strip.
HFIP
A standard dope contains 5% protein powder (w/v) dissolved in HFIP by overnight rotary agitation and centrifuged for 2 min at 18000g to remove any particulate matter remaining. The dope is carefully pipetted (200 μL) out of the vial and poured into a premade PDMS mold described above, in a chemical hood (Thermo Scientific Hamilton Concept) with the sash opened as far as possible to slow air flow over the films and decrease drying time.
Film Formation
After 1 day, the water-based films (2 h for HFIP-based films) are dry and starting to peel themselves off of the strips/wells. The films are removed using forceps and the edges cut with a razor blade, producing a uniform flat film.
Post-Pour Treatments
Vapor Treatment
HFIP-based films with 20% FA were first cut using a razor blade to 3.5 × 15 mm strips and weighed to determine thickness (eq 1). The cut films were then glued to a C-card (Supporting Information, Figure S1), as described below (Mechanical Testing). The films were vapor treated using isopropanol (IPA), water, and methanol (MeOH) at room temperature. Vapor treatment consists of putting the films into a small Petri dish, which is then nested into a larger Petri dish with 5 mL of the treatment solution in the bottom; the lid is placed on the larger Petri dish to contain vapors at room temperature. Cold treatment is simply putting the films into a closed Petri dish and putting them into a refrigerator. All treatments lasted for 30 min.
Stretching
To stretch the films a custom-made stretching device (Figure 2) was created using two, 3″ × 3″ × 1/4″ inch (B and C) and two 3 1/8″ × 3″ × 1/2″ (A and D) sheets of polycarbonate secured by two 1/2″ dowels 3/4″ from the bottom and 1/2″ from the both sides and a 1/4″ fiberglass dowel 1 3/4″ from the bottom and in the center. All dowels are glued to sheets A, C, and D. A 1/8″ all-thread rod is also placed through all sheets, except for the moving piece (B), which is threaded for piece B. A nut is also added flush with part D on both sides in order to make part D move. An extra nut is also placed at the extreme end at part E for ease of turning.
Figure 2.
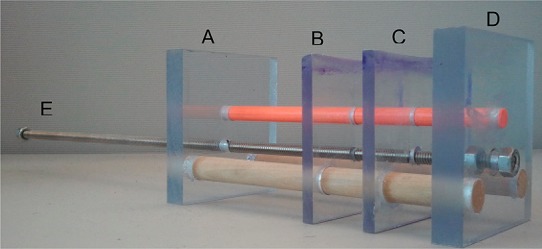
Diagram of the stretching apparatus used to glue as-poured films (across B and C), submerge the films in a stretch bath, and stretch the films by turning the all thread (E) clockwise.
Untreated films (dried for a 24 h) were first cut using a flat-edged razor blade on a cutting board along the edges to ensure consistent thickness. The films are then cut in half lengthwise and glued to the custom-made stretching apparatus described above (Figure 2). The stretching apparatus is inverted with the top of pieces B and C in a defined mixture of alcohol and water, with percentages measured by volume, for a period of 30 s (2 min for water-based films). The apparatus is then rotated right side up and the film strips immediately stretched by turning the all thread clockwise (part E in Figure 2). With an initial film length of 8.5 mm, the final length was determined by multiplying the initial length by the stretch ratio, for example, a 3× stretch has a final length of 25.5 mm.
Mechanical Testing
The films, poststretching, are cut to a specific length and width to weigh them and calculate the thickness (eq 1) using a density for dry spider silk fiber of 1.23 g/cm.3,55−57 The films are then mounted on a plastic C-card (Figure S1) lengthwise using Loctite super glue (liquid) across an 8 mm gap.58 After mounting, the C-card is loaded on an MTS Synergie 100 (50 N load cell) by clamping the top and bottom of the film and card into the instrument with alligator clips and then cutting the side of the C-card (indicated by the dotted line in Figure S1) so the only thing being tested is the film.13 The film is then tested to breaking at a stretch rate of 5 mm/min, with data collection at 30 Hz to measure the film’s load in order to calculate stress, strain, and energy to break using MTS’s TestWorks 4, 2001.
| 1 |
Nuclear Magnetic Resonance (NMR)
All 13C solid-state NMR data were collected on a 400 MHz Varian Wide-Bore instrument using a 1.6 mm solids triple resonance probe. Samples were packed into a 1.6 mm zirconia rotor and spun at the magic angle at 30 kHz MAS. 1H–13C cross-polarization conditions were calibrated using 13C-enriched glycine, and the CP condition was met by using a ramped (∼15%) 1H spin-lock pulse centered at 130 kHz RF field strength, and a square spin-lock pulse on the 13C channel matched to the −1 spinning side bands of the Hartmann–Hahn profile. All spectrum were collected using a 50 kHz spectral width, 8 ms acquisition time, 12288 scan averages, a 1 ms CP contact time, a 5 s relaxation time, and 150 kHz two-pulse-phase-modulated (TPPM) decoupling was applied on the 1H channel during acquisition. A 50 Hz exponential line broadening was applied to each spectra prior to Fourier transform. The 13C chemical shifts are referenced externally to TMS at 0 ppm by setting the downfield resonance of adamantane to 38.56 ppm.
Raman
The films were analyzed using a home-built Raman system. Films were placed bridging the space between two parallel glass slides to eliminate background and excited with a 150 mW 532 nm Coherent Sapphire SF laser focused onto the sample with a 50× magnification APO plan Mitutoyo 2.0 cm working-distance objective. The laser power was controlled using neutral density filters to make the power at the sample 28 mW, which optimized the balance between signal-to-noise and sample damage. The Raman signal was collected in back scattering geometry. The laser wavelength was discriminated from the Raman signal using an Ondax SureBlock(TM) ultra-narrow-band notch filter. An Acton Research SpectraPro 300i monochromator with a 1200 g/mm grating coupled to a PI liquid nitrogen cooled CCD detector was used to collect Raman signal for 5 acquisitions of 60 s each at a resolution of 1.5 cm–1. Cyclohexane and acetaminophen were used as calibrants.
X-ray Diffraction
Samples were taken to the Advanced Photon Source located at Argonne National Laboratory, Argonne IL, U.S.A., and wide-angle X-ray fiber diffraction was performed on the BioCars 14BM-C beamline using a beam energy of 12.6 keV and approximate size of 130 × 340 μm. Films were mounted and were placed at a distance of 300 mm from the ADSC Quantum-315 9-panel CCD array detector. Stretched films were placed with the stretched axis parallel to the beamstop and mounted to a goniometer. The exposure time was 60 s for each of ten images averaged for each sample. For each sample, 5 background images were taken following each sample with the same parameters and calibrated with CeO2. Images were then processed using Fit2D software and Matlab. The water-based MaSp2 films were contaminated while at the synchrotron source and made the X-ray diffraction data unusable.
Field Emission Scanning Electron Microscopy (FE-SEM)
The films were imaged by field emission scanning electron microscopy (FE-SEM Hitachi S-4000, Hitachi High-tech Corporation, Tokyo, Japan) to characterize their morphology. The films were mounted on an aluminum stub and coated with a gold layer 10 nm thick.
Film Functionalization
HFIP dopes were made by dissolving 50 mg of MaSp1 powder in 1 mL of HFIP and mixed overnight, 200 μL was poured into a PDMS mold (described in HFIP paper) and allowed to dry. The kanamycin containing film was made by transferring 300 μL to a new vial and adding 1 μL of kanamycin stock (15 mg/mL), mixed for a minute using rotary agitation, and then 200 μL was poured into a PDMS mold.
The water-based dope was made by microwaving 15 mg MaSp1 powder in 300 μL of water for 45 s and pouring 200 μL onto a PDMS strip as described above. The kanamycin film was made the same way with the exception that the rSSP solution was allowed to cool ot room temperature to prevent degradation of the kanamycin. A total of 1 μL kanamycin (15 mg/mL) was added to the dope for a final concentration of 50 μg/mL. The dope was mixed for a minute using rotary agitation before pouring 200 μL onto a separate PDMS strip.
Two days after pouring the films, a lawn of E. coli XL1-Blue cells was established on an LB agar plate and allowed to dry for 30 min in an incubator at 37 °C. Holes (6.5 mm) were punched out of the films and a disc from each film was placed on the plate. The plates were then placed in the incubator overnight to allow cell growth.
Statistical Analysis
All statistical analyses on tensile properties were done using a one-tailed t test assuming equal variance with a null hypothesis that the sample means are equal. A p-value of <0.05 is considered significant.
Results
Preliminary Experimentation for HFIP-Based Films
To create the films, a suitable substrate was investigated to create a mold for film formation. Glass, aluminum, Teflon, and PDMS were all tested as substrates for film formation and removal. The substrate that proved to be the best was PDMS due largely to its hydrophobicity. The films could be peeled off easily after drying, which reduced mechanical damage. PDMS also provides a smooth surface free of machine marks.
The next important step was to establish the best pouring and drying method. An important factor in the pouring method was dope composition. It was found that 5% protein dopes were easy to solubilize, pour, and provided a thickness of 20–30 μm. To optimize the drying method, atomic force microscopy (AFM) was used to analyze surface topography. In initial work during drying, pores were created throughout the film. The pores are thought to occur due to the HFIP evaporating so quickly that it leaves holes in the films as it bubbles out. Because of this, it was thought that a slower rate of evaporation would optimize film production. A variety of drying techniques were investigated (Table 1) in order to achieve this. Pore tomography was measured using atomic force microscopy (AFM) in tapping mode (Figure S2). The drying method that was chosen to use throughout this study is drying in a chemical hood with the sash opened as far as possible to slow the air movement. It was also assumed that because the problem of pore formation arises from HFIP evaporation, this method could be applied to all HFIP-based protein dopes.
Table 1. Comparison of Pore Sizes between Pouring Methods Measure by AFM.
| pouring methods | pore density (pores/μm) | pore width (nm) | pore depth (nm) |
|---|---|---|---|
| MaSp2 open sash | 3.53 ± 3.28 | 301.67 ± 7.85 | 4.65 ± 0.26 |
| MaSp2 refrigerated | 5.95 ± 0.91 | 548.95 ± 53.76 | 40.75 ± 22.73 |
| MaSp2 turbulent air | 0.35 ± 0.21 | 4866.67 ± 1102.52 | 123.25 ± 69.67 |
| MaSp2 vacuum chamber | 12.73 ± 1.06 | 481.33 ± 45.73 | 286.33 ± 24.14 |
After optimizing the film production process, preliminary testing of unprocessed films using MaSp1, MaSp2, varying ratios of MaSp1 and 2, and different dope solvent formulations including formic acid (FA) and glutaraldehyde (GTA; Table 2) was performed. Dopes with formic acid follow the procedure of a standard dope with the exception that formic acid, 88%, is added to the dope before centrifugation and dopes with GTA have the exception that after centrifugation the dope is removed carefully from the vial and put into another vial and GTA (1 μL/mL) is added by pipet and the vial gently rotated by hand before pouring.
Table 2. Preliminary Mechanical Testing Results with Average Deviations from Untreated MaSp1 and MaSp2 Films with Different Dope Formulations, Including No Additives, GTA, and 20% FA.
| protein solution | avg energy to break (MJ/m3) | avg ultimate stress (MPa) | avg ultimate strain (mm/mm) |
|---|---|---|---|
| MaSp1 | 2.04 ± 0.81 | 42.12 ± 8.52 | 0.068 ± 0.02 |
| MaSp1 w/GTA | 8.42 ± 9.67 | 32.97 ± 14 | 0.621 ± 0.77 |
| MaSp1 w/20% FA | 2.87 ± 1.09 | 50.4 ± 4.75 | 0.076 ± 0.03 |
| MaSp2 | 0.64 ± 0.28 | 29.52 ± 2.49 | 0.036 ± 0.01 |
| MaSp2 w/20% FA | 0.66 ± 0.35 | 44.6 ± 6.34 | 0.028 ± 0.01 |
| 20/80 MaSp1/MaSp2 w/20% FA | 1.3 ± 0.74 | 36.56 ± 11.09 | 0.051 ± 0.02 |
| 50/50 MaSp1/MaSp2 w/20% FA | 0.47 ± 0.42 | 34.28 ± 12.1 | 0.024 ± 0.01 |
| 80/20 MaSp1/MaSp2 w/20% FA | 3.73 ± 1.88 | 45.21 ± 12.65 | 0.13 ± 0.08 |
All untreated films mechanical properties were mechanically tested the same day they were poured. β-Sheet formation was measured on MaSp1 and MaSp2 films with GTA using XRD over a week after pouring, which showed little difference between the two (Figures 3A and S3). It is also evident through mechanical testing that formic acid increases stress with the highest being MaSp1 with formic acid. The addition of GTA increased strain, leading to a tripling of the energy to break for preprocessed films. MaSp1 films with formic acid were also tested after conducting a vapor treatment, which involved placing the films in a small Petri dish, which was placed in a larger Petri dish with the treatment liquid and the lid placed over the large Petri dish. The vapor treatment time is 30 min and the films were tested for mechanical properties the following day (Table S1). The IPA vapor treated films produced the highest average stress 79.6, but the lowest average strain 0.03, suggesting an increase in β-sheet content.
Figure 3.
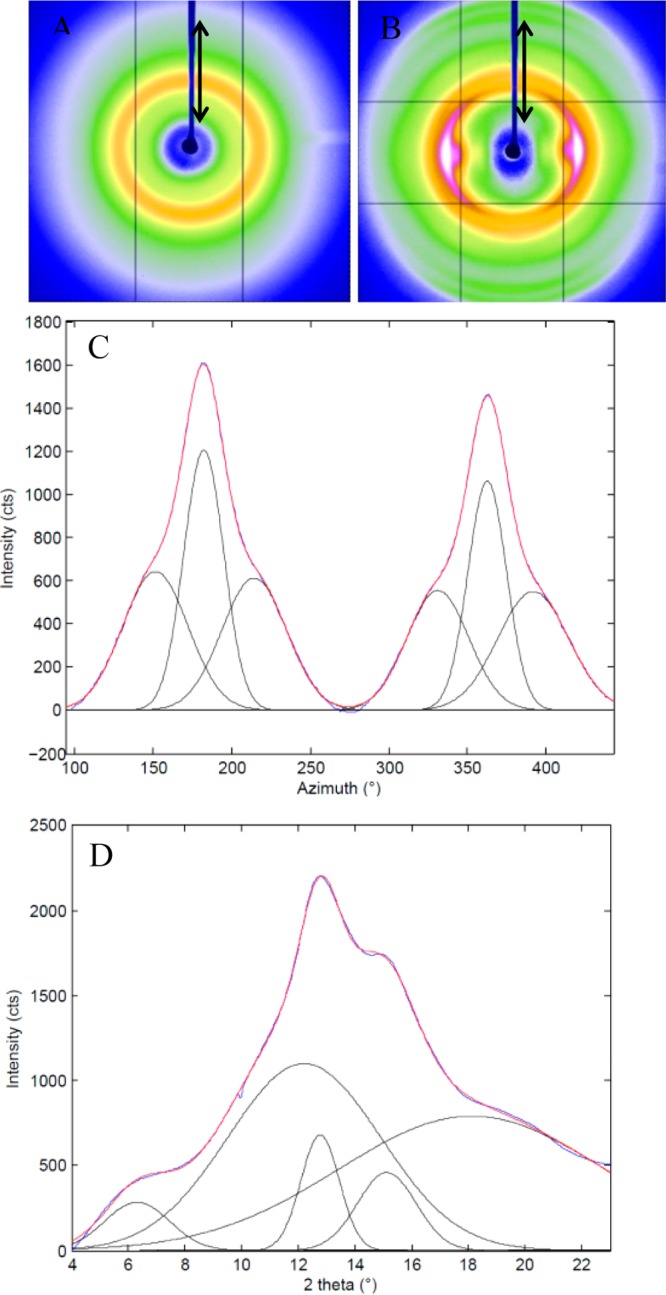
2D WAXD images of MaSp1 spider silk films as-poured (A) and post-pour stretched 2.5× its original length following an 80/20 methanol/water bath (B). The double arrow in (A) and (B) represents the direction of film stretch alignment, which is parallel to the beamstop shadow (blue). Shown in (C) is the 1D azimuthal intensity profile of radially integrated reflections at 4.2 Å–1 of (B) with Gaussian fits. Full 1D radial intensity azimuthally integrated profile of (D) with beamstop shadow and CCD detector lines masked and fit to five Gaussian components.
Preliminary Experimentation for Aqueous-Based Films
With the discovery of PDMS as a suitable pouring substrate and the need for a slow drying process, the development of aqueous film formation started with changing the PDMS molds to a PDMS strip to overcome surface tension issues due to the use of water. It was then necessary to establish a dope formulation.
The stability and processing of spider silk films depend on the composition of the dope. Dope preparation began by using recombinant MaSp1, water, and formic acid (0.1, 0.5, 1, 5, 10, 15, and 20%), acetic acid (10, 15, and 20%), arginine and glutamic acid (Arg Glu; 0.6, 12, 20, 30, 50, and 122 mM), urea (4, 8, 160 mM), ammonium hydroxide (50, 100, and 200 mM), or imidazole (10 and 100 mM). MaSp2 films were also made using formic acid (0.1, 2, 10, and 20%) and acetic acid (1, 5, 20%). All additives were placed into the dope prior to microwaving.
Preliminary tensile testing was done on the films as-poured (no processing). These films were screened for tensile strength, solubility, and processability. Solubility was tested by placing the films into 5 mL of DI water. Processability was determined by trying to stretch the films in different stretch baths, it was determined processable if the film stretched without breaking to a minimum of 1.5×. Films from dopes containing urea and ammonium hydroxide dissolved quickly in water (<30 s). Urea containing dope films also dissolved in a mixture of alcohol and water, preventing further processing of films (Table 3). The dope made with 0.1% formic acid proved to make films with a high tensile strength and processability than the other dopes.
Table 3. Comparison of Mechanical Properties and Solubility of Films Made from Different Dope Formulations Using MaSp1.
| additive | concentration | energy to break (MJ/m3) | stress (MPa) | strain (%) | film soluble in water |
|---|---|---|---|---|---|
| urea | 4 mM | 0.42 ± 0.12 | 50.26 ± 8.62 | 1.7 ± 0.3 | Y |
| 8 mM | 0.43 ± 0.05 | 50.70 ± 3.04 | 1.7 ± 0.1 | Y | |
| 160 mM | 0.44 ± 0.14 | 49.97 ± 7.74 | 1.6 ± 0.3 | Y | |
| arginine and glutamic acid | 0.6 mM | 0.64 ± 0.22 | 61.82 ± 13.06 | 2.0 ± 0.4 | N |
| 12 mM | 0.75 ± 0.25 | 58.31 ± 7.94 | 2.3 ± 0.6 | N | |
| 20 mM | 1.96 ± 3.13 | 50.32 ± 11.99 | 4.5 ± 5.3 | N | |
| 30 mM | 8.71 ± 8.74 | 22.67 ± 2.62 | 43. ± 39.7 | N | |
| 50 mM | 7.47 ± 6.67 | 15.64 ± 0.66 | 51.2 ± 45.3 | N | |
| 122 mM | 0.07 ± 0.02 | 3.24 ± 0.9 | 3.6 ± 0.5 | N | |
| ammonium hydroxide | 50 mM | 0.41 ± 0.12 | 52.55 ± 6.86 | 1.7 ± 0.3 | Y |
| 100 mM | 0.71 ± 0.24 | 62.83 ± 15.49 | 2.5 ± 0.6 | Y | |
| 200 mM | 0.68 ± 0.22 | 57.81 ± 11.98 | 2.4 ± 0.5 | Y | |
| formic acid | 0.10% | 0.61 ± 0.17 | 53.97 ± 4.73 | 2.5 ± 0.4 | N |
| 0.50% | 0.69 ± 0.19 | 58.15 ± 8.2 | 2.5 ± 0.2 | N | |
| 1% | 0.84 ± 0.22 | 69.35 ± 7.28 | 2.6 ± 0.4 | N | |
| 5% | 0.84 ± 0.4 | 65.24 ± 14.3 | 2.5 ± 0.7 | N | |
| 10% | 0.64 ± 0.12 | 60.76 ± 7.52 | 2.4 ± 0.3 | N | |
| 15% | 0.81 ± 0.04 | 71.36 ± 5.1 | 2.5 ± 0.2 | N | |
| 20% | 0.87 ± 0.2 | 66.56 ± 7.4 | 2.7 ± 0.4 | N | |
| acetic acid | 10% | 2.63 ± 1.18 | 50.56 ± 5.63 | 6.9 ± 3.0 | N |
| 15% | 0.94 ± 0.22 | 50.35 ± 9.17 | 3.4 ± 1.0 | N | |
| 20% | 24.28 ± 9.43 | 36.58 ± 2.24 | 82.6 ± 29.6 | N |
Tensile testing was done to understand variability between samples, structural integrity and extension of the films (Table 3). It was previously hypothesized that high extension (>0.100) and low stress (≤50 MPa) led to a film that could be easily postpour stretched as indicated by the results from the HFIP-based film. This hypothesis was disproved as dope formulations making as-poured films with a high degree of extensibility (20% acetic acid and 30 mM arginine and glutamic acid) could not be further processed. Dopes containing propionic acid (0.1 and 10%) and imidazole (10 and 100 mM) were also made. Preliminary mechanical testing was not done on these films as they also broke when force was applied in the stretch bath. Films with 0.1% formic acid permitted alcohol and water treatments, as well as stretching, both of which increased mechanical properties. Due to the ease of processability, the dope formulation containing 0.1% formic acid was used for the remainder of the experiments. Additionally, 0.5 μL/mL GTA was also used due to the positive results from HFIP-based films, showing that it increases both stress and strain. A similar problem was encountered when MaSp2 films were stretched using any variety of alcohol and water concentrations, breaking the films instead of actually stretching them. To solve this problem MaSp1 was mixed in with MaSp2 at different concentrations until the films were able to be processed, arriving at 80% MaSp1 and 20% MaSp2 based on weight.
Films that were made with 0.1% formic acid and 0.05% GTA were then characterized using XRD, showing that the MaSp2 films have more crystallinity than the MaSp 1 films (Figures 4 and S4). Since the pure MaSp2 films could not be postpour stretched, it is hypothesized that the high β-sheet content prevents the penetration of water. MaSp2 dopes also gelled faster than MaSp1 dopes after microwaving, due to the higher β-sheet content, making it difficult to remove particulates and pour.
Figure 4.
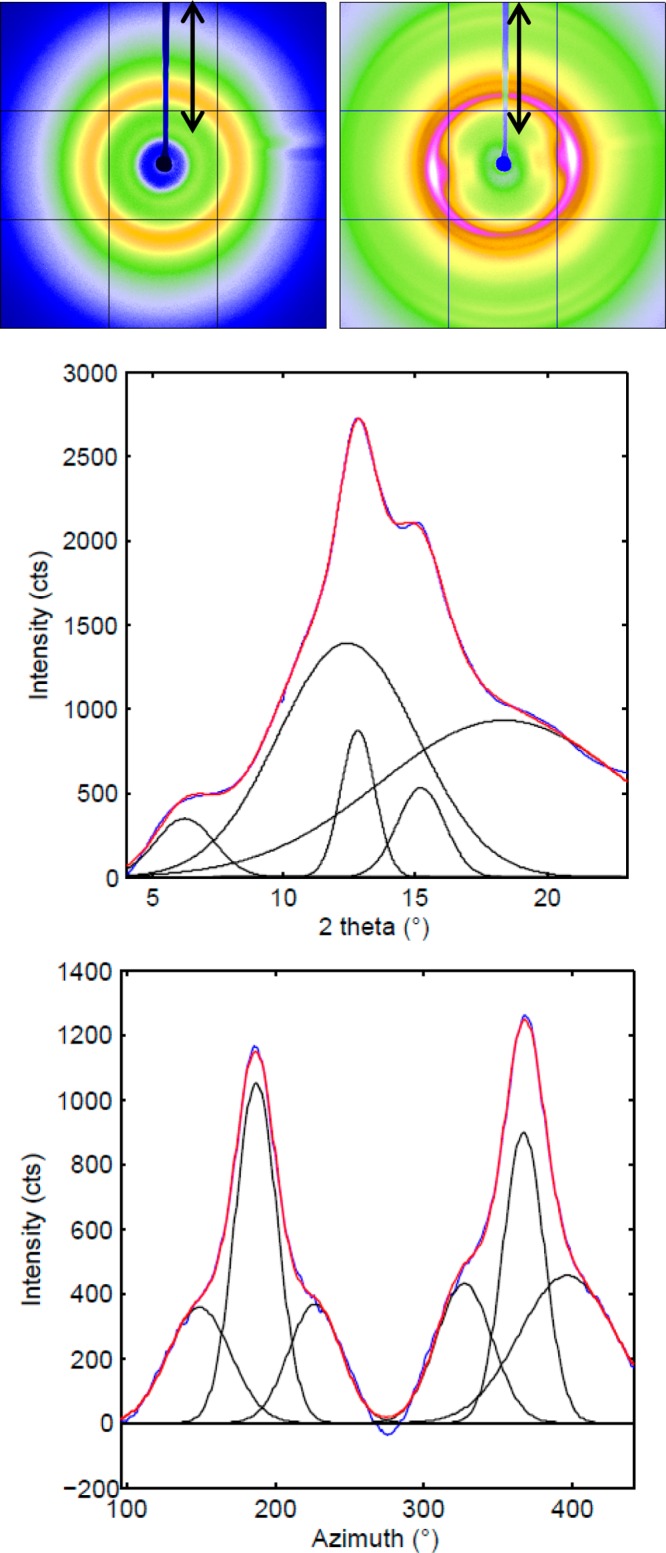
XRD images of as-poured spider silk films MaSp1 (A), post-pour stretched 2.5× its original length after an 80/20 methanol/water bath (B), 1D radial integration profile of the whole 2D pattern of B (C), and the 1D azimuthal intensity profile of B (D). The double arrow in A and B represents the direction of film stretch alignment which is parallel to the beamstop shadow (blue).
Stretching Films
Stretching spider silk fibers has been shown to increase both stress and strain2−4,12 by aligning secondary structure. In this study a similar technique is used to improve mechanical properties. Initially, the films were stretched by hand, but this method of stretching was both difficult and unreliable. A stretching apparatus custom-made in our laboratory (Figure 2) was created to establish an easy method to create a consistent, uniform stretch. This apparatus made it possible to obtain results that were reproducible and also made it possible to stretch multiple films simultaneously. It is important to note that with HFIP-based films, formic acid impaired the postpour stretching of the spider silk films after the stretch bath and therefore was not included in the dopes for stretched films. It is hypothesized that formic acid increases β-sheet content preventing sufficient penetration of water or alcohols.
Post-Pour Processing of HFIP-Based Films
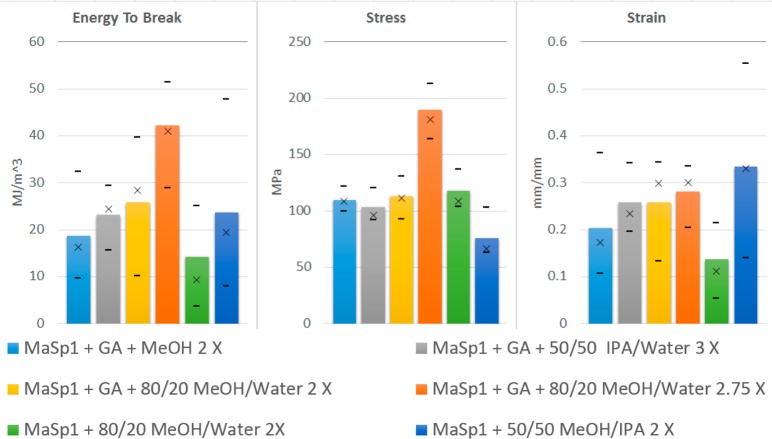
The best stretching results were established by using a 2–3× stretch and testing different ratios of IPA, methanol (MeOH), and water in the bath. The results of these experiments (Table 4 and Figure 5) show that the films stretched in the 80/20 MeOH/water bath performed the best with an average energy to break more than twice that of the other films.
Table 4. Mechanical Properties of Films with Average Deviations after Post-Pour Stretch Using Set Ratios of IPA, MeOH, and Water.
| dope composition + stretch solutions with stretch ratio | avg energy to break (MJ/m3) | avg ultimate stress (MPa) | avg ultimate strain (mm/mm) |
|---|---|---|---|
| MaSp1 with GTA + MeOH 2× | 18.65 ± 8.95 | 109.61 ± 8.69 | 0.204 ± 0.1 |
| MaSp1 with GTA + 50/50 IPA/water 3× | 23.14 ± 5.7 | 102.91 ± 12.44 | 0.258 ± 0.06 |
| MaSp1 with GTA + 80/20 MeOH/water 2× | 25.8 ± 9.61 | 112.69 ± 15.03 | 0.257 ± 0.08 |
| MaSp1 with GTA + 80/20 MeOH/water 2.75× | 42.1 ± 9.76 | 189.39 ± 17.25 | 0.281 ± 0.05 |
| MaSp1 + 50/50 MeOH/IPA 2× | 23.58 ± 12.31 | 75.59 ± 17.66 | 0.334 ± 0.12 |
| MaSp1 + 80/20 MeOH/water 2× | 14.19 ± 8.57 | 117.4 ± 14.08 | 0.137 ± 0.06 |
Figure 5.
Bar graphs for stretched films showing average stress, strain, and energy to break with × being the median and the dashes representing minimum and maximum.
To examine the stretch factor on films, the 80/20 MeOH/water solution was used to determine mechanical changes in a range of stretching ratios (Figure 6). As the stretch factor increased, stress increased up to a maximum of 210 MPa, while strain decreased by at least 25% with each incremental step. With an increased stretch factor the stress–strain graph changes, the yield strength increases, and the slope following that point increases. The films with 2.5× stretch show a yield behavior with slight strain hardening, and the films with 2.75 and 3.25× stretch factor show strain hardening and no yielding directly after the initial jump in stress. This shows that the films can be tailored to different applications, with only a change in stretch factor.
Figure 6.
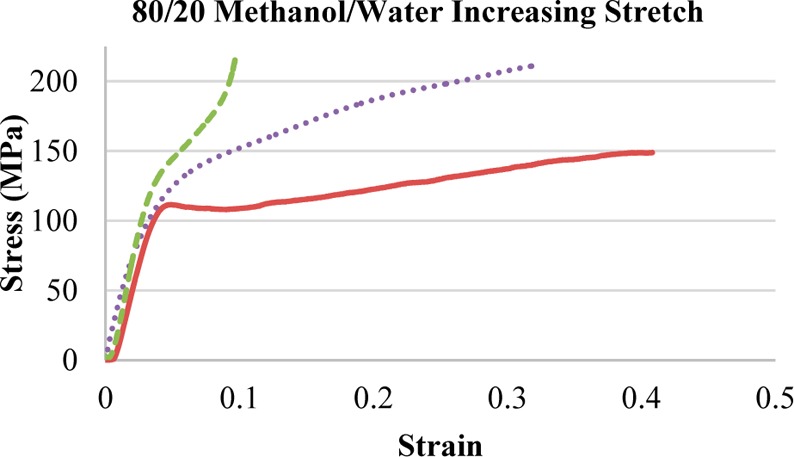
Select stress–strain graphs of MaSp1 samples with GTA films to illustrate the difference in stress and strain with a given stretch factor using 80/20 MeOH/Water as a stretch bath. With the following legend: 2.5× stretch (solid line), 2.75× stretch (dotted line), and 3.25× stretch (dashed line).
Previous research on mechanical properties of gelatin films has revealed that GTA can increase cross-linking of protein, which increases mechanical properties, primarily stress.59,60 Preliminary testing showed that the spider silk films with GTA had higher strain but lower stress (Table 2). After this discovery, GTA was used in the dope for all postpour stretched films. This produced an increase in both stress and strain and also increased consistency (Table 4). Testing showed that the GTA only helps after the films dry for a full day prior to postpour treatment.
After establishing processing procedures, MaSp2 dopes were also made, as well as MaSp2/MaSp1 combination dopes. The resulting films were processed using 80/20 MeOH/Water and 2.5× stretch with GTA in the dope (Figure 7). There was no significant difference in stress or strain between the films that contained mixed proteins, with an average ultimate stress at 139 MPa and ultimate strain at 29.7%. The MaSp1 protein films had the highest stress (182 MPa) and the MaSp2 protein films the highest strain (33%).
Figure 7.
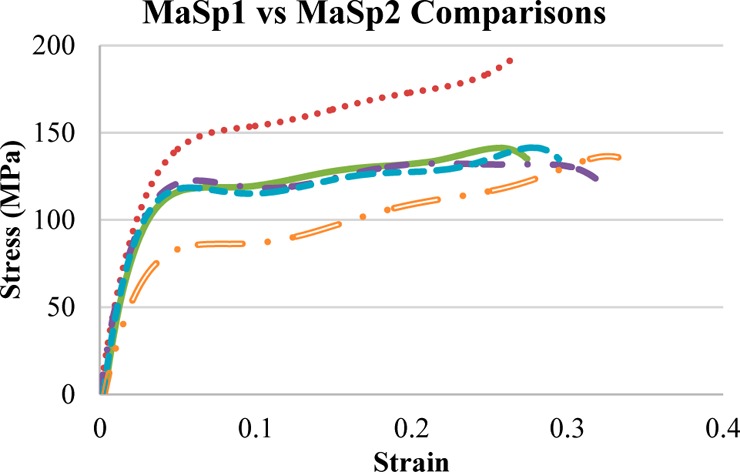
Stress–strain graphs comparing films composed of MaSp1, MaSp2, or a mixture of MaSp1/MaSp2; all samples received the same post-pour treatment, with the following legend: MaSp1 (dashed line), 75/25 MaSp1/MaSp2 (solid line), 50/50 MaSp1/MaSp2 (single dotted dashed line), 25/75 MaSp1/MaSp2 (dashed line), and MaSp2 (double dotted dashed line).
Post-Pour Processing of Aqueous-Based Films
With established procedures for post-pour stretching of HFIP-based films, the water-based films were then stretched to increase mechanical properties. The primary difference in making the change to water-based films was that they needed to soak in the stretch bath for 2 min instead of 30 s for the HFIP-based films.
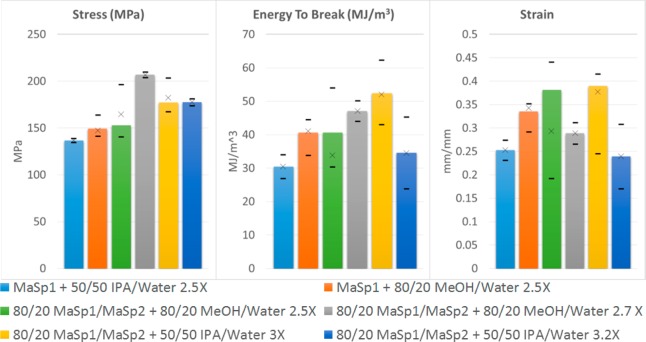
Following the preliminary testing of the dope compositions, films (both MaSp1 and 80/20 MaSp1/MaSp2) with 0.1% formic acid and 0.05% GTA were stretched in a combination of water and alcohol, resulting in the highest energy to break (62 MJ/m3) for recombinant silk protein films (Table 5 and Figure 8). The results of mechanical testing also demonstrate that 80/20 (w/w) MaSp1/MaSp2 films treated in 80/20 (v/v) MeOH/water yield the highest stress with a lower stretch ratio. Using this treatment, films cannot be stretched past 2.7× without breaking. Treating 80/20 (w/w) MaSp1/MaSp2 films in 50/50 (v/v) IPA/water increases the energy to break with a 39% strain and moderate (177 MPa) stress. With a higher stretch ratio and using the described treatment, films can be post-pour stretched up to 3.2× their original length, although stretching past 3× results in reduced strain.
Table 5. Mechanical Properties of Films with Average Deviations after Post-Pour Stretch Using Set Ratios of IPA, MeOH, and Water.
| material + stretch solutions with stretch ratio | avg energy to break (MJ/m3) | avg ultimate stress (MPa) | avg ultimate strain (mm/mm) |
|---|---|---|---|
| MaSp1 + 50/50 IPA/water 2.5× | 30.44 ± 3.55 | 136.66 ± 2.06 | 0.253 ± 0.02 |
| MaSp1 + 80/20 MeOH/water 2.5× | 40.6 ± 3.34 | 149.42 ± 7.27 | 0.335 ± 0.02 |
| 80/20 MaSp1/MaSp2 + 80/20 MeOH/water 2.5× | 40.58 ± 10.9 | 168.35 ± 20.76 | 0.307 ± 0.1 |
| 80/20 MaSp1/MaSp2 + 80/20 MeOH/water 2.7× | 47.06 ± 3.08 | 206.81 ± 3 | 0.289 ± 0.02 |
| 80/20 MaSp1/MaSp2 + 50/50 IPA/water 3× | 52.36 ± 8.02 | 183.92 ± 14.85 | 0.354 ± 0.07 |
| 80/20 MaSp1/MaSp2 + 50/50 IPA/water 3.2× | 34.58 ± 10.7 | 177.56 ± 3.57 | 0.239 ± 0.07 |
Figure 8.
Histogram of the mechanical properties for stretched films showing average stress, strain, and energy to break where bar height represents the average value, and × the median with dashes representing maximum and minimum values.
The surface of the MaSp1 films were imaged using a scanning electron microscope (SEM), showing that the film after stretching remains smooth (Figure 9). It also shows that the cut edge of the film may be porous or damaged due to cutting. This is not a desirable feature, but the films need to be cut to remove the thick edges. Using these SEM images we also verified that the thickness measurements are accurate and reliable (Figure 9).
Figure 9.

SEM image of the surface (A) and cut edge (B) of stretched MaSp1 films after 80/20 MeOH/water 2.5× stretch. Arrow indicates stretch direction. Scale bars: (A) 30 μm, (B) 12 μm.
Characterization of HFIP-Based Films
MaSp1 and MaSp2 films processed using 80/20 MeOH/water stretch bath, and stretched to 2.5×, were also characterized using XRD, the images show an increase in β-sheet content and alignment (Figures 3B and S3B) from the films that were not stretched (Figures 3A and S3A). Wide-angle X-ray diffraction of the films yields nanocrystalline Bragg reflections and an amorphous halo. The XRD pattern shows that the crystalline structure within the stretched films is also aligned parallel to the stretch direction, with calculated Herman’s orientation factors, fc, of 0.858 for MaSp1 and 0.838 for MaSp2, determined from azimuthal broadening of the equatorial reflections where fc is calculated (eq 2) from the angle, φ, between the longest axis and the fiber axis.
| 2 |
Radial integration along the equator gives the peak positions and widths of the (200) and (120) reflections which are used to calculate the a and b axes of the unit cell and nanocrystal dimensions. Along the meridian, the (002) reflection gives the information concerning of the c-axis of the unit cell. Spider silk proteins have been shown to form orthorhombic unit cells and the unit cell dimensions calculated from the peak positions of wide-angle X-ray diffraction WAXD reflections are calculated from eq 3, where d is the peak position in d spacing and hkl are the Miller index notation:61
| 3 |
Radial integration along the equator (Figure 3C) and meridian were fit to Gaussian peaks and the peak positions were converted to inverse space following Bragg’s Law to calculate unit cell dimensions. Average crystallite size in each dimension is calculated from the radial broadening in 2θ space using Scherrer’s formula and these results are shown in Table 6.62
Table 6. Unit Cell and Crystallite Dimensions Calculated from WAXD.
| material | unit cell (Å) | crystallite (nm) |
|---|---|---|
| MaSp1 post-stretch film | 6.90 × 9.73 × 10.50 | 0.80 × 3.18 × 9.99 |
| MaSp2 post-stretch film | 6.75 × 9.87 × 10.03 | 0.74 × 3.11 × 24.7 |
The crystallinity, xc, can be estimated by radial integration of the equatorial reflections (eq 4), which are the crystalline peaks due to Bragg diffraction relative to the full integrated peak area, yielding 47.3 and 48.2% crystallinity for MaSp1 and MaSp2, respectively.63
| 4 |
13C solid-state NMR data collected on MaSp1 and MaSp2 films are presented in Figure 10, and the information is used to track molecular-level structural changes during the course of film production. Chemical shifts for relevant amino acids alanine, glycine, serine, proline, and glutamine are indicated with dotted lines, and red arrows are used to emphasize changes to silk secondary structure during film production. For both MaSp1 and MaSp2 samples, the film progress is tracked from top to bottom; purified protein powder (Figure 10A,D) is solubilized in HFIP and casted as a film in PDMS wells (Figure 10B,E). As-poured films were then stretched 2.5× in a bath of 80/20 MeOH/water (Figure 10C,F). In both cases, initially, the alanine-rich regions within the purified MaSp1 or MaSp2 protein powders exist primarily in a beta-sheet conformation. This is expected; the purified protein is not water-soluble, presumably because of the polyalanine β-sheet aggregates. HFIP is commonly used to solubilize large silk-like proteins because of its ability to disrupt insoluble β-sheets and stabilize α-helical secondary structures.64,65 Our NMR data indeed shows a dramatic transformation of polyalanine regions into an α-helical conformation for films cast from HFIP silk dopes. This is evident in the characteristic downfield and upfield shifts of Ala Cα and Ala Cβ resonances, respectively, as illustrated by the outward pointing red arrows. While the majority of volatile HFIP solvent is removed via evaporation, the 13C resonance near 70 ppm is attributed to residual HFIP that remains bound to the silk protein backbone. NMR data shows a transformation of polyalanine regions from helical back to β-sheet structures when as-poured films are stretched in 80/20 MeOH/water; again, this is highlighted by inward-pointing red arrows. In the case of the MaSp2 sample where serine, which is often contiguous to the polyalanine regions, is well represented, we notice a similar trend. HFIP solubilization encourages a helical structure, but a significant fraction of serine residues are driven into a β-sheet conformation upon stretching. This structural transformation is also correlated with the loss of the HFIP resonance near 70 ppm, indicating that the helical-stabilizing organic solvent is driven away from the silk protein during the stretching procedure. NMR data therefore strongly suggests that alanine-rich repeat motifs from both MaSp1 and MaSp2 films form β-sheet nanocrystalline structures. This is in line with WAXD results that indicate both β-sheet formation and axial alignment upon stretching the films in alcohol/water baths.
Figure 10.
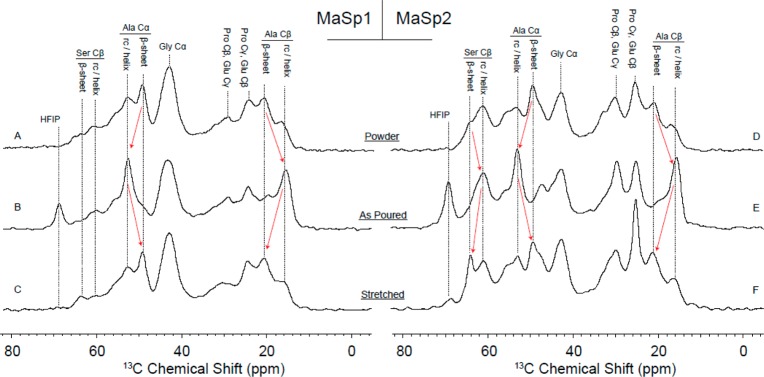
1H–13C CP-MAS spectra of MaSp1 films (left) and MaSp2 films (right) in various stages of production. Some resonances from dominant amino acids glycine, alanine, serine, proline, and glutamine are highlighted with dotted lines, and protein secondary structure is indicated when appropriate. Red arrows are used to emphasize structural changes occurring during production. From top to bottom: Purified protein powder (A, D), as-poured films from solubilized protein in HFIP (B, E), and films stretched in 80/20 MeOH/water (C, F).
Multidimensional NMR would be necessary to extract precise chemical shifts for proline and glutamine residues, thus, a complete characterization of GPGXX motifs in MaSp2 films is not possible. However, the collective chemical shifts of Pro Cγ/Glu Cβ and Pro Cβ/Glu Cγ at 25 and 30 ppm, respectively, are very consistent with natural dragline spider silk samples. NMR experiments on the MaSp2-rich Argiope aurantia spider dragline silk found that GPGXX motifs from MaSp2 protein exist in elastin-like type II β-turn structures.24 It is therefore likely that MaSp2 films share this structure. The resonance at 25 ppm from GPGXX regions also shows a narrowed line shape in stretched MaSp2 films as compared to the protein powder and the as-poured film. This observation suggests that stretched films contain a more uniform distribution of chemical shift and therefore less heterogeneity in the distribution of molecular environments. This is consistent with XRD data that show an increase in molecular orientation upon stretching. It is concluded that the act of film stretching in alcohol/water baths not only drives out HFIP and induces beta-sheet formation of alanine-rich regions, but also improves alignment and regularity of both beta-sheet nanocrystals and elastin-like GPGXX structures.
Raman spectroscopy characterization was also done on the spider silk powder, untreated films and postpour stretched films (Figure 11). This illustrates the secondary structure changes taking place as the MaSp1 and MaSp2 films are being processed. The powder consists primarily of beta-sheet and little helical conformation (Figure 11A,D). After solubilizing and pouring, the film switches to a helical conformation with little beta-sheet content (Figure 11B,E). After the stretch bath and subsequent stretching, the film reverts back to a β-sheet conformation, bringing it full circle (Figure 11C,F). This increased β-sheet content, along with the alignment that occurs with stretching, increases the energy to break over 20 times from the unprocessed films. Previous studies have shown β-sheet contributions at 1670 cm–1 and helical peaks at 1656 cm–1 and assigned unordered peaks near 1640 cm–1. Figure 11B and E both appear to show an increased peak amplitude near 1656 cm–1, which further confirms the conversion of β-sheet secondary structure to helical and back.28
Figure 11.
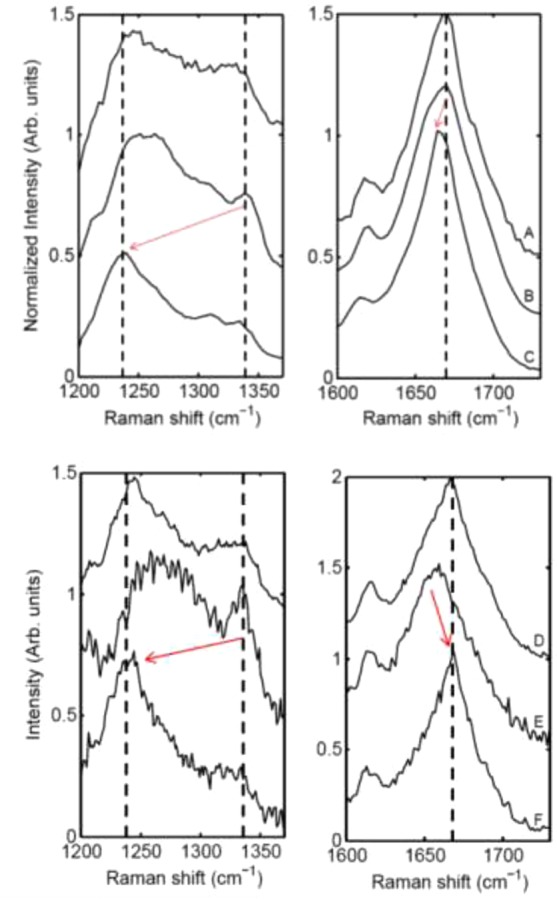
Raman spectra of the progression of MaSp1 films (top) and MaSp2 films (bottom) in the amide III and amide I regions. Red arrows are used to emphasize structural changes occurring during production. From top to bottom: Purified protein powder (A, D), as-poured films from solubilized protein in HFIP (B, E), and films stretched in 80/20 MeOH/water (C, F).
Characterization of Aqueous-Based Films
Wide-angle X-ray diffraction of the films yields nanocrystalline Bragg reflections and an amorphous halo. The XRD pattern shows that the crystalline structure within the stretched films is also aligned parallel to the stretch direction, with a calculated Herman’s orientation factor, fc, of 0.823 for MaSp1, determined from azimuthal broadening of the equatorial reflections where fc is calculated (as previously explained) from the angle, φ, between the longest axis and the fiber axis (Figure 4).
The a and b axes of the unit cell and nanocrystal dimensions were calculated, as described previously. Radial integration along the equator (Figure 4C) and meridian were fit to Gaussian peaks and the peak positions were converted to inverse space following Bragg’s Law to calculate unit cell dimensions. Average crystallite size in each dimension is calculated, as outlined previously, results are shown in Table 7(62)
Table 7. Unit Cell and Crystallite Dimensions Calculated from WAXD.
| material | unit cell (Å) | crystallite (nm) |
|---|---|---|
| MaSp1 post-stretch film | 6.92 × 8.86 × 11.37 | 1.93 × 3.34 × 7.86 |
The crystallinity, xc, can be estimated by radial integration of the equatorial reflections which are the crystalline peaks due to Bragg diffraction relative to the full integrated peak area as shown previously, yielding 48.8% crystallinity for MaSp1.63
The molecular protein structure of the films also was tracked through successive stages of film production using 1H–13C CP-magic angle spinning (MAS) NMR (Figure 12). 13C chemical shifts are very sensitive to protein secondary structure and can, therefore, be utilized to monitor structural changes throughout film production. Chemical shifts that arise from alanine Cα and Cβ in either a β-sheet or helical/random coil conformation are indicated with dotted lines in Figure 12. The films are essentially produced from powder to final product; initial MaSp1 protein powder (Figure 12A) is solubilized into an aqueous-based silk dope, which is cast as an as-poured film (Figure 12B). The poured films are then submerged in a bath of 80/20 MeOH/water and stretched 2.5× (Figure 12C). The data shows that the purified MaSp1 protein powder (Figure 12A) is dominated by alanine in a β-sheet conformation. When the silk protein is solubilized and cast into films, the data reveals that alanine originally in a β-sheet conformation is partially converted to helical or random-coil structures. Similar to HFIP solubilization, it appears that dissolution of silk protein in an aqueous medium is correlated with a decrease in alanine adopting a β-sheet structure (Figure 12B). However, the more stable β-sheet structure is recovered when the as-poured films are stretched in 80/20 MeOH/water (12C). These results are consistent with trends observed for HFIP-based films with the exception that there is no HFIP peak in aqueous films. This would lead us to believe that we are essentially creating the same films using a water-based dope versus HFIP, lowering the cost of materials, improving biocompatibility and improving the environmentally friendly aspect of this biomaterial.
Figure 12.
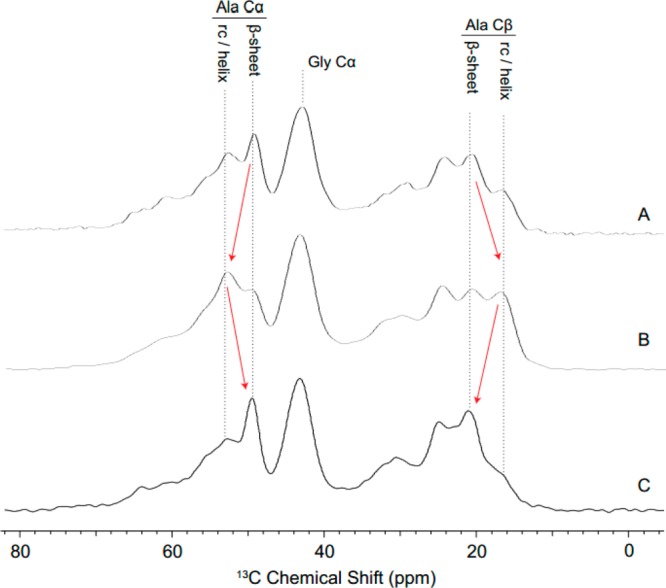
1H–13C CP-MAS spectra of MaSp1 films in various stages of production. Resonances for alanine and glycine residues are highlighted with dotted lines, and protein secondary structure is indicated when appropriate. The data suggests that the MaSp1 starting material (A) originally contains a significant β-sheet component. The protein is then solubilized in an aqueous-based silk dope, where the β-sheet fraction is expected to have decreased during solubilization. Films poured from this dope indeed show a decrease in β-sheet content (B). β-Sheet content is clearly recovered upon stretching of the as-poured films in 80/20 MeOH/H2O (C).
Raman spectroscopy characterization was also done on the spider silk powder, untreated films and post stretch films (Figure 13). These results confirm the previous findings of NMR that the powder consists primarily of beta-sheet and little helical conformation, after solubilization and pouring, the film converts to a helical conformation with little beta-sheet content, and after stretch bath and subsequent stretching the film reverts back to beta-sheet content. These results are also similar to those found previously.
Figure 13.
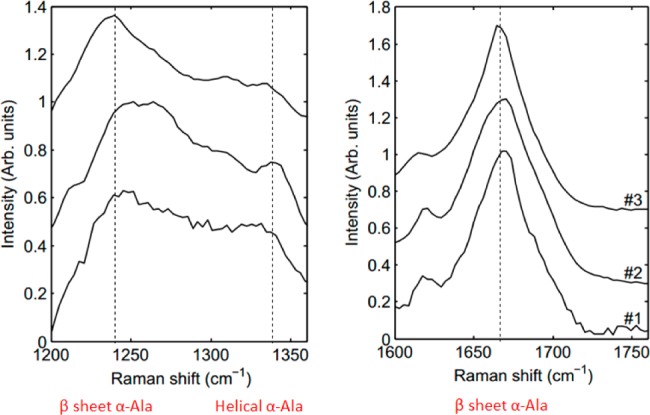
Raman spectra of the progression of MaSp1 films in the amide III (left) and amide I (right) regions. From top to bottom: Purified protein powder (1), as-poured films from solubilized protein (2), and films stretched in 80/20 MeOH/water (3).
Functionalization of Films
As proof of concept, to show the potential for these spider silk films in medical applications, two water-based films and two HFIP films were produced, the first of the two contain kanamycin in the dope and the second contain no additives. The films were placed on an agar plate that had been seeded with XL-1 Blue cells (Figure 14). Both HFIP and water-based films containing kanamycin generated a zone of inhibition on the bacterial lawn. Water-based films without kanamycin produced no zone of inhibition; however the HFIP-based film without kanamycin produced a narrow zone of inhibition, demonstrating that there is a cytological effect (residual HFIP; Figure 14) preventing growth of cells.66
Figure 14.
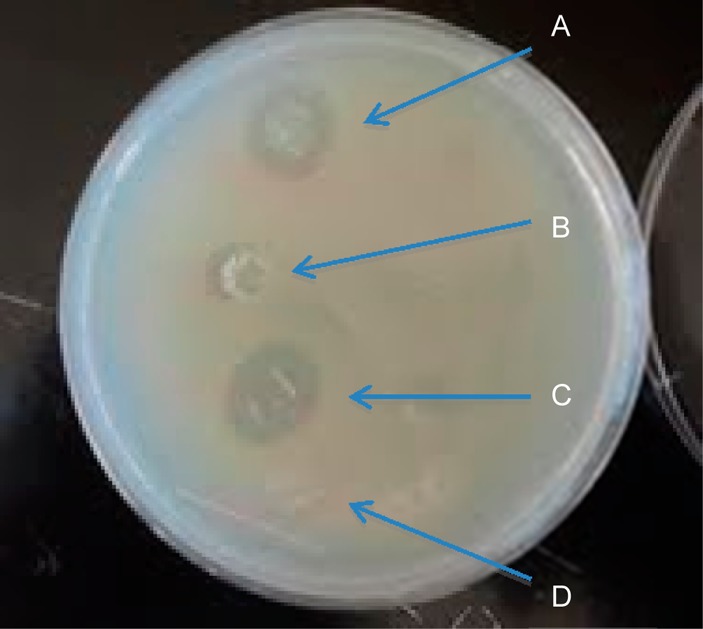
Zone of inhibition of films with and without kanamycin. HFIP-based film with kanamycin (A), HFIP-based film (B), water-based film with kanamycin (C), and water-based film (D).
Discussion
These results show that rSSp films can be formed after dissolving them in a water or HFIP solution. The mechanical properties of as-poured films from both are similar, with the addition of formic acid increasing stress. It is clear that postpour processing of films greatly increases the mechanical properties; these mechanical properties can be tuned to each application using a combination of dope formulation, stretch baths, and stretch ratios. The addition of GTA to the dope before pouring also increases strain in films processed in 80/20 MeOH/Water without a significant change in secondary structure suggesting that GTA may induce cross-linking between proteins. Changing the processing conditions, such as stretch baths and stretch ratios, changes the conformation of the silk protein, making the secondary structure tunable for commercial applications. The rSSp powder is initially in a β-sheet conformation, after dissolving in HFIP or water and pouring the protein takes a mainly random α-helical conformation, after post-pour stretching the protein reverts to a β-sheet rich conformation aligned in the stretch direction which has been confirmed by a combination of WAXD, Raman, and NMR.
The results of these experiments also are the highest published stress and strain of any recombinant spider or silkworm silk films (Table 8), making it a strong candidate for use in a variety of products. Spider silk is a biocompatible68 and biodegradable42 material suitable for use in multifunctional biomaterials. The comparison of MaSp1 and 2 films also shows that with despite similar alignment and processing, the MaSp2 films do not perform as well as MaSp1 films.
Table 8. Comparison of the Mechanical Properties of Silk, Collagen, and Other Materials44.
| material | form | ultimate stress (MPA) | ultimate strain (%) | refs |
|---|---|---|---|---|
| spider silk (dragline) | fiber | 4000 | 35 | (1) |
| HFIP-based recombinant spider silk | film | 189 | 28 | this study |
| water-based recombinant spider silk | film | 206 | 29 | this study |
| other recombinant spider silk | film | 54 | 1.8 | (42) |
| B. mori silk fibroin | ultrathin films | 100 | 0.5–3.0 | (44) |
| collagen X-linked | film | 47–72 | 12–16 | (60) |
| polylactic acid (PLA) | sheet | 28–50 | 2–6 | (44,67) |
| PMMA | plate | 55–76 | 2–5 | (67) |
The use of water instead of HFIP in the dope construct for film formation has the potential to change the processing of spider silk products due to its low cost of production and significant lowering of toxicity to the environment and people. We have been able to produce a water-based film that is similar in structure and mechanical abilities to HFIP based films, which makes the water-based films even more valuable.
Thus, aqueous-derived rSSP films reduce the cost of production, the toxic impact on the environment and improves biocompatibility over similar HFIP derived films. Due to the aqueous nature of the dopes, further functionalization may be more possible with aqueous films than with HFIP or other organic solvent-derived rSSP materials. HFIP solvates rSSP by converting the tight β-sheet structures to helical or random coil structures, negating the possibility of functionalizing the rSSP with protein therapeutics, as they could also be denatured.
Conclusion
It has been shown that films produced from an aqueous dope have similar structure to those created by an HFIP dope, producing essentially the same film with a lower cost and impact on the environment. Maximum stress values of over 200 MPa were observed in processed films with a maximum energy to break over 60 MJ/m3, and maximum strain over 40%. These values are the highest mechanical properties reported on materials used as a scaffold for cell growth (Table 8), with a stress at least double that of all others. As well, films generated from rSSP solvated in water matched or out performed those same proteins when solvated with HFIP.
Acknowledgments
The authors in Dr. Lewis spider silk lab would like to acknowledge USTAR, DOE (DE-SC0004791), NSF (IIP-1318194) for their support of the work done in the lab. The authors in Dr. Yarger’s lab would also like to acknowledge support from AFOSR (FA9550-14-1-0014) and NSF (DMR-1264801). Use of the Advanced Photon Source was supported by the U.S. DOE, BES, Office of Science, under Contract No. DE-AC02-06CH11357. Use of the BioCARS Sector 14 was also supported by grants from the NCRR (5P41RR007707) and the NIGMS (8P41GM103543) from the NIH. The authors would also like to thank Dr. David Britt for the use of his AFM and Dr. Michael Hinman and Richard Decker for their professional editing.
Supporting Information Available
AFM images of MaSp2 films comparing drying methods, mechanical properties of vapor-treated films, and XRD images of as-poured (water and HFIP-based) and stretched MaSp2 films (only HFIP-based). This material is available free of charge via the Internet at http://pubs.acs.org.
The authors declare no competing financial interest.
Funding Statement
National Institutes of Health, United States
Supplementary Material
References
- Lewis R. V. Chem. Rev. 2006, 106, 3762–3774. [DOI] [PubMed] [Google Scholar]
- Teulé F.; Addison B.; Cooper A. R.; Ayon J.; Henning R. W.; Benmore C. J.; Holland G. P.; Yarger J. L.; Lewis R. V. Biopolymers 2012, 97, 418–431. [DOI] [PMC free article] [PubMed] [Google Scholar]
- An B.; Jenkins J. E.; Sampath S.; Holland G. P.; Hinman M.; Yarger J. L.; Lewis R. Biomacromolecules 2012, 13, 3938–3948. [DOI] [PMC free article] [PubMed] [Google Scholar]
- Xia X.-X.; Qian Z.-G.; Ki C. S.; Park Y. H.; Kaplan D. L.; Lee S. Y. Proc. Natl. Acad. Sci. U.S.A. 2010, 107, 14059–14063. [DOI] [PMC free article] [PubMed] [Google Scholar]
- Holland G. P.; Creager M. S.; Jenkins J. E.; Lewis R. V.; Yarger J. L. J. Am. Chem. Soc. 2008, 130, 9871–9877. [DOI] [PubMed] [Google Scholar]
- Hayashi C. Y.; Shipley N. H.; Lewis R. V. Int. J. Biol. Macromol. 1999, 24, 271–275. [DOI] [PubMed] [Google Scholar]
- Minoura N.; Aiba S.-I.; Gotoh Y.; Tsukada M.; Imai Y. J. Biomed. Mater. Res. 1995, 29, 1215–1221. [DOI] [PubMed] [Google Scholar]
- Morgan A. W.; Roskov K. E.; Lin-Gibson S.; Kaplan D. L.; Becker M. L.; Simon C. G. Jr. Biomaterials 2008, 29, 2556–2563. [DOI] [PubMed] [Google Scholar]
- Sofia S.; McCarthy M. B.; Gronowicz G.; Kaplan D. L. J. Biomed. Mater. Res. 2001, 54, 139–148. [DOI] [PubMed] [Google Scholar]
- Baoyong L.; Jian Z.; Denglong C.; Min L. Burns 2010, 36, 891–896. [DOI] [PubMed] [Google Scholar]
- Schniepp H. C.; Koebley S. R.; Vollrath F. Adv. Mater. 2013, 25, 7028–7032. [DOI] [PubMed] [Google Scholar]
- Teulé F.; Cooper A. R.; Furin W. A.; Bittencourt D.; Rech E. L.; Brooks A.; Lewis R. V. Nat. Protoc. 2009, 4, 341–355. [DOI] [PMC free article] [PubMed] [Google Scholar]
- Albertson A. E.; Teulé F.; Weber W.; Yarger J. L.; Lewis R. V. J. Mech. Behav. Biomed. Mater. 2014, 29, 225–234. [DOI] [PMC free article] [PubMed] [Google Scholar]
- Hinman M. B.; Lewis R. V. J. Biol. Chem. 1992, 267, 19320–19324. [PubMed] [Google Scholar]
- Xu M.; Lewis R. V. Proc. Natl. Acad. Sci. U.S.A. 1990, 87, 7120–7124. [DOI] [PMC free article] [PubMed] [Google Scholar]
- Vollrath F.; Knight D. P. Nature 2001, 410, 541–548. [DOI] [PubMed] [Google Scholar]
- Xu L.; Rainey J. K.; Meng Q.; Liu X.-Q. PLoS One 2012, 7, e50227. [DOI] [PMC free article] [PubMed] [Google Scholar]
- Jin H.-J.; Kaplan D. L. Nature 2003, 424, 1057–1061. [DOI] [PubMed] [Google Scholar]
- Chen X.; Knight D. P.; Vollrath F. Biomacromolecules 2002, 3, 644–648. [DOI] [PubMed] [Google Scholar]
- Simmons A.; Ray E.; Jelinski L. W. Macromolecules 1994, 27, 5235–5237. [Google Scholar]
- Parkhe A. D.; Seeley S. K.; Gardner K.; Thompson L.; Lewis R. V. J. Mol. Recognit. 1997, 10, 1–6. [DOI] [PubMed] [Google Scholar]
- Kümmerlen J.; van Beek J. D.; Vollrath F.; Meier B. H. Macromolecules 1996, 29, 2920–2928. [Google Scholar]
- Jenkins J. E.; Creager M. S.; Lewis R. V.; Holland G. P.; Yarger J. L. Biomacromolecules 2010, 11, 192–200. [DOI] [PMC free article] [PubMed] [Google Scholar]
- Jenkins J. E.; Creager M. S.; Butler E. B.; Lewis R. V.; Yarger J. L.; Holland G. P. Chem. Commun. 2010, 46, 6714–6716. [DOI] [PubMed] [Google Scholar]
- Hronska M.; van Beek J. D.; Williamson P. T. F.; Vollrath F.; Meier B. H. Biomacromolecules 2004, 5, 834–839. [DOI] [PubMed] [Google Scholar]
- Holland G. P.; Jenkins J. E.; Creager M. S.; Lewis R. V.; Yarger J. L. Biomacromolecules 2008, 9, 651–657. [DOI] [PubMed] [Google Scholar]
- Hijirida D. H.; Do K. G.; Michal C.; Wong S.; Zax D.; Jelinski L. W. Biophys. J. 1996, 71, 3442–3447. [DOI] [PMC free article] [PubMed] [Google Scholar]
- Lefèvre T.; Rousseau M.-E.; Pézolet M. Biophys. J. 2007, 92, 2885–2895. [DOI] [PMC free article] [PubMed] [Google Scholar]
- Lefèvre T.; Paquet-Mercier F.; Rioux-Dubé J.-F.; Pézolet M. Biopolymers 2012, 97, 322–336. [DOI] [PubMed] [Google Scholar]
- Riekel C.; Bränden C.; Craig C.; Ferrero C.; Heidelbach F.; Müller M. Int. J. Biol. Macromol. 1999, 24, 179–186. [DOI] [PubMed] [Google Scholar]
- Sampath S.; Isdebski T.; Jenkins J. E.; Ayon J. V.; Henning R. W.; Orgel J. P. R. O.; Antipoa O.; Yarger J. L. Soft Matter 2012, 8, 6713–6722. [DOI] [PMC free article] [PubMed] [Google Scholar]
- Riekel C.; Madsen B.; Knight D.; Vollrath F. Biomacromolecules 2000, 1, 622–626. [DOI] [PubMed] [Google Scholar]
- Riekel C.; Vollrath F. Int. J. Biol. Macromol. 2001, 29, 203–210. [DOI] [PubMed] [Google Scholar]
- Hinman M. B.; Jones J. A.; Lewis R. V. Trends Biotechnol. 2000, 18, 374–379. [DOI] [PubMed] [Google Scholar]
- Wohlrab S.; Mueller S.; Schmidt A.; Neubauer S.; Kessler H.; Leal-Egana A.; Scheibel T. Biomaterials 2012, 33, 6650–6659. [DOI] [PubMed] [Google Scholar]
- Gomes S.; Gallego-Llamas J.; Leonor I. B.; Mano J. F.; Reis R. L.; Kaplan D. L. Macromol. Biosci. 2013, 13, 444–454. [DOI] [PubMed] [Google Scholar]
- Gomes S.; Leonor I. B.; Mano J. F.; Reis R. L.; Kaplan D. L. Biomaterials 2011, 32, 4255–4266. [DOI] [PMC free article] [PubMed] [Google Scholar]
- Spiess K.; Wohlrab S.; Scheibel T. Soft Matter 2010, 6, 4168–4174. [Google Scholar]
- Huemmerich D.; Slotta U.; Scheibel T. Appl. Phys. A: Mater. Sci. Process. 2006, 82, 219–222. [Google Scholar]
- Rabotyagova O. S.; Cebe P.; Kaplan D. L. Biomacromolecules 2009, 10, 229–236. [DOI] [PubMed] [Google Scholar]
- Rabotyagova O. S.; Cebe P.; Kaplan D. L. Macromol. Biosci. 2010, 10, 49–59. [DOI] [PubMed] [Google Scholar]
- Hardy J. G.; Leal-Egaña A.; Scheibel T. R. Macromol. Biosci. 2013, 13, 1431–1437. [DOI] [PubMed] [Google Scholar]
- Krishnaji S. T.; Bratzel G.; Kinahan M. E.; Kluge J. A.; Staii C.; Wong J. Y.; Buehler M. J.; Kaplan D. L. Adv. Funct. Mater. 2013, 23, 241–253. [Google Scholar]
- Jiang C.; Wang X.; Gunawidjaja R.; Lin Y.-H.; Gupta M. K.; Kaplan D. L.; Naik R. R.; Tsukruk V. V. Adv. Funct. Mater. 2007, 17, 2229–2237. [Google Scholar]
- Bini E.; Foo C. W. P.; Huang J.; Karageorgiou V.; Kitchel B.; Kaplan D. L. Biomacromolecules 2006, 7, 3139–3145. [DOI] [PubMed] [Google Scholar]
- Bettinger C. J. Int. J. Polym. 2010, 563–567. [DOI] [PMC free article] [PubMed] [Google Scholar]
- Kim D.-H.; et al. Nat. Mater. 2010, 9, 511–517. [DOI] [PMC free article] [PubMed] [Google Scholar]
- Wendt H.; Hillmer A.; Reimers K.; Kuhbier J. W.; Schäfer-Nolte F.; Allmeling C.; Kasper C.; Vogt P. M. PLoS One 2011, 6, e21833. [DOI] [PMC free article] [PubMed] [Google Scholar]
- Vendrely C.; Scheibel T. Macromol. Biosci. 2007, 7, 401–409. [DOI] [PubMed] [Google Scholar]
- Slotta U.; Tammer M.; Kremer F.; Koelsch P.; Scheibel T. Supramol. Chem. 2006, 18, 465–471. [Google Scholar]
- Huemmerich D.; Slotta U.; Scheibel T. Appl. Phys. A: Mater. Sci. Process. 2006, 82, 219–222. [Google Scholar]
- Krishnaji S. T.; Huang W.; Rabotyagova O.; Kharlampieva E.; Choi I.; Tsukruk V. V.; Naik R.; Cebe P.; Kaplan D. L. Langmuir 2011, 27, 1000–1008. [DOI] [PubMed] [Google Scholar]
- Hardy J. G.; Leal-Egaña A.; Scheibel T. R. Macromol. Biosci. 2013, 13, 1431–1437. [DOI] [PubMed] [Google Scholar]
- Yue H.; N K. C.; Carl T.. Recovery of biofilament proteins from biological fluids. WO2003057720 A2, July 17, 2003.
- Renugopalakrishnan V.; Lewis R. V.. Bionanotechnology Proteins to Nanodevices; Springer: Dordrecht, 2006. [Google Scholar]
- Heim M.; Keerl D.; Scheibel T. Angew. Chem., Int. Ed. 2009, 48, 3584–3596. [DOI] [PubMed] [Google Scholar]
- Ko F. K.; Jovicic J. Biomacromolecules 2004, 5, 780–785. [DOI] [PubMed] [Google Scholar]
- Hayashi C. Y.; Blackledge T. A.; Lewis R. V. Mol. Biol. Evol. 2004, 21, 1950–1959. [DOI] [PubMed] [Google Scholar]
- Bigi A.; Cojazzi G.; Panzavolta S.; Rubini K.; Roveri N. Biomaterials 2001, 22, 763–768. [DOI] [PubMed] [Google Scholar]
- Mallika P.; Himabindu A.; Shailaja D. J. Appl. Polym. Sci. 2006, 101, 63–69. [Google Scholar]
- Warwicker J. O. J. Mol. Biol. 1960, 2, 350–IN1. [DOI] [PubMed] [Google Scholar]
- Cullity B.Elements of X-ray Diffraction; Addison-Wesley Publishing: Reading, MA, 1959; Chap. 3, p 99. [Google Scholar]
- Alexander L. E.X-ray Diffraction Methods in Polymer Science; Wiley-Interscience: New York, 1969. [Google Scholar]
- Zhao C.; Yao J.; Masuda H.; Kishore R.; Asakura T. Biopolymers 2003, 69, 253–259. [DOI] [PubMed] [Google Scholar]
- Trabbic K. A.; Yager P. Macromolecules 1998, 31, 462–471. [Google Scholar]
- Hardy J. G.; Romer L. M.; Scheibel T. R. Polymer 2008, 49, 4309–4327. [Google Scholar]
- Brandrup J.; Immergut E. H.; Grulke E. A.. Polymer Handbook, 4th ed.; Wiley: New York; Chichester, 2004. [Google Scholar]
- Vollrath F.; Barth P.; Basedow A.; Engström W.; List H. Vivo Athens Greece 2002, 16, 229–234. [PubMed] [Google Scholar]
Associated Data
This section collects any data citations, data availability statements, or supplementary materials included in this article.


