Abstract
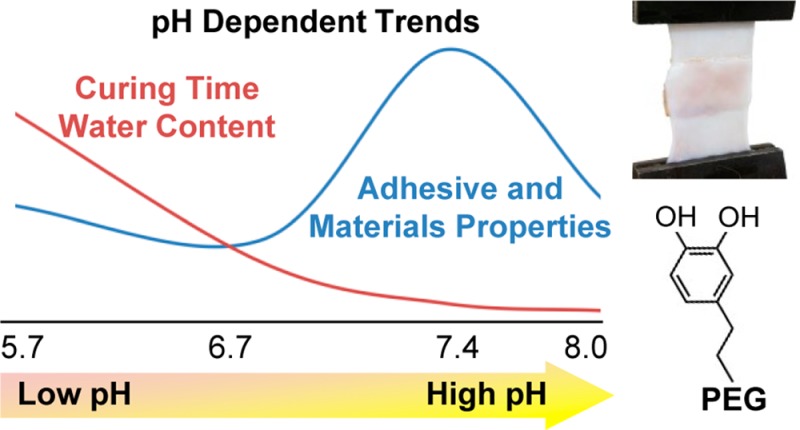
The remarkable underwater adhesion strategy employed by mussels has inspired bioadhesives that have demonstrated promise in connective tissue repair, wound closure, and local delivery of therapeutic cells and drugs. While the pH of oxygenated blood and internal tissues is typically around 7.4, skin and tumor tissues are significantly more acidic. Additionally, blood loss during surgery and ischemia can lead to dysoxia, which lowers pH levels of internal tissues and organs. Using 4-armed PEG end-capped with dopamine (PEG-D) as a model adhesive polymer, the effect of pH on the rate of intermolecular cross-linking and adhesion to biological substrates of catechol-containing adhesives was determined. Adhesive formulated at an acidic pH (pH 5.7–6.7) demonstrated reduced curing rate, mechanical properties, and adhesive performance to pericardium tissues. Although a faster curing rate was observed at pH 8, these adhesives also demonstrated reduced mechanical and bioadhesive properties when compared to adhesives buffered at pH 7.4. Adhesives formulated at pH 7.4 demonstrated a good balance of fast curing rate, elevated mechanical properties and interfacial binding ability. UV–vis spectroscopy evaluation revealed that the stability of the transient oxidation intermediate of dopamine was increased under acidic conditions, which likely reduced the rate of intermolecular cross-linking and bulk cohesive properties for hydrogels formulated at these pH levels. At pH 8, competing cross-linking reaction mechanisms and reduced concentration of dopamine catechol due to auto-oxidation likely reduced the degree of dopamine polymerization and adhesive strength for these hydrogels. pH plays an important role in the adhesive performance of mussel-inspired bioadhesives and the pH of the adhesive formulation needs to be adjusted for the intended application.
Introduction
Tissue adhesives are universally applied in surgery. Tissue adhesives can overcome challenges associated with traditional mechanical wound closure devices (e.g., sutures, tacks, and staples), which are unable to stop leakage or reconnect tissues with low cohesive properties (e.g., lung, spleen), cause localized stress concentrations that lead to failure, and cause persistent pain and nerve damage.1−3 However, existing tissue adhesives are hampered by weak adhesive strength (e.g., fibrin glue) and poor biocompatibility (e.g., cyanoacrylate).4−6 Thus, there is a continued need for the development of biocompatible tissue adhesives with superior performance.
Marine mussels (Mytilus edulis) secrete exceptional underwater adhesive proteins, which enable these organisms to tightly attach to various surfaces (rocks, piers, boats, etc.) in a wet, saline environment.7,8 Mussel adhesive proteins (MAPs) contain as much as 28 mol % of an unusual amino acid, 3,4-dihydroxyphenylalanine (DOPA), which plays an important role in adhesion and as a precursor for intermolecular cross-linking.9 The catechol side chain of DOPA is readily oxidized in the presence of enzymatic (e.g., tyrosinase) and chemical (e.g., periodate) oxidants or under basic conditions in the presence of oxygen to form highly reactive quinone, which is capable of undergoing the polymerization necessary for the curing of the adhesive.10,11 Quinone is also capable of forming strong interfacial bonds with biological substrates.12,13 Polymeric materials functionalized with DOPA and various catechol analogues (e.g., dopamine, 3,4-dihydroxyhydrocinnamic acid) have demonstrated promise in sealing fetal membranes,14,15 Achilles tendon repair,16 suture-less wound closure,17 immobilization and delivery of therapeutic cells,18,19 and targeted local delivery of drugs.20
An effective tissue adhesive needs to cure rapidly and adhere tightly to biological substrates under physiological conditions. Although the pH of oxygenated blood and internal tissues ranges from 7.2 to 7.45,21,22 the pH levels of skin (pH = 4–6)23 and subcutaneous tissues (pH = 6.7–7.1)24 are significantly lower. Similarly, tumor tissues have a severe pH gradient25 and are more acidic (average circa pH 7)26 than healthy tissues. Most importantly, ischemia and blood loss as a result of trauma and surgery can result in tissue dysoxia due to insufficient oxygen delivery to meet metabolic demands.24,27 Dysoxia can lead to a decreased tissue pH level due to anaerobic production of protons. Prolonged hemorrhage has been shown to lower skeletal muscle and liver tissue pH to around 7.28,29 Ischemia as a result of arterial and venous occlusion can also reduce the normal blood pH by as much as 0.66 pH units.30 Similarly, intense exercise reduces blood and muscle pH to as low as 6.4.31 Moreover, synthesis of catechol containing adhesive requires acid and base treatments32,33 and residual impurities may alter the pH of the adhesive formulation.
Since the physiological pH varies between tissue types and may be drastically reduced during surgery, it is necessary to understand the effect of pH on the effectiveness of bioadhesives inspired by marine mussels. Recently, Yu et al.34 reported that pH is critical to the performance of mussel adhesive proteins. The interfacial binding energy measured between the protein and titanium surfaces was the highest under acidic conditions (pH = 3). Catechol and metal ions also form strong complexes with stoichiometry and stability that are pH-dependent.35−40 However, the effect of pH on its adhesion to biological substrates has yet to be determined. Catechol forms reversible coordination bonds with metal oxides and ions, which differ from the oxidation-mediated covalent bonds that catechol forms with nucleophiles (e.g., −NH2, −SH) found on biological substrates.11,12 Additionally, there is a need to understand the effects of pH on the rate of intermolecular cross-linking of catechol, which affects the rate of curing and the bulk cohesive properties of catechol-containing adhesives.
Here, we used a 4-armed PEG end-capped with dopamine (PEG-D) as a model adhesive polymer to study the effect of pH on the performance of MAP-inspired adhesives. PEG was chosen as a polymer support due to the polymer’s inert and hydrophilic nature. The effect of pH on the curing rate, average molecular weight between cross-linking (M̅c), cytotoxicity, and mechanical and bioadhesive properties of PEG-D hydrogel was determined. Spectroscopic analysis was also performed to track the formation of oxidation intermediates of dopamine to elucidate how pH affects the oxidation-mediated cross-linking of PEG-D.
Experimental Section
Materials
Dopamine HCl and N-methylmorpholine were purchased from Acros Organics (Fair Lawn, New Jersey). The 4-arm 10k Da N-hydroxysuccinimide ester activated poly(ethylene glycol) (PEG-NHS) was purchased from JenKem U.S.A., Inc. (Allen, TX). Anhydrous dimethylformamide, sodium phosphate monobasic monohydrate, sodium phosphate dibasic anhydrous, concentrated hydrochloric acid (36.5–38%), and sodium periodate (NaIO4) were purchased from Acros Organics (Fair Lawn, New Jersey). Fresh bovine pericardium was purchased from Sierra for Medical Science (Whittier, California). Spectra/Por dialysis membrane (molecular weight cut off (MWCO): 3500 Da) was purchased from Spectrum Laboratories (Rancho Dominguez, California). Dulbecco’s modified Eagle’s medium (DMEM; with 4.5 g/L glucose and glutamine, without sodium pyruvate) and trypsin EDTA (0.05% trypsin/0.53 mM EDTA in HBSS) were obtained from Corning Cellgro (Manassas, VA). Fetal bovine serum and penicillin-streptomycin (10 units/mL) were purchase from Thermo Scientific (Rockford, IL). 3-(4,5-Dimethylthiazol-2-yl)-2,5-diphenyltetrazolium bromide 98% (MTT) was purchased from Alfa Aesar (Ward Hill, MA).
Synthesis of Dopamine-Functionalized PEG
Dopamine-functionalized PEG (PEG-D) was prepared using a previously published protocol with some minor modifications (Scheme S1).38 Briefly, PEG-NHS (1.0 g, 0.4 mmol NHS), and dopamine HCl (120 mg, 0.60 mmol) were separately dissolved in 4 mL each of anhydrous dimethylformamide under nitrogen. The dopamine was neutralized with N-methylmorpholine (110 μL, 1 mmol) for 15 min, after which the solutions were combined and the mixture was stirred overnight. The mixture containing the crude polymer was diluted with water to a concentration of ∼15–20 mg/mL and dialyzed for 46 h in water, acidified to pH 3.5, using concentrated HCl. The polymer was dialyzed in unbuffered deionized water for an additional 2 h to remove trace amounts of acid and then freeze-dried. The extent of end group functionalization was determined using UV–vis spectroscopy at a wavelength of 280 nm, based on a standard curve obtained using dopamine.10 Coupling efficiency for PEG-D was 94 ± 6.0%. 1H NMR: PEG-D (400 MHz, DMSO-d6) δ 8.72 (s, 1H, -C6H3OH(OH)), 8.61 (s, 1H, -C6H3OH(OH)), 7.62 (t, 1H, -CH2-(NH)-C(=O)-), 6.62 (d, 1H, -C6H2H(OH)2), 6.57 (d, 1H, -C6H2H(OH)2), 6.43 (d, 1H, -C6H2H(OH)2), 3.84 (s, 2H, PEG-CH2-C(=O)-NH-), 3.74–3.27 (m, PEG), 3.24 (m, 2H, C6H3-CH2-CH2-(NH)-C(=O)-), 2.56 (t, 2H, C6H3-CH2-CH2-(NH)-C(=O)-).
Formation of Hydrogel
PEG-D and NaIO4 were separately dissolved in 10 mM sodium phosphate buffer with a pH of 5.7, 6.7, 7.4, or 8.0 at a concentration that is double that of their prospective final concentrations in the hydrogel. An equal volume of these two precursor solutions were mixed together and allowed to cure prior to testing. Unless otherwise stated, the final concentration of PEG-D was kept at 75 mg/mL, while the NaIO4 concentration was kept at a molar ratio of 0.25–1.5 relative to dopamine (corresponding to a NaIO4 concentration of 14.5–87.0 mM). The curing time was determined when the polymer mixture ceased flowing in an inverted vial containing the fluid.10 For compression, lap shear, and cytotoxicity experiments, hydrogels were formulated with a NaIO4/dopamine molar ratio of 0.5.
Determination of Molecular Weight between Cross-Links
PEG-D hydrogels were characterized by the determination of the average molecular weight between cross-links (M̅c), as determined from equilibrium swelling data and application of the modified Flory–Rehner equation.41 Precursor solutions were added to a 1 mm thick mold and allowed to cure overnight. Hydrogels were cut into 1 cm diameter discs using a biopsy punch and samples were submerged in phosphate buffer saline (PBS; pH = 7.4) for 24 h. Swollen hydrogels were further dried under vacuum for at least 2 days. The mass of the hydrogel both at the swollen (Ms) and dried (Md) states was determined. The polymer volume fraction in the swollen hydrogel (vs) was calculated using the following equation:42
| 1 |
where Vp and Vs are the volume of the hydrogels in the dried and swollen state, respectively, and ρp is the density of PEG (1.123 g/cm3).43 We assumed the density of water to be 1 g/cm3. M̅c was calculated by the following equation:41
| 2 |
where Mn is the starting molecular weight (MW) of PEG-D, VH2O is the molar volume of water (18.1 mol/cm3), and χ is the Flory–Huggins parameter for PEG and water (0.462).44 The polymer volume fraction in the relaxed hydrogel (vr) was found by eq 1 using the mass of a hydrogel that was cured overnight and its mass after drying as Ms and Md, respectively. Average vr value (0.0680 ± 0.000885) of 12 hydrogels was used in the calculation (Table S1). The equilibrium swelling ratio (q) was determined by the following equation: q = vr/vs.
Compression Testing
Unconfined, uniaxial compression testing was performed using a servohydraulic materials testing system (8872 Instron, Norwood, MA). Hydrogel samples were cured in a 4 mm thick mold for overnight (∼18 h) and cut into a disc with a diameter of 1 cm using a biopsy punch. The diameter and thickness of each hydrogel sample were measured using a digital caliper prior to compression testing. Hydrogels (n = 3) were compressed at a rate of 1.8 mm/min until the sample fractured. Stress was determined based on the measured load divided by the initial surface area of the sample.45 Strain was determined by dividing the change in the position of the compressing plate by the initial thickness of the hydrogel. Toughness was determined by the integral of the stress–strain curve. The elastic modulus was taken from the slope of the stress–strain curve between a strain of 0.05 and 0.2.
Lap Shear Adhesion Testing
A total of 5 μL each of 300 mg/mL PEG-D and 56 mM NaIO4 solutions in 10 mM sodium phosphate buffer adjusted to the desired pH were added to one end of a piece of bovine pericardium (2.5 cm × 2.5 cm). The final concentration of the PEG-D and NaIO4 were 150 mg/mL and 27.8 mM, respectively, (NaIO4/dopamine molar ratio = 0.5). These solutions were mixed using the tip of a pipet and the adhesive joint was formed by placing the second piece of bovine pericardium over the first with 1 cm overlap. The adhesive joint was compressed with a 100 g weight for 10 min and further incubated in PBS (pH 7.4) at 37 °C overnight. The samples were pulled to failure using a servohydraulic materials testing system (8872 Instron, Norwood, MA) at a rate of 5 mm/min, and the maximum load and displacement were recorded.46 Additionally, the work of adhesion was determined by the integral of the load versus displacement curve and normalized by the initial contact area of the adhesive joint. To simulate adhesion to tissues at different pH levels, pericardium tissues were equilibrated in PBS adjusted to a pH of 5.7, 6.7, 7.4, or 8.0 for 2 days and then kept frozen until testing. At least nine samples were tested per formulation.
Spectroscopic evaluation of PEG-D oxidation
PEG-D (50 μM PEG-D; 200 μM dopamine) was dissolved in 10 mM sodium phosphate (pH 5.7, 6.7, 7.4, or 8.0) and NaIO4 (100 μM) was added. At a series of predetermined times, UV/vis spectra (200 to 700 nm; PerkinElmer Lambda35) of the solution were recorded at a scan rate of 960 nm/min using sodium phosphate buffer as the reference. Reported values for N-acetyldopamine quinone (λmax = 392; ε = 1130 M–1 cm–1)47 and N-acetyldehydroDOPA ethyl ester (λmax = 322; ε = 14481 M–1 cm–1)48 were used to identify the oxidation intermediates and calculate their respective concentrations using Beer’s law, A = εbc, where A is the absorbance, ε is the molar absorptivity constant, b is the path length (1 cm), and c is the concentration.
Assessment of Cytotoxicity
Cell viability was measured using a quantitative MTT cytotoxicity assay following published protocols with minor modifications.17 Hydrogels were formulated with a final concentrations of 75 mg/mL PEG-D and 13.6 mM NaIO4 (0.5 NaIO4/dopamine molar ratio) and cured overnight. Samples were cut into disc shape (5 mm diameter, 2 mm thick) and sterilized by submersion in 70% (v/v) ethanol for 45 min followed by washing three times with 20 mL of sterile PBS for 90 min.49 The hydrogels were then transferred into a 24-well plate and incubated with DMEM (10 mg/mL) for 24 h (37 °C, 5% CO2, and 95% air). L929 mouse fibroblasts were suspended in DMEM and seeded into a 96-well microculture plate with a density of 1 × 10⁴ cells/100 μL/well and incubated for 24 h at 37 °C in a 5% CO2 humidified incubator to obtain a confluent monolayer of cells. The cell medium was then removed and replaced with hydrogel extract for an additional 24 h of incubation. The hydrogel extract was removed and the cells were incubated with 50 μL of 1 mg/mL of MTT in PBS for 2 h. Finally, the PBS solution was replaced with 100 μL of DMSO to dissolve the formazan, and the absorbance of the DMSO solution was detected at 570 nm (reference 650 nm). The relative cell viability was calculated as the ratio between the mean absorbance values of the sample to the mean absorbance value of cells cultured in DMEM. Samples with relative cell viability less than 70% are deemed to be cytotoxic.50 For each hydrogel formulation (5.7, 6.7, 7.4, and 8.0 pH), three independent cultures were prepared and the cytotoxicity test was repeated three times for each culture to give nine separate tests for each hydrogel type.
Statistical Analysis
Statistical analysis was performed using JPM Pro 10 software (SAS, Cary, NC). One-way analysis of variance (ANOVA) with Tukey HSD analysis was performed for comparing means of multiple groups using a p-value of 0.05.
Results and Discussion
High purity PEG-D was synthesized with elevated coupling efficiency, as verified using 1H NMR and UV–vis spectroscopy, respectively. The 1H NMR spectrum of PEG-D (Figure S1) contains three phenyl proton peaks (6.62, 6.57, and 6.43 ppm), indicating the attachment of the dopamine catechol group to PEG (3.74–3.27 ppm). The end-group coupling efficiency was determined to be 94 ± 6.0% based on the absorbance of the catechol peak at 280 nm using UV–vis spectroscopy.10
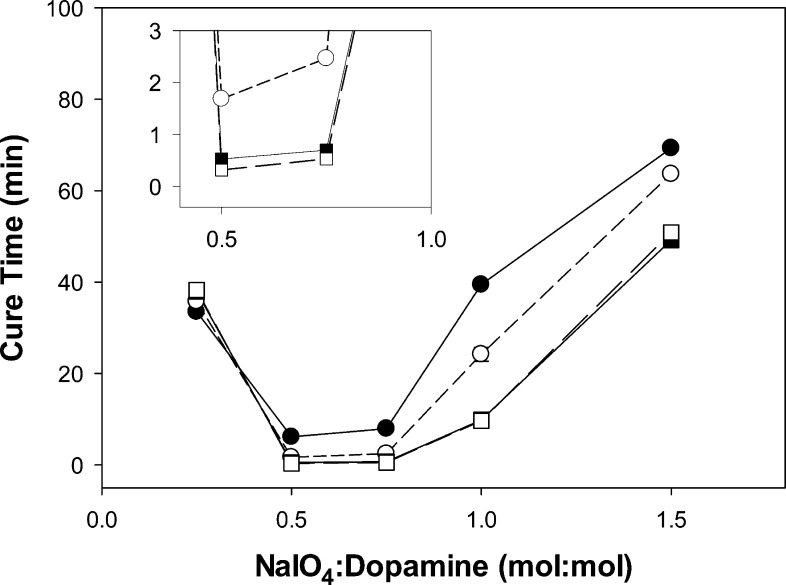
Mixing NaIO4 and PEG-D solutions readily oxidizes the terminal dopamine to highly reactive quinone and transforms the initially colorless polymer solution into a light brown-colored hydrogel network. The time it took for the hydrogel to cure was dependent on both the NaIO4/dopamine molar ratio and the pH of the precursor solutions (Figure 1). At all pH levels, the curing time was the fastest at a NaIO4:dopamine ratio between 0.5 and 0.75. This implies that a near stoichiometric ratio of the reduced (catechol) and oxidized (quinone) form of dopamine is necessary for rapid cross-linking and curing of the hydrogel. A similar concentration dependence was previously reported for periodate-mediated cross-linking of DOPA-functionalized PEG.10 The curing time decreased with increasing pH. For example, at a NaIO4/dopamine ratio of 0.5, curing time decreased from over 6 min (pH 5.7) to under 20 s (pH 8.0).
Figure 1.
Cure time of PEG-D as a function of NaIO4/dopamine molar ratio for hydrogels formulated with precursor solutions adjusted to a pH of 5.7 (●), 6.7 (○), 7.4 (■), and 8.0 (□). The inset enlarges the curing time results at a NaIO4/dopamine molar ratio between 0.5 and 1.
The equilibrium swelling ratio measures the extent of swelling from the relaxed state of an adhesive (i.e., after curing) and its swollen state when equilibrium swelling has been reached (Figure S2). Adhesive formulated at pH 7.4 exhibited the lowest amount of swelling. Swelling ratio is also the lowest when cured at a NaIO4/dopamine ratio between 0.5 and 1.0. The relatively low swelling ratio (1.1–1.8) is ideal for tissue adhesives as excessive swelling can lead to compression of surrounding nerves and blood vessels.51,52 The swelling ratios obtained here are similar to the reported values of catechol-modified PEG with similar architecture.10,53
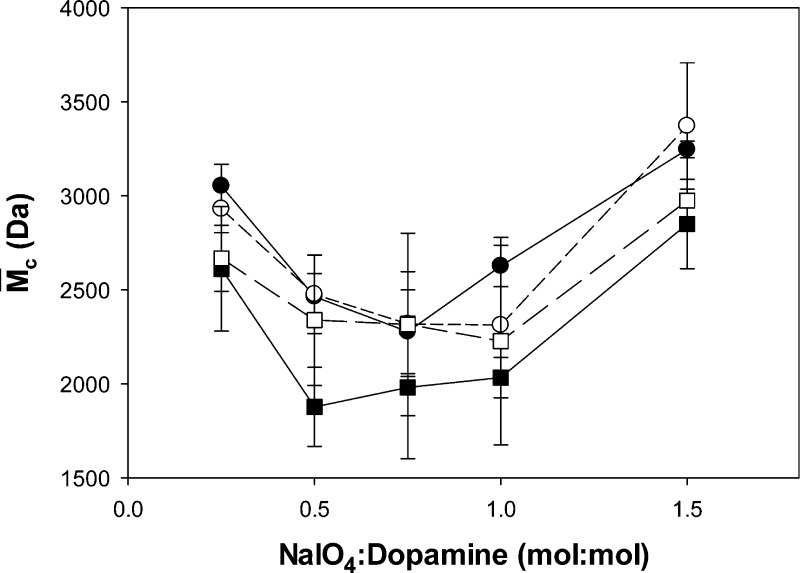
The equilibrium swelling data was used to determine the average molecular weight between cross-links (M̅c) of PEG-D hydrogel (Figure 2). M̅c is defined as the average molecular weight of polymer between two consecutive junctions or cross-linking points in a network. M̅c is an important property for a hydrogel and is inversely proportional to cross-linking density and mechanical properties of the material.54,55 In general, PEG-D hydrogel M̅c values mirrored the curing time results, where formulations that yielded shorter cure times exhibited lower M̅c values. M̅c values were the lowest at NaIO4/dopamine ratios between 0.5 and 1 and decreased with increasing pH from 5.7 to 7.4. This observation is in agreement with previous work where reaction conditions that promoted faster catechol cross-linking rates also resulted in higher degrees of polymerization and hydrogel networks with reduced M̅c.10 However, hydrogels formulated at pH 8.0 exhibited higher M̅c values compared to those formulated at pH 7.4, despite having shorter curing times. This suggests that, while fast intermolecular cross-linking can be achieved at pH 8.0, the same condition does not promote an elevated degree of polymerization.
Figure 2.
M̅c as a function of NaIO4/dopamine molar ratio for hydrogels formulated with precursor solutions adjusted to a pH of 5.7 (●), 6.7 (○), 7.4 (■), and 8.0 (□).
In our PEG-D system, the 4-armed PEG consists of four inert PEG chains of equal length (e.g., 2500 Da each) terminated with a reactive dopamine moiety. The branched architecture of PEG-D provides a junction point and if all catechols were involved in dimerization, it would lead to network formation. However, dimerization does not result in the formation of a new network junction (Figure 3A). The formation of a trimer or an oligomer with a higher number of repeating units would be required to form a new junction point, as it requires three or more elastic polymer chains (i.e., functionality ≥ 3, Figure 3B). The M̅c values reported here closely approximate the MW of PEG arms of 2500 Da. PEG-D cured at pH 7.4 and at a NaIO4/dopamine ratio between 0.5 and 1.0 exhibited significantly lower M̅c values (around 2000 Da). The observed decrease in M̅c values in PEG-D hydrogels corresponded to an increase in the degree of dopamine polymerization. DOPA was previously determined to form oligomers with the number of repeat as high as six.10 The modified Flory–Rehner equation utilized in this study does not account for the change in the functionality of the junction points for these formulations, which likely promoted the formation of higher MW oligomers.
Figure 3.
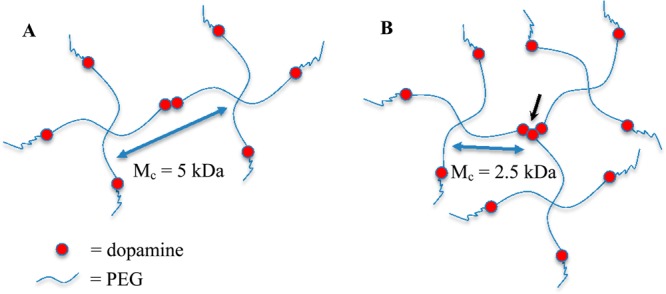
Schematic representation of idealized PEG-D networks when dopamine moieties form a dimer (A) and a trimer (B). Formation of the trimer or oligomers with a higher number of repeat forms a new network junction (black arrow), resulting in decreased M̅c.
The mechanical properties of PEG-D hydrogels were determined by unconfined compression testing (Table 1). The calculated elastic modulus values increased with increasing pH levels of the precursor solution. Additionally, hydrogels formulated at pH 7.4 exhibited the highest maximum compressive stress and toughness among all the formulations tested. These values were more than double those found for adhesives formulated at other pH levels. Results from compression testing indicated that conditions that promoted fast curing rate and reduced M̅c contributed to forming hydrogels with improved mechanical properties.
Table 1. Results of Uniaxial Unconfined Compression Testing on PEG-D Hydrogelsa.
| pH | max stress (kPa) | max strain | toughness (J/m3) | elastic modulus (kPa) |
|---|---|---|---|---|
| 5.7 | 435 ± 87A | 0.727 ± 0.010A | 71.1 ± 13A | 96.5 ± 50A |
| 6.7 | 322 ± 89A | 0.573 ± 0.061BC | 49.0 ± 10A | 158 ± 27AB |
| 7.4 | 1030 ± 300B | 0.670 ± 0.047AB | 138 ± 44B | 212 ± 13BC |
| 8.0 | 429 ± 179A | 0.529 ± 0.032C | 55.3 ± 21A | 242 ± 10C |
Superscript letters indicate statistical significance and formulations not linked by the same letter are statistically different.
Two lap shear adhesion experiments were performed to evaluate the effect of pH on the adhesive properties of PEG-D hydrogels. In the first experiment, hydrogel precursor solutions were buffered to a desired pH while the tissue substrate was maintained at a pH of 7.4 (Figure 4A). This experiment simulates the effect of carry-over impurities from the synthesis of the adhesive polymer that could potentially alter the pH of the adhesive formulation. Adhesive formulated at pH 7.4 exhibited the highest adhesive strength and work of adhesion, which were two to four times higher than those measured for adhesives buffered at other pH levels. This hydrogel formulation also demonstrated the highest elevated cross-linking densities based on M̅c and compression testing results. This result indicates that the bulk cohesive properties of the adhesive significantly influence its adhesive performance.32,56
Figure 4.
Lap shear adhesion test results performed with the precursor solutions adjusted to various pH levels using pericardium equilibrated at pH 7.4 (A) and the precursor solution buffered at pH 7.4 while using pericardium equilibrated at various pH levels (B). PEG-D was cured with a NaIO4/dopamine molar ratio of 0.5. The symbols * and # denote that results associated with these formulations were statistically different from those of other formulations based on ANOVA analysis. Black and gray bars indicate lap shear and work of adhesion results, respectively. For (B), 2 out of 9 samples failed prior to testing for tissue buffered at pH 5.7.
In the second adhesion experiment, pericardium substrates were equilibrated at various pH levels prior to testing while keeping the adhesive precursors at pH 7.4 (Figure 4B). This experiment simulates the effect of applying adhesives to tissues with a pH that deviates from 7.4 (e.g., skin, tumor tissues, or dysoxic tissues during surgery). Adhesive applied to pH 7.4 tissue demonstrated the highest adhesive strength and work of adhesion. Adhesives adhered poorly to tissues buffered at acidic pH levels and 22% of the adhesive joints (2 out of 9) failed prior to testing for tissues buffered at pH 5.7. Quinone reacts with nucleophiles found on biological substrates, which are protonated under acidic conditions, reducing their ability to form interfacial bonds.11,12 Although the performance of the adhesive was significantly improved when applied to tissues buffered at pH 8.0, the adhesive strength and work of adhesion values obtained at pH 8.0 were less than half of those for pH 7.4. Residual buffer found on the tissue surface may have altered the pH of the adhesive, resulting in reduced bulk cohesive properties similar to the effect of buffering the pH of the adhesive precursors. pH treatment may also alter the surface chemistry of the pericardium tissue, which needs to be further characterized.
For both adhesion tests, samples were allowed to cure overnight prior to testing. Cross-linking of catechol may take up to 8 h to fully complete.10 Although catechol dimer forms rapidly, resulting in relatively fast solidification, catechol can form oligomers with up to six catechol groups with time, resulting in increased stiffness and cross-linking density. Given that the bulk properties of adhesives strongly affect the measured lap shear adhesive strength,56 by performing adhesion testing after the adhesives have fully cross-linked, we were able to compare the effect of pH on dopamine’s cross-linking chemistry and its effect on the adhesive performance of PEG-D. Additionally, we have included the adhesion results of PEG-D after curing for 1 h (Table S2). As expected, both adhesive strength and work of adhesion values (3.3 ± 0.52 kPa and 4.8 ± 1.0 J/m2, respectively) were significantly lower than those for adhesive formulations cured overnight (7.8 ± 1.7 kPa and 15 ± 2.0 J/m2, respectively). Even though the adhesive performance of PEG-D was lower after only 1 h of curing, the 1 h data for PEG-D was still significantly higher when compared to commercially available PEG-based sealant, CoSeal (Baxter, Inc., 0.63 ± 0.19 kPa and 1.5 ± 0.65 J/m2, respectively), which was allowed to cure overnight (Table S2).
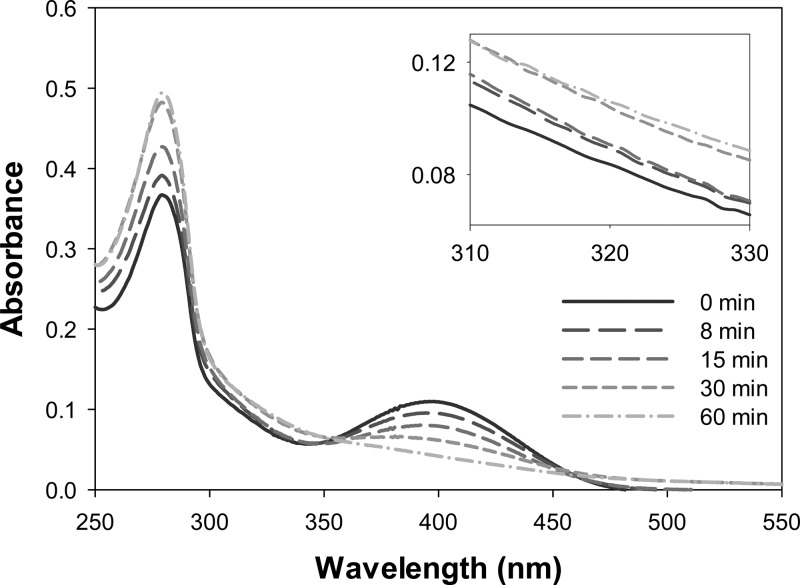
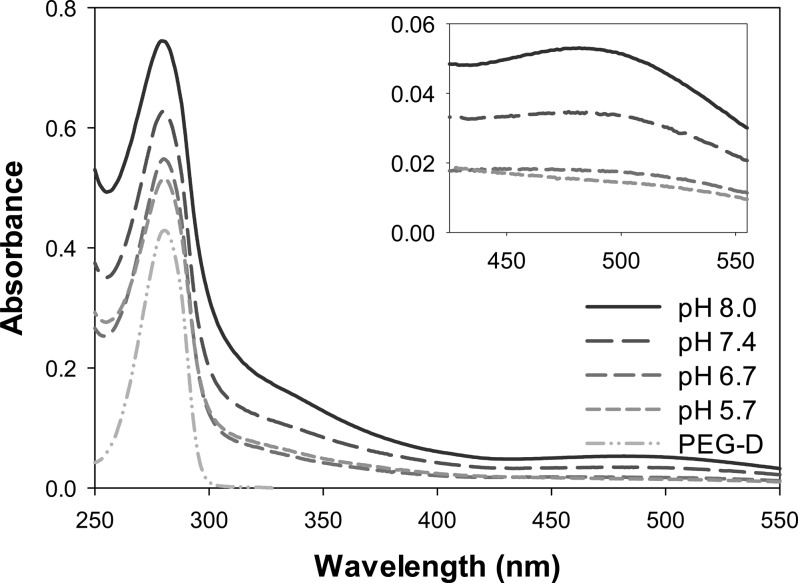
We tracked the evolution of PEG-D UV–vis spectra with time to evaluate how pH affects the oxidation mediated cross-linking of dopamine. Only the time evolution of PEG-D UV–vis absorbance at pH 5.7 is shown (Figure 5) as the rate of reaction is much slower at this pH as compared to the reaction performed at elevated pH levels. However, PEG-D reactions conducted at other pH levels followed a similar trend. Prior to the addition of the oxidant, PEG-D exhibited a single peak (λmax = 280 nm), indicative of a catechol (Figure S3).48,57 A new peak at 395 nm and a shoulder at about 320 nm appeared immediately after the addition of NaIO4, corresponding to dopamine quinone and α,β-dehydrodopamine, respectively.39,43 With time, there was a steady decrease in the absorbance peak at 395 nm and an increase at 320 nm. Absorbance at 280 nm initially decreased, but increased with time as the catechol transformed into other phenolic reaction intermediates with similar absorbance maxima.39,43
Figure 5.
Evolution of UV–vis spectrum with time for a solution containing 50 μM PEG-D (200 μM dopamine) and 100 μM of NaIO4 in 10 mM sodium phosphate buffered at pH 5.7. The absorbance was recorded between 0 and 60 min after the addition of NaIO4. The inset enlarges the absorbance at 310 to 330 nm.
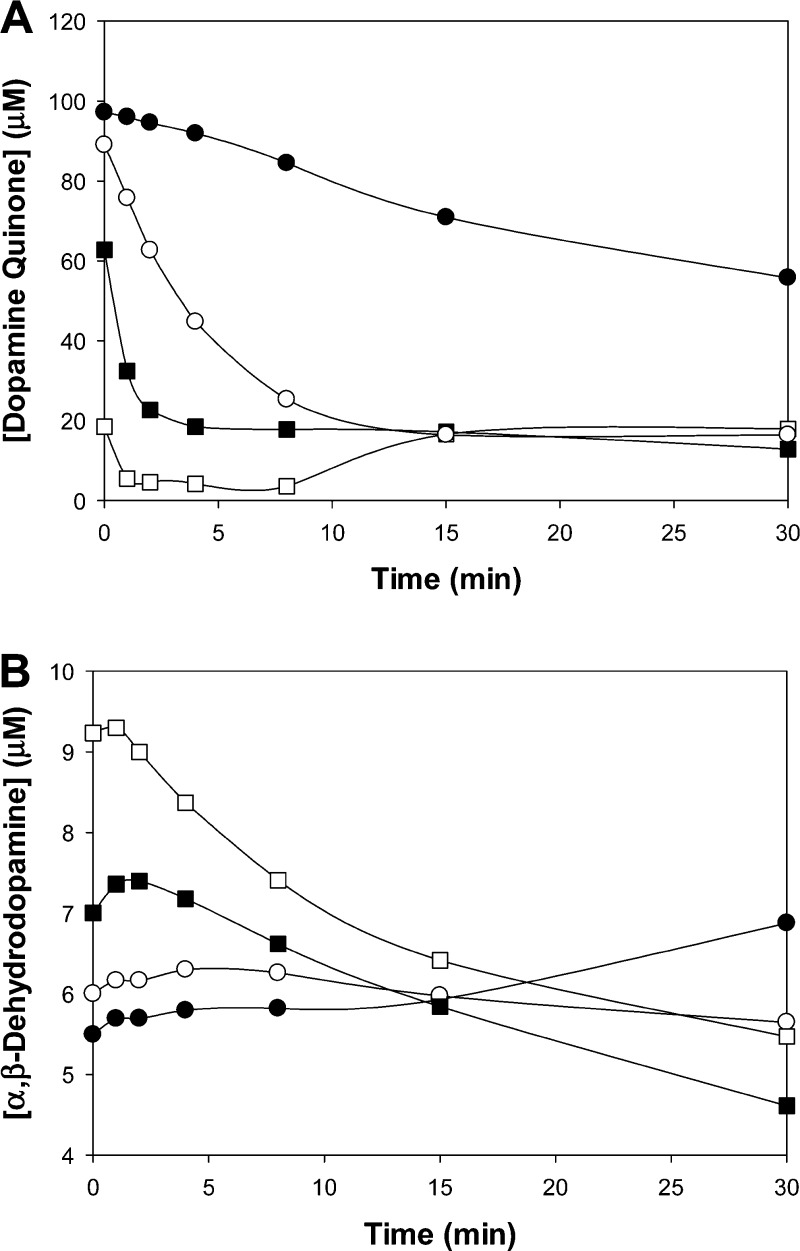
Previously reported molar absorptivity values were used to quantify the molar concentration of dopamine quinone and α,β-dehydrodopamine (Figure 6).47,48,58 At time zero, there was a near stoichiometric production of quinone (97 μM) relative to the amount of added NaIO4 (100 μM) for pH 5.7, indicating the direct transformation of catechol to quinone. With increasing pH, there was a decreased amount of initially measurable quinone. We likely did not capture the early production and disappearance of quinone due to its shorter half-life under basic conditions.59 The quinone concentration decreased with time as the reactive quinone further transforms into other oxidation products. There was an increase in the rate of disappearance of quinone with increasing pH. For pH 8.0, only 20 μM was detected initially, which decreased to less than 5.5 μM within 1 min. With time (t > 8 min), there appeared to be an increase in quinone concentration for pH 8.0. However, this increase is probably due to the production of other intermediates as opposed to additional quinone production, as there is a general increase in the spectra as a whole.
Figure 6.
Change in the concentration of dopamine quinone (A) and α,β-dehydrodopamine (B) for a solution containing 50 μM of PEG-D (200 μM dopamine) and 100 μM of NaIO4 adjusted to a pH of 5.7 (●), 6.7 (○), 7.4 (■), and 8.0 (□).
The decay of quinone coincided with the emergence of α,β-dehydrodopamine (Figure 6B). For pH 5.7, there was a steady increase in the concentration of α,β-dehydrodopamine with time. Under more basic conditions, production of α,β-dehydrodopamine reached a maximum within 1–5 min after the addition of NaIO4 and disappeared with time as it further transformed into other reaction products. There was a nonstoichiometric conversion of quinone to α,β-dehydrodopamine, resulting from competing reactions that may not have detectable absorbance signatures.57
For pH 8.0, there was a formation of a new peak at 485 nm 15 min after NaIO4 addition, which continued to increase for nearly 24 h (Figure 7). Additionally, there was a pronounced increase in the absorbance at 280 nm over the same time period. These peaks compared favorably with spectra of dicatechol formed through aryloxy radical-mediated phenol coupling of 4-methylcatechol (λmax = 268, 420 nm at pH 3 and λmax = 274, 510 at pH 9).60 For pH 7.4, similar dicatechol peaks were observed, but to a lesser extent in absorbance intensity compared to those found in the spectra at pH 8.0. The absorbance of these peaks were significantly lower for reactions conducted under acidic conditions, indicating that the formation of dicatechol is favored at elevated pH levels.
Figure 7.
UV–vis absorbance for solutions containing 50 μM PEG-D (200 μM dopamine) and 100 μM of NaIO4 buffered at a pH between 5.7 and 8. Spectra were taken 24 h after the addition of NaIO4. The inset enlarges the absorbance between 430 and 550 nm. The absorbance spectrum of 50 μM PEG-D in 10 mM sodium phosphate (pH 5.7) was added for comparison.
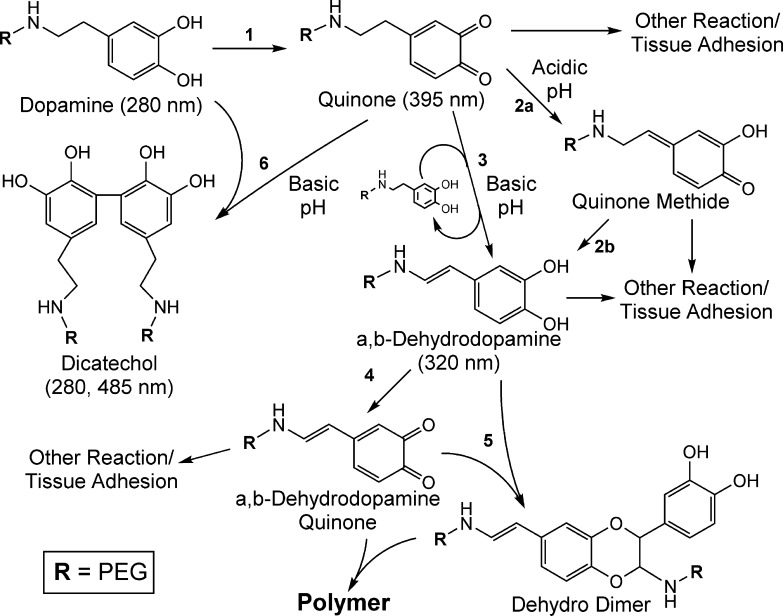
The formation of α,β-dehydrodopamine suggests a cross-linking route resembling insect cuticle sclerotization (reactions 1–5 in Scheme 1). Under mildly acidic conditions (pH = 6), quinone tautomerizes to form quinone methide, which further transforms into α,β-dehydrodopamine (reaction 2).57 Although quinone methide is a highly reactive chemical species, Li and Christensen59 suggested that quinone methide is stabilized under acidic conditions, which likely retarded subsequent reactions. At higher pH (pH = 7–8), quinone transforms directly into α,β-dehydrodopamine involving a charge transfer complex formation with the dopamine catechol (reaction 3).57 This pH-associated difference in the reaction pathway likely contributed to the observed difference in the curing rate of PEG-D. The α,β-dehydrodopamine can be further oxidized to its quinone form through the interaction with dopamine quinone, molecular oxygen, or residual oxidant (e.g., NaIO3; reaction 4). α,β-Dehydrodopamine quinone can further react with α,β-dehydrodopamine to produce the dehydro dimer (reaction 5).61 Abebe et al.62 recently proposed that the dehydro dimer can further react with quinone or quinone methide of α,β-dehydrodopamine, leading to subsequent polymerization. At elevated pH, formation of dicatechol was also observed (reaction 6). Catechol and the oxidized quinone can generate an aryloxy radical which leads to phenol coupling.63 For both reaction pathways (reactions 3 and 6), residual catechol plays an important role in fast cross-linking and elevated degree of polymerization. This is evident from the fact that reduced curing times and M̅c values were found at substoichiometric NaIO4 to dopamine molar ratios. At elevated pH, catechol groups auto-oxidize in the presence of oxygen to quinone, which may explain why hydrogels formed at pH 8.0 had reduced cross-linking densities and mechanical properties as compared to those formed at 7.4. Additionally, at pH 8.0 competing cross-linking mechanisms likely reduced the degree of dopamine polymerization.
Scheme 1. Possible Cross-Linking Pathways of PEG-D.
Dopamine oxidizes to quinone with the addition of NaIO4 (1). Under relatively low pH, quinone tautomerizes to form quinone methide (2a), which further transforms into α,β-dehydrodopamine (2b). At higher pH, quinone transforms into α,β-dehydrodopamine involving charge transfer complex formation with residual dopamine (3). α,β-Dehydrodopamine further oxidizes to its quinone (4), which is capable of reacting with α,β-dehydrodopamine to form the dehydro dimer (5) that can lead to subsequent polymerization. Additionally, generation of an aryloxy radical leads to dicatechol formation at elevated pH (6). Several reactive species (e.g., quinone, quinone methide) are capable of reacting with nucleophilic groups (e.g., −NH2, −SH), resulting in interfacial bond formation with biological substrates.
Formation of interfacial bonds between PEG-D and soft tissues is presumably due to cross-linking of various transient oxidation intermediates (e.g., quinone, quinone methide) with nucleophilic species (e.g., −NH2, −SH) found on tissue substrates.11,12 Quinone forms Michael type and Schiff base adducts with primary amines.60,64 Michael type adducts between quinones and cysteinyl thiol65 and histidinyl imidazole66 side chains have also been detected. Similarly, quinone methide is capable of reacting with water, alcohol, thiols, and acids.67 Under acidic conditions, these nucleophilic groups are protonated (e.g., pKa of ε-lysine ∼ 10), which reduces their ability to form interfacial bonds. Additionally, under mild acidic conditions (pH < 6), hydroxylation of dopamine quinone can occur to form 2,4,5-trihydroxyphenethylamine (topamine) and the corresponding topamine quinone undergoes Michael-type addition with a primary amine at a much slower rate than dopamine quinone.68 Elevated stability of quinone methide under acidic conditions may also contribute to the reduced ability of PEG-D to form interfacial bonds with biological tissues.59
Finally, a quantitative MTT cytotoxicity assay was performed by exposing L929 fibroblast to medium extract of PEG-D hydrogels formulated at different pH levels (Table S3). For all the formulations tested, the viability for fibroblast was greater than 97%, indicating that PEG-D was noncytotoxic and that pH has no effect on its cytocompatibility. The biocompatibility of catechol-containing tissue adhesives with similar compositions (i.e., DOPA-modified PEG) have been previously reported and these biomimetic adhesives were demonstrated to be biocompatible in both in vitro and in vivo experiments.18,53
Collectively, our findings indicated that the pH of the adhesive formulation and tissue substrates plays an important role in the performance of MAP-mimetic bioadhesives. Due to the inert and highly predictable nature of PEG, the observed changes in physical, mechanical, and adhesive properties can be fully attributed to the effect of pH on the cross-linking chemistry of dopamine. More specifically, these changes are attributed to catechol and its methylene spacer, considering that the amide linkage is not implicated in the cross-linking reaction as indicated in Scheme 1. These findings are critical to the synthesis of catechol-containing adhesives as acid and base treatments are commonly used in the removal of the catechol protecting groups or in the purification of these adhesive polymers.32,33 Residual acid or base may alter the pH of the adhesive formulation and compromise its performance, which may be unrelated to the composition of the adhesive. The pH levels of different tissue types also need to be considered given that these biomimetic adhesives have been widely adopted to design adhesive biomaterials for a variety of tissue repair and drug delivery applications.9,17,20 The findings reported here can be utilized to optimize the performances of other polymeric systems containing these adhesive molecules and to fully realize the potential of this unique biomimetic adhesive chemistry.
Conclusion
Our findings indicate that pH plays an important role in the oxidative intermolecular cross-linking of catechol-containing adhesives. Under mild acidic conditions, PEG-D cured at a slower rate as a result of increased stability of transient oxidation intermediates. Additionally, hydrogels that cured at a slower rate were found to have elevated equilibrium water content and reduced mechanical properties, likely due to a lower degree of dopamine polymerization. On the other hand, a fast curing rate was observed at pH 8. However, competing cross-linking reactions and reduced catechol needed for intermolecular cross-linking probably reduced the degree of dopamine polymerization and bulk cohesive properties for these hydrogels. Both bulk cohesive properties and the ability to form strong interfacial bonds were found to be critical for elevated adhesive performance. Adhesives formulated at pH 7.4 demonstrated a good balance of fast curing rate, elevated mechanical properties and interfacial binding ability. Results reported here are particularly relevant in designing bioadhesives for tissue repair and targeted delivery of drugs due to the variable pH levels found in different tissue types and in dysoxic tissues during surgery.
Acknowledgments
This project was supported by National Institutes of Health (GM104846) and Research Excellence Fund – Research Seed Grant (1205015P1) provided by Michigan Technological University (MTU). M.C. was partially supported by the Environmental Protection Agency Greater Research Opportunities Undergraduate Fellowship. A.W. and M.M. were partially supported by MTU Summer Undergraduate Research Fellowship.
Supporting Information Available
Synthesis scheme and 1H NMR spectrum of PEG-D, equilibrium swelling ratio, additional adhesion results, and cytotoxicity data. This material is available free of charge via the Internet at http://pubs.acs.org.
Author Contributions
† These authors contributed equally to this work (M.C. and Y.L.).
The authors declare no competing financial interest.
Funding Statement
National Institutes of Health, United States
Supplementary Material
References
- Schwab R.; Willms A.; Kroger A.; Becker H. P. Hernia 2006, 10, 272–277. [DOI] [PubMed] [Google Scholar]
- Berndsen F. H.; Petersson U.; Arvidsson D.; Leijonmarck C. E.; Rudberg C.; Smedberg S.; Montgomery A. Hernia 2008, 12, 445–446. [DOI] [PubMed] [Google Scholar]
- Koniger J.; Redecke J.; Butters M. Langenbeck. Arch. Surg. 2004, 389, 361–365. [DOI] [PubMed] [Google Scholar]
- Ikada Y. In Wound Closure Biomaterials and Devices; Chu C. C., von Fraunhofer J. A., Greisler H. P., Eds.; CRC Press, Inc.: Boca Raton, FL, 1997; pp 317–346. [Google Scholar]
- Lee B. P.; Dalsin J. L.; Messersmith P. B. In Biological Adhesives; Smith A. M., Callow J. A., Eds.; Springer Berlin Heidelberg: Berlin, Germany, 2006; pp 257–278. [Google Scholar]
- Mehdizadeh M.; Yang J. Macromol. Biosci. 2013, 13, 271–288. [DOI] [PMC free article] [PubMed] [Google Scholar]
- Waite J. H. Int. J. Adhes. Adhes. 1987, 7, 9–14. [Google Scholar]
- Waite J. H. Integr. Comp. Biol. 2002, 42, 1172–1180. [DOI] [PubMed] [Google Scholar]
- Lee B. P.; Messersmith P. B.; Israelachvili J. N.; Waite J. H. Annu. Rev. Mater. Res. 2011, 41, 99–132. [DOI] [PMC free article] [PubMed] [Google Scholar]
- Lee B. P.; Dalsin J. L.; Messersmith P. B. Biomacromolecules 2002, 3, 1038–47. [DOI] [PubMed] [Google Scholar]
- Jenkins C. L.; Meredith H. J.; Wilker J. J. ACS Appl. Mater. Interface 2013, 5, 5091–5096. [DOI] [PubMed] [Google Scholar]
- Guvendiren M.; Brass D. A.; Messersmith P. B.; Shull K. R. J. Adhes. 2009, 86, 631–645. [DOI] [PMC free article] [PubMed] [Google Scholar]
- Lee H.; Scherer N. F.; Messersmith P. B. Proc. Natl. Acad. Sci. U.S.A. 2006, 103, 12999–13003. [DOI] [PMC free article] [PubMed] [Google Scholar]
- Bilic G.; Brubaker C.; Messersmith P. B.; Mallik A. S.; Quinn T. M.; Haller C.; Done E.; Gucciardo L.; Zeisberger S. M.; Zimmermann R.; Deprest J.; Zisch A. H. Am. J. Obstet. Gynecol. 2010, 202, 85.e1–9. [DOI] [PMC free article] [PubMed] [Google Scholar]
- Haller C. M.; Buerzle W.; Kivelio A.; Perrini M.; Brubaker C. E.; Gubeli R. J.; Mallik A. S.; Weber W.; Messersmith P. B.; Mazza E.; Ochsenbein-Koelble N.; Zimmermann R.; Ehrbar M. Acta Biomater. 2012, 8, 4365–70. [DOI] [PubMed] [Google Scholar]
- Brodie M.; Vollenweider L.; Murphy J. L.; Xu F.; Lyman A.; Lew W. D.; Lee B. P. Biomed. Mater. 2011, 6, 015014. [DOI] [PMC free article] [PubMed] [Google Scholar]
- Mehdizadeh M.; Weng H.; Gyawali D.; Tang L.; Yang J. Biomaterials 2012, 33, 7972–83. [DOI] [PMC free article] [PubMed] [Google Scholar]
- Brubaker C. E.; Kissler H.; Wang L.-J.; Kaufman D. B.; Messersmith P. B. Biomaterials 2010, 31, 420–427. [DOI] [PMC free article] [PubMed] [Google Scholar]
- Hong S.; Yang K.; Kang B.; Lee C.; Song I. T.; Byun E.; Park K. I.; Cho S.-W.; Lee H. Adv. Funct. Mater. 2013, 23, 1774–1780. [Google Scholar]
- Kastrup C. J.; Nahrendorf M.; Figueiredo J. L.; Lee H.; Kambhampati S.; Lee T.; Cho S.-W.; Gorbatov R.; Iwamoto Y.; Dang T. T.; Dutta P.; Yeon J. H.; Cheng H.; Pritchard C. D.; Vegas A. J.; Siegel C. D.; MacDougall S.; Okonkwo M.; Thai A.; Stone J. R.; Coury A. J.; Weissleder R.; Langer R.; Anderson D. G. Proc. Natl. Acad. Sci. U.S.A. 2012, 109, 21444–21449. [DOI] [PMC free article] [PubMed] [Google Scholar]
- Waugh A.; Grant A.. Anatomy and Physiology in Health and Illness; Churchill Livingstone Elsevier: New York, 2010. [Google Scholar]
- Soller B. R.; Zhang S.. Proc. SPIE 1998, DOI: 10.1117/12.307318. [DOI] [Google Scholar]
- Ohman H.; Vahlquist A. Acta Derm.-Venereol. 1994, 74, 375–379. [DOI] [PubMed] [Google Scholar]
- Soller B. R.; Micheels R. H.; Coen J.; Parikh B.; Chu L.; Hsi C. J. Clin. Monitor. 1996, 12, 387–395. [DOI] [PubMed] [Google Scholar]
- Helmlinger G.; Yuan F.; Dellian M.; Jain R. K. Nature Med. 1997, 3, 177–182. [DOI] [PubMed] [Google Scholar]
- Tannock I. F.; Rotin D. Cancer Res. 1989, 49, 4373–4384. [PubMed] [Google Scholar]
- Duke T. Arch. Dis. Child. 1999, 81, 343–350. [DOI] [PMC free article] [PubMed] [Google Scholar]
- Sims C.; Seigne P.; Menconi M.; Monarca J.; Barlow C.; Pettit J.; Puyana J. C. J. Trauma: Inj., Infect., Crit. Care 2001, 51, 1137–1145. [DOI] [PubMed] [Google Scholar]
- Soller B. R.; Khan T.; Favreau J.; Hsi C.; Puyana J. C.; Heard S. O. J. Surg. Res. 2003, 114, 195–201. [DOI] [PubMed] [Google Scholar]
- Dunn R. M.; Kaplan I. B.; Mancoll J.; Terzis J. K.; Trengovejones G. Ann. Plast. Surg. 1993, 31, 539–545. [DOI] [PubMed] [Google Scholar]
- Hermansen L.; Osnes J. B. J. Appl. Physiol. 1972, 32, 304–8. [DOI] [PubMed] [Google Scholar]
- Murphy J. L.; Vollenweider L.; Xu F.; Lee B. P. Biomacromolecules 2010, 11, 2976–84. [DOI] [PMC free article] [PubMed] [Google Scholar]
- Yu M.; Deming T. J. Macromolecules 1998, 31, 4739–45. [DOI] [PubMed] [Google Scholar]
- Yu J.; Wei W.; Menyo M. S.; Masic A.; Waite J. H.; Israelachvili J. N. Biomacromolecules 2013, 14, 1072–1077. [DOI] [PMC free article] [PubMed] [Google Scholar]
- Holten-Andersen N.; Harrington M. J.; Birkedal H.; Lee B. P.; Messersmith P. B.; Lee K. Y. C.; Waite J. H. Proc. Natl. Acad. Sci. USA 2011, 15, 2651–2655. [DOI] [PMC free article] [PubMed] [Google Scholar]
- Lee B. P.; Konst S. Adv. Mater. 2014, 26, 3415–3419. [DOI] [PubMed] [Google Scholar]
- Lee B. P.; Liu Y.; Konst S.. MRS Proc. 2014, 1710, mrss14-1710-XX08-01. [Google Scholar]
- Shafiq Z.; Cui J.; Pastor-Pérez L.; San Miguel V.; Gropeanu R. A.; Serrano C.; del Campo A. Angew. Chem., Int. Ed. 2012, 51, 4332–4335. [DOI] [PubMed] [Google Scholar]
- Krogsgaard M.; Behrens M. A.; Pedersen J. S.; Birkedal H. Biomacromolecules 2013, 14, 297–301. [DOI] [PubMed] [Google Scholar]
- White E. M.; Seppala J. E.; Rushworth P. M.; Ritchie B. W.; Sharma S.; Locklin J. Macromolecules 2013, 46, 8882–8887. [Google Scholar]
- Peppas N. A.; Merrill E. W. J. Polym. Sci.: Polym. Chem. Ed. 1976, 14, 441–457. [Google Scholar]
- Andreopoulos F. M.; Beckman E. J.; Russell A. J. Biomaterials 1998, 19, 1343–52. [DOI] [PubMed] [Google Scholar]
- Spegt P. A.; Terrisse J.; Gilg B.; Skoulios A. Makromol. Chem. 1967, 104, 212–229. [Google Scholar]
- Merrill E. W.; Dennison K. A.; Sung C. Biomaterials 1993, 14, 1117–1126. [DOI] [PubMed] [Google Scholar]
- Skelton S.; Bostwick M.; O’Connor K.; Konst S.; Casey S.; Lee B. P. Soft Matter 2013, 9, 3825–3833. [Google Scholar]
- Liu Y.; Zhan H.; Skelton S.; Lee B. P.. MRS Proc. 2013, 1569, mrss13-1569-LL05-09. [Google Scholar]
- Rzepecki L. M.; Waite J. H. Anal. Bioch. 1989, 179, 375–381. [DOI] [PubMed] [Google Scholar]
- Rzepecki L. M.; Nagafuchi T.; Waite J. H. Arch. Biochem. Biophys. 1991, 285, 17–26. [DOI] [PubMed] [Google Scholar]
- Huebsch N.; Gilbert M.; Healy K. E. J. Biomed. Mater. Res., Part B: Appl. Biomater. 2005, 74B, 440–447. [DOI] [PubMed] [Google Scholar]
- Kerby R. E.; Tiba A.; Culbertson B. M.; Schricker S.; Knobloch L. J. Macromol. Sci., Part A 1999, 36, 1227–1239. [Google Scholar]
- Spotnitz W. D.; Burks S. Transfusion 2008, 48, 1502–1516. [DOI] [PubMed] [Google Scholar]
- Lee G.; Lee C. K.; Bynevelt M. Spine 2010, 35, E1522–E1524. [DOI] [PubMed] [Google Scholar]
- Brubaker C. E.; Messersmith P. B. Biomacromolecules 2011, 12, 4326–34. [DOI] [PMC free article] [PubMed] [Google Scholar]
- Anseth K. S.; Bowman C. N.; Brannon-Peppas L. Biomaterials 1996, 17, 1647–57. [DOI] [PubMed] [Google Scholar]
- Peppas N. A.; Bures P.; Leobandung W.; Ichikawa H. Eur. J. Pharm. Biopharm. 2000, 50, 27–46. [DOI] [PubMed] [Google Scholar]
- da Silva L. F. M.; Rodrigues T. N. S. S.; Figueiredo M. A. V.; de Moura M. F. S. F.; Chousal J. A. G. J. Adhes. 2006, 82, 1091–1115. [Google Scholar]
- Rzepecki L. M.; Waite J. H. Arch. Biochem. Biophys. 1991, 285, 27–36. [DOI] [PubMed] [Google Scholar]
- Waite J. H. Anal. Chem. 1984, 56, 1935–1939. [Google Scholar]
- Li J.; Christensen B. M. J. Electroanal. Chem. 1994, 375, 219–231. [Google Scholar]
- Andersen S. O.; Jacobsen J. P.; Bojesen G.; Roepstorff P. Biochim. Biophys. Acta 1992, 1118, 134–8. [DOI] [PubMed] [Google Scholar]
- Sugumaran M.; Semensi V.; Kalyanaraman B.; Bruce J. M.; Land E. J. J. Biol. Chem. 1992, 267, 10355–61. [PubMed] [Google Scholar]
- Abebe A.; Zheng D.; Evans J.; Sugumaran M. Insect Biochem. Mol. Biol. 2010, 40, 650–659. [DOI] [PubMed] [Google Scholar]
- McDowell L. M.; Burzio L. A.; Waite J. H.; Schaefer J. J. Biol. Chem. 1999, 274, 20293–5. [DOI] [PubMed] [Google Scholar]
- Waite J. Comp. Biochem. Physiol., Part B: Biochem. Mol. Biol. 1990, 97B, 19. [DOI] [PubMed] [Google Scholar]
- Sugumaran M. Adv. Insect Physiol. 1998, 27, 230–334. [Google Scholar]
- Merritt M. E.; Christensen A. M.; Kramer K. J.; Hopkins T. L.; Schaefer J. J. Am. Chem. Soc. 1996, 118, 11278–11282. [Google Scholar]
- Wagner H. U.; Gompper R. Chem. Quinonoid Compd. 1974, Pt. 2, 1145–78. [Google Scholar]
- Garciamoreno M.; Rodriguezlopez J. N.; Martinezortiz F.; Tudela J.; Varon R.; Garciacanovas F. Arch. Biochem. Biophys. 1991, 288, 427–434. [DOI] [PubMed] [Google Scholar]
Associated Data
This section collects any data citations, data availability statements, or supplementary materials included in this article.


