

Abstract
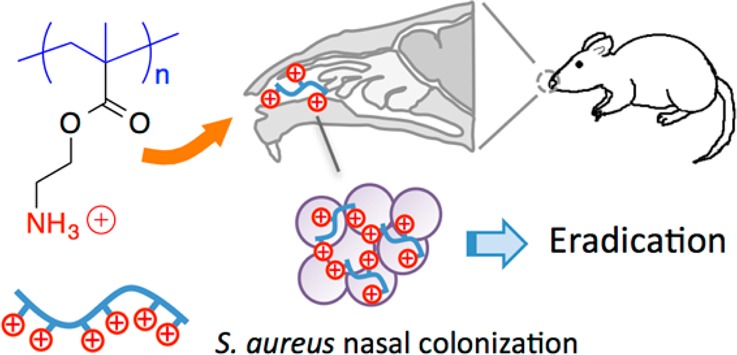
The in vitro and in vivo antimicrobial activity of primary ammonium ethyl methacrylate homopolymers (AEMPs) was investigated. AEMPs with different degrees of polymerization (DP = 7.7–12) were prepared by reversible addition–fragmentation chain-transfer (RAFT) polymerization. The AEMPs showed higher inhibitory effects against Gram-positive bacteria, including methicillin-resistant Staphylococcus aureus (MRSA), than Gram-negative bacteria. The AEMPs also showed potent anti-S. aureus activity in the presence of fetal bovine serum, whereas the activity of the antibiotic mupirocin was reduced under the same conditions. The AEMPs showed very little or no hemolytic activity. The cytotoxicity of AEMPs against mammalian cells HEp-2 and COS-7 was concentration-dependent, and the cell viability significantly decreased at higher polymer concentrations. The AEMPs significantly reduced the number of viable S. aureus cells in the nasal environment of cotton rats when compared to that of the control. This study demonstrates that AEMPs have potential for use in treating topical S. aureus infections.
Introduction
There is an urgent need for new antimicrobials due to the increasing number of drug-resistant bacterial infections worldwide.1−4 To that end, synthetic polymers have been widely investigated as a new molecular platform to create antimicrobial agents that are active against drug-resistant bacteria.5−8 A variety of synthetic polymers with different backbones have been utilized to prepare antimicrobial polymers, and some polymers with high efficacy have been reported.9−13 We have previously demonstrated the antimicrobial activity of cationic amphiphilic methacrylate random copolymers, which act by disrupting bacterial cell membranes, mimicking the mode of action of naturally occurring host-defense peptides.14 These polymers have shown potent activity against a broad spectrum of bacteria and low propensity for resistance development in bacteria.15 The cationic groups of these amphiphilic methacrylate copolymers preferentially bind to the higher net negative charge of bacterial cell surfaces over human cells, resulting in selective activity to bacterial over human cells. These antimicrobial copolymers are potential candidates for therapeutic treatment of antibiotic-resistant bacterial infections. However, these copolymers exhibit a broad spectrum of activity, which may negatively impact commensal bacterial flora, especially when used for long-term treatment. It would be ideal to develop antimicrobial polymers with cell selectivity or specificity to bacterial strains that can avoid side effects to commensal flora. Antimicrobial polymers with activity to specific bacteria will complement the treatment of infections by already developed broad-spectrum antimicrobial polymers.
To that end, we have previously demonstrated that conventional cationic polymers unmodified branched poly(ethylene imine)s (BPEIs) showed potent antimicrobial activity against S. aureus, but they did not show any significant activity against E. coli.16 Furthermore, the BPEIs are not hemolytic against human red blood cells (RBCs). The BPEIs do not cause membrane permeabilization, indicating that membrane disruption is not the primary mechanism of antimicrobial action. In the literature, other cationic synthetic oligomers and polymers, such as polynorbornenes17,18 and oligo-lysines,19 have also shown selective activity against S. aureus. Similar to that of BPEIs, cationic natural polysaccharide chitosan showed potent antimicrobial activity against S. aureus without inducing significant membrane disruption.20 The chemical structures of these polymers are diverse, but the cationic charge is common among them. This may suggest that the cationic functionality is a key determinant in their antimicrobial activity and selectivity to S. aureus.
In this study, we investigate the in vitro and in vivo antimicrobial activity of cationic synthetic polymers as a potential cell-selective antimicrobial agent against S. aureus. We are particularly interested in S. aureus as a target bacteria because cationic polymers such as PEIs previously showed selective activity to S. aureus, as described above, and because S. aureus is one of the most common causes of nosocomial and community-acquired infections.21,22 In order to probe into the role of cationic functionality in the antimicrobial mechanism of polymers, we have designed a series of ammonium ethyl methacrylate homopolymers (AEMPs) with a varying number of primary ammonium groups in the side chains rather than random copolymers with both cationic and hydrophobic side chains, which have been shown to exert their antimicrobial effect by disrupting bacterial cell membranes. This series of AEMPs serves as a simple model to investigate why the cationic polymers display selective activity to S. aureus and to determine if this is a previously uncharacterized mode of antimicrobial action of polymers.
The purposes of this study are to evaluate the in vitro efficacy of AEMPs as anti-S. aureus agents as well as to assess the feasibility and effectiveness of these AEMPs for the treatment of S. aureus nasal colonization. We particularly targeted the treatment of S. aureus in nasal colonization because nasal passages have proven to be a prime environment for S. aureus colonization and play an important role in S. aureus infection.23,24 In this study, the spectrum of activity and bactericidal kinetics of the AEMPs were examined. To assess the activity of AEMPs under physiological conditions, their antimicrobial activity in the presence of serum was also determined. The propensity for resistance development in S. aureus was evaluated by exposing bacteria to an AEMP at a subinhibitory concentration. To evaluate the cytotoxicity of AEMPs, cell viability of mammalian HEp-2 and COS-7 cells was determined in the presence of AEMPs using an XTT assay. Finally, the AEMPs were tested for their in vivo activity against S. aureus nasal colonization in a cotton rat model.
Materials and Methods
Materials
2,2′-Azobis(isobutyronitrile) (AIBN) was purchased from Sigma-Aldrich, and ethanolamine and di-tert-butyldicarbonate were purchased from Acros and used without further purification. Methacryloyl chloride was purchased from Acros and was freshly distilled prior to each use. Trifluoroacetic acid and reagent grade solvents were purchased from Fisher, and the bee venom toxin melittin (>85%) was purchased from Sigma. Poly(ethylene glycol) (PEG, MW = 2000, cat. 81221, lot 1237799 14006162) was purchased from Sigma-Aldrich, and branched PEI (BPEI, MW = 1800, cat. 06089, lot 559792) was purchased from Polysciences, Inc. (Warrington, PA, USA). Human RBCs (leukocytes reduced adenine saline added) were obtained from the American Red Cross Blood Services Southeastern Michigan Region and used prior to the out date indicated on each unit. Heat-inactivated fetal bovine serum (HI FBS), certified and of US origin (cat 10082-147, lot 1382252) was purchased from Life Technologies (Gibco). RAFT agent 2-cyanoprop-2-yl ethyl trithiocarbonate (CPETC) was synthesized as previously described.25 For cytotoxicity testing, HEp-2 (ATCC CCL-23) and COS-7 (ATCC CRL-1651) cell lines were used. Gel permeation chromatography (GPC) was performed using a Waters 1515 HPLC instrument equipped with Waters Styragel (7.8 × 300 mm) THF HR 0.5, THF HR 1, and THF HR 4 type columns in sequence and analyzed with a differential refractometer (RI) at 40 °C in THF. Samples were dissolved in THF and passed through a 0.2 μm PTFE filter prior to analysis. The number-averaged molecular weight (Mn) and weight-average molecular weight (Mw) were calculated using a calibration curve based on 10 standard samples of poly(methyl methacrylate), MW 500–50 000 (Agilent Technologies, M-L-10, no. PL2020-0100). 1H NMR was performed using a Varian MR400 (400 MHz) and analyzed using VNMRJ 3.2 and MestReNova.
Monomer Synthesis
The monomer was prepared using the same procedure reported previously.14 To a solution of ethanolamine (116 mmol, 7 mL) in a biphasic mixture of THF (150 mL) and NaOH(aq) (5M, 30 mL) in an ice bath was added di-tert-butyldicarbonate (118 mmol, 25.67 g), and the mixture was stirred at room temperature overnight. The solution was concentrated under reduced pressure, and the resulting N-Boc ethanol amine was washed with ethyl acetate, 10% citric acid, saturated NaHCO3(aq), and brine. The organic layer was dried over magnesium sulfate and filtered. Ethyl acetate was removed under reduced pressure. 1H NMR (400 MHz, CDCl3): δ 1.367 (s, 9 H), 3.182 (t, 2H), 3.587 (t, 2H), 5.287 (bs, 1H).
Freshly distilled methacryloyl chloride (51.2 mmol, 5.0 mL) in dichloromethane (20 mL) was added dropwise to a solution of the N-Boc-ethanolamine (44.8 mmol, 7.22 g) and triethylamine (89.7 mmol, 12.5 mL) in dichloromethane (50 mL) at 0 °C, and the mixture was allowed to stir overnight at room temperature. The solution was then filtered, and the filtrate was concentrated under reduced pressure and washed with water, 10% citric acid, 10% K2CO3, saturated NaHCO3(aq), and brine. The organic layer was dried over magnesium sulfate and filtered. The monomer 2-(tert-butoxycarbonylamino)ethyl methacrylate, was recrystallized from hexanes at −20 °C to give a white solid in 70.3% yield. 1H NMR (400 MHz, CDCl3): δ 1.44 (s, 9 H), 1.94 (s, 3 H), 3.43 (d, 2 H), 4.20 (t, 2 H), 4.77 (bs, 1H), 5.58 (s, 1 H), 6.12 (s, 1 H).
Polymer Synthesis
Reversible addition–fragmentation chain transfer (RAFT) polymerization of N-(tert-butoxycarbonyl)aminoethyl methacrylate (Boc-AEMA) was carried out using the RAFT agent 2-cyanoprop-2-yl ethyl trithiocarbonate (CPETC). Boc-AEMA (1.1947 g, 5.211 mmol) and AIBN (8.6 mg, 0.05211 mmol) were placed in a 20 mL flask. After evacuating and refilling the flask with nitrogen three times, dry toluene (total toluene volume 7.526 mL, including CPETC solution) and dry acetonitrile (5.211 mmol, 0.272 mL) were added to maintain a monomer concentration of 0.67 M. The mixture was stirred at room temperature until contents were dissolved. Finally, CPETC (0.5 M in toluene) was added at 22, 10, or 3 mol % relative monomer (2.3, 1.05, 0.3 mL, respectively). The reaction flask was then placed in oil bath at 80 °C for 48 h with stirring. After 48 h, the polymerization was quenched by cooling the reaction mixtures in a dry ice/ethanol bath. The percent conversion of monomer was determined by 1H NMR by monitoring the disappearance of the hydrogen at δ 6.1 and 5.6 ppm in CDCl3. The polymerization was concentrated under reduced pressure, and the polymer was then precipitated twice in hexane. The precipitates were collected by centrifugation and dried under high vacuum overnight to give Boc-protected AEMPs (1 g, yield 83%). Boc-protected polymers were characterized by 1H NMR and GPC. 1H NMR (400 MHz, DMSO-d6) for Boc-P9.9: δ 0.85 (d), 1.16 (s), 1.19 (s), 1.31 (bs), 1.62 (bs), 1.80 (m), 3.17 (bs), 3.85 (bs), 6.81 (bs). See the Supporting Information, or Figure 3, for peak assignments.
Figure 3.

1H NMR spectrum (400 MHz, DMSO-d6) of Boc-P9.9.
The Boc-protected polymers (1 g) were dissolved in methanol (0.5 mL). TFA (3 mL) was added to the polymer solution, and the reaction mixture was stirred at room temperature for 10 min. TFA and methanol was reduced by N2 flushing, and the polymers were twice precipitated from methanol into diethyl ether. The precipitates were collected by centrifugation and dried under high vacuum. The resultant polymers were further dissolved in water (∼10 mL) and frozen in a freezer (0 °C) for at least 3 h and a −80 °C freezer overnight. These polymers were then lyophilized under high vacuum using Labconco’s FreeZone 1 liter benchtop freeze-dry system (model 7740021) overnight, affording a powder of homopolymers bearing primary ammonium groups in the form of trifluoroacetate salts (0.750, yield 59%). The polymers were characterized by 1H NMR. 1H NMR (400 MHz, DMSO-d6) for P7.7: δ 0.85 (d), 1.16 (s), 1.25 (s), 1.63 (bs), 1.91 (m), 3.12 (bs), 4.07 (bs), 8.27 (bs). See the Supporting Information for NMR spectra and peak assignments.
Antimicrobial Assay
The minimum inhibitory concentration (MIC) of polymers was determined by a turbidity-based microdilution assay according to a procedure reported previously.14 Assays were performed in Müller–Hinton (MH) broth for all bacteria. Escherichia coli (ATCC 25922), Staphylococcus aureus (ATCC 25923), Enterococcus faecalis (ATCC 29212), Pseudomonas aeruginosa (ATCC 27853), Staphylococcus saprohyticus strain 710826, Bacillus subtilis (ATCC 6633), Acinetobacter baumannii (ATCC 17978), S. aureus strain LAC (MRSA USA300-0114),26 and S. aureus strain BB214627 were used. Each polymer was dissolved in DMSO, and this DMSO solution was diluted by 0.01% acetic acid to give 2-fold serial dilutions. An overnight bacterial culture was prepared by taking 2 to 3 bacterial colonies from a Petri dish and placing them into 7 mL of MHB with shaking at 37 °C. After overnight growth, the bacterial culture was diluted by MH broth (OD600 = 0.1) and incubated at 37 °C until the bacteria reached the mid log growth phase, OD600 = 0.5–0.6 (1.5–4.5 h, depending on the bacterial strain). The bacteria cultures in the mid log growth phase were diluted to a final concentration of OD600 = 0.001, which contains approximately 5 × 10⁵ cfu/mL. This stock (90 μL) was mixed with a polymer solution (10 μL) in a 96-well polypropylene microplate (Corning no. 3359). After incubating for 18 h at 37 °C, the plate was examined visually to determine bacterial growth as the formation of bacterial palettes or increases in solution turbidity. The MIC was defined as the lowest polymer concentration at which no turbidity increase was observed for at least 2 out of 3 wells relative to the negative control (broth). As an additional negative control, 2-fold serial dilutions of DMSO, without polymer, were tested under the same conditions and showed no inhibitory effects, even at the highest DMSO concentration (10%). All assays were performed in triplicate for at least three independent experiments. The polymers in MH broth without bacteria did not show any precipitation, as their solubility was determined to be >1000 μg/mL.
Antimicrobial Assay in Fetal Bovine Serum
The MIC of the AEMPs in the presence of fetal bovine serum (FBS) was determined as described above with modifications. Bacteria were grown overnight and diluted and regrown in MH broth at 37 °C until the bacteria reached the mid log growth phase. The bacteria cultures in the mid log growth phase were diluted to a final concentration of OD600 = 0.00225. This stock (40 μL) was mixed with a polymer solution diluted in 0.01% acetic acid as for MIC (10 μL) and FBS or PBS (50 μL, 50% of total volume) and bacteria in MHB (40 μL, OD600 0.00225) in a 96-well polypropylene microplate. After incubating for 18 h at 37 °C, the plate was examined visually to determine bacterial growth as the formation of bacterial palettes or increases in solution turbidity. MIC was determined as described above.
Hemolytic Assay
Toxicity to human red blood cells (RBCs) was assessed by a hemoglobin release assay. RBCs (1 mL) were diluted into PBS (9 mL) and then centrifuged at 2000 rpm for 5 min. The supernatant was carefully removed using a pipet. This procedure was repeated two additional times. The resulting stock (10% v/v RBC) was diluted 100× in PBS, and the number of red blood cells was counted using a hemocytometer. The original stock (10% v/v) was then diluted to 1.11 × 10⁸ RBC/mL with PBS. This RBC suspension (90 μL) was then mixed with each of the polymer serial dilutions (10 μL) on a sterile 96-well round-bottomed polypropylene microplate (RBC concentration on plate is 1.0 × 10⁸ RBC/mL). PBS (10 μL) or Triton X-100 (10 μL, 1% v/v) was added instead of polymer solution as negative and positive hemolysis controls, respectively. The microplate was incubated at 37 °C in an orbital shaker at 180 rpm for 60 min. The plate was then centrifuged at 1000 rpm for 5 min. The supernatant (6 μL) was diluted into PBS (110 μL) in a 96-well flat-bottomed polystyrene microplate (Corning no. 3370), and the absorbance at 405 nm was recorded using a microplate reader (PerkinElmer Lambda Reader). The fraction of hemolysis was defined as H = (A – A0)/(ATX – A0), where A is the absorbance reading of the sample well, A0 is the negative hemolysis control (PBS buffer), and ATX is the positive hemolysis control (Triton X-100). Hemolysis was plotted as a function of polymer concentration, and the HC50 was defined as the polymer concentration that causes 50% hemolysis relative to that of the positive control. The data were obtained in at least three experiments performed in triplicate.
Bacterial Kinetics
Bactericidal kinetics was determined by inoculation of the polymers with bacteria in MH broth and colony counting on agar plates. An overnight culture of S. aureus ATCC 25923 was regrown to the exponential growth phase (OD600 of 0.5 to 0.6) and diluted to an OD600 0.001 to give 8 mL of bacterial solution in a 15 mL centrifugation tube. To this solution was added the polymer solution to a final concentration of two times the MIC value of each polymer. The tubes were incubated at 37 °C in an orbital shaker at 180 rpm, and aliquots of solution (100 μL) were drawn at appropriate time intervals. After dilution by 105, 104, 103, 102, or 10-fold into PBS buffer, the dilutions were streaked onto agar plates and incubated at 37 °C overnight. The colonies were then counted to determine the number of viable cells as colony-forming unit (cfu)/mL in the polymer solution. The data and errors are the average and SD of two experiments, each performed in duplicate (n = 4).
Bacterial Resistance.15
The first MIC determination of AEMPs and two antibiotics, norfloxacin and mupirocin, against S. aureus ATCC 25923 was performed as described above. Bacteria samples from triplicate wells (60 μL) at the concentration of one-half the MIC were removed, combined, and added to fresh MH broth (1.5 mL). The bacterial culture was regrown at 37 °C to the mid log growth phase (OD600 = 0.5–0.6). This culture was used to determine the MIC values of polymers again as described above. This experiment was repeated for 14 successive passages. This was repeated for a total of two resistance experiments.
Cell Culture
Cytotoxicity experiments were carried out using the HEp-2 and COS-7 cell lines. HEp-2 cells are human epithelial cells isolated from larynx carcinoma. It should be noted that the HEp-2 cell line is contaminated with HeLa cells derived from cervical cancer. HEp-2 cells were grown in antibiotic-free minimum essential medium (MEM) supplemented with 10% heat-inactivated fetal bovine serum (HI FBS), pyruvate (1 mM), and nonessential amino acids (0.1 mM) at 37 °C, 5% CO2, and 95% relative humidity. The doubling time of the HEp-2 cells in this supplemented medium is about 22–24 h. COS-7 cells are fibroblast-like cells derived from monkey kidney tissue. COS-7 cells were grown in antibiotic-free Dulbecco’s modified Eagle medium (DMEM) supplemented with 10% HI FBS, high glucose (25 mM), l-glutamine (4 mM), sodium pyruvate (1 mM) at 37 °C, 5% CO2, and 95% relative humidity. The doubling time of the COS-7 cells in this supplemented medium is about 35–48 h.
XTT Cell Viability Assay
HEp-2 or COS-7 cells were seeded into the 96-well cell culture plates (Falcon no. 3072) at a density of 1 × 10⁴ cells per well. After 20 h incubation for HEp-2 cells, 24 h for COS-7 cells, the cell confluence was about 50–60%, and the cell culture medium was replaced with serial dilutions of polymer stock solutions in a fresh growth medium. The viability of cells exposed to the polymers was assessed using a commercial kit (Cell Proliferation Kit II, Roche). After a 24 h exposure to polymers, the cells were washed once with PBS, and then PBS (100 μL) was added to each well. A solution of sodium 3′-[1-(phenylaminocarbonyl)-3,4-tetrazolium]-bis(4-methoxy-6-nitro) benzenesulfonic acid hydrate (XTT) and an electron-coupling reagent N-methyl dibenzopyrazine methyl sulfate (PMS) were added to each well to give the final concentration of 0.2 mg/mL and 1.5 μg/mL, respectively. To assess the effect of polymers on the conversion of substrate, control wells containing only PBS and XTT with PMS were included. After a 4 h incubation for HEp-2 cells or 6 h incubation for COS-7 cells at 37 °C in the presence of 5% CO2, the formation of orange-colored formazan derivative produced by the metabolic cellular activity was determined by the absorbance at 450 nm (test wavelength) and 650 nm (background wavelength). The spectrophotometer was calibrated to zero absorbance using PBS without cells. The cell viability was determined relative to that of a control containing intact cells, which were exposed only to solvent. The data are means and standard errors of three independent experiments performed in triplicate (n = 9).
In Vivo Animal Testing
The cotton rat nasal colonization model described by Kokai-Kun was utilized to determine the ability of polymers to decolonize S. aureus from the nasal environment.27,28 Nontransgenic cotton rats (strain Hsd) were purchased from Harlen Laboratories. The protocol was approved by the Committee on Use and Care of Animals (UCUCA) of the University of Michigan (permit no. 10394). S. aureus (strain BB2146)27 was grown overnight in TSB, harvested by centrifugation, washed, and resuspended in phosphate buffered saline (PBS). Cotton rats (3–5 for each condition) were anesthetized, and a 10 μL aliquot containing 1 × 10⁸ colony forming units (CFUs) was intranasally instilled dropwise equally between the two nostrils. After 3 days, the animals were intranasally treated with an AEMP (P7.7 or P10) at 125 μg/mL or mupirocin at 400 μg/mL (MIC = 0.2 μg/mL). Three days later the animals were sacrificed, the noses were surgically removed, and S. aureus CFUs were determined. As a negative control, animals were exposed to PBS without polymer. Mupirocin was used as a benchmark for effective decolonization. The experiments for P7.7 and P10 were performed independently along with mupirocin and PBS controls, and the data for these controls were combined and used for statistical analysis.
Statistical Analyses
Statistics were performed using Student’s t test. Results are expressed as mean ± SD, unless otherwise indicated.
Results and Discussion
Polymer Synthesis and Characterization
Boc-protected amino ethyl methacrylate homopolymers (Boc-P series) were prepared by RAFT polymerization of Boc-protected aminoethyl methacrylate (AEMA) using 2-cyanoprop-2-yl ethyl trithiocarbonate (CPETC) as a chain transfer agent (Figure 1). The protection of amine groups facilitates the polymer synthesis in organic solvents as well as avoids undesired aminolysis of the RAFT agent and intermolecular amide formation with the ester groups in the monomer. The polymerization proceeded at 80 °C and was quenched by cooling in a dry ice/ethanol bath after 48 h. 1H NMR spectra of the crude polymerization mixture indicated at least a 96% conversion of monomer for each polymerization. The resulting Boc-protected polymers were purified by precipitation into hexane.
Figure 1.

Synthesis of ammonium ethyl methacrylate homopolymers (AEMPs).
GPC analysis of these Boc-protected AEMPs indicated that the polydispersity index (Mw/Mn) is ∼1.3 (Figure 2 and Table 1). The degree of polymerization (DP) was determined by comparing the integrated intensities of the 1H NMR resonances from the terminal RAFT agent group relative to that of the monomer side chain (Figure 3). AEMPs were synthesized with different DPs by varying the ratio of RAFT agent to monomers. The Boc groups of the polymers were removed by treating the polymers with trifluoroacetic acid (TFA) to give AEMPs with primary ammonium groups, indicated as the disappearance of the peak at 1.5 ppm in the NMR spectrum (Supporting Information). The DP values of deprotected polymers (P series) were in the range of 7.7–12, which represents the average number of ammonium groups in a polymer. The integrated intensities of the methyl groups at the α-end slightly decreased from 3.8 to 2.6 for P7.7, for example, relative to the six protons of methyl groups at the ω-end after the deprotection procedure (Supporting Information). This could be attributed to partial decomposition of the trithioester end groups because of low stability of the RAFT agent CPETC under the acidic conditions (see the Supporting Information for decomposition of CPETC in TFA). Because of the decomposition of the RAFT agent, the DPs are calculated on the basis of the signals from the α-terminal group. Accordingly, the AEMPs will be identified as Px where x is the DP of polymers.
Figure 2.

GPC Trace (Waters GPC, RI Detector, THF eluent) of Boc-protected polymers.
Table 1. Synthesis and Characterization of AEMPs.
| Boc-protected
polymer |
deprotected
polymer |
|||||||||
|---|---|---|---|---|---|---|---|---|---|---|
| Boc-P | CPETCa (%) | conv.b (%) | Mn, GPCc | Mw, GPCc | Đd | DPe | Mn, NMRf | P | DPe | Mn, NMRf,g |
| Boc-P9.9 | 22 | 97 | 3300 | 4300 | 1.32 | 9.9 | 2500 | P7.7 | 7.7 | 1200 (2100) |
| Boc-P11 | 10 | 96 | 5100 | 6700 | 1.31 | 11 | 2800 | P10 | 10 | 1600 (2700) |
| Boc-P19 | 3 | 97 | 9800 | 13 000 | 1.35 | 19 | 4600 | P12 | 12 | 1800 (3200) |
Mole percentage of CPETC relative to the total amount of monomer in polymerization.
Monomer conversion was determined by comparing the integrations of peaks from vinyl groups and monomer side chains in 1H NMR spectra.
The number- and weight-average molecular weight (Mn and Mw) were determined by GPC using THF. The molecular weight calibration was based on poly(methyl methacrylate) standards.
Polydispersity index is calculated as Mw/ Mn using Mw and Mn values determined by GPC.
The degree of polymerization (DP) was determined by comparing the integrated intensity of the 1H NMR resonances from the α-terminal methyl groups (j) relative to that of the side chain (c).
The number-average molecular weights (Mn) were calculated using DP and the molecular weights of monomer and CPETC based on the chemical structure of polymers.
The number-average molecular weight (Mn) of deprotected polymers without trifluoroacetate. Mn of polymers including trifluoracetate are presented in parentheses.
Antimicrobial Activity
The AEMPs were tested for their antimicrobial activity against a panel of clinically relevant bacterial pathogens. The antimicrobial activity of the AEMPs was quantified as the MIC at which bacterial growth is completely inhibited after an 18 h incubation (Table 2 and Figure 4). The MIC was determined using a turbidity-based microdilution method.29 In general, the MIC values of AEMPs against Gram-positive bacteria tested in this study are smaller than those against Gram-negative bacteria. This indicates that the AEMPs were more effective at inhibiting the growth of Gram-positive bacteria when compared to the Gram-negative bacteria tested. The AEMPs are also active against community-acquired methicillin-resistant S. aureus (CA-MRSA), with similar MIC values of AEMPs against the susceptible S. aureus strain.
Table 2. Antimicrobial Spectrum of AEMPs and Antibiotics.
| MICa (μg/mL) (or
μM) |
|||||||
|---|---|---|---|---|---|---|---|
| bacteria | Gram | P7.7 | P10 | P12 | norfloxacin | mupirocin | vancomycin |
| S. aureus ATCC 25923 | + | 94 (45) | 73 (27) | 63 (20) | 1.0 (3.1) | 0.25 (0.5) | 1.3 (0.9) |
| S. aureus BB2146 | + | 63 (30) | 63 (23) | 42 (13) | 1.1 (3.3) | 0.2 (0.4) | n.d. |
| S. aureus LAC (CA-MRSA)b | + | 125 (60) | 83 (31) | 63 (20) | >8 (>25) | 0.25 (0.5) | 1.3 (0.9) |
| S. saprohyticus | + | 16 (7.4) | 16 (5.8) | 16 (5) | 0.83 (2.6) | 0.13 (0.2) | 1.3 (0.9) |
| B. subtilis | + | 83 (40) | 63 (23) | 63 (20) | 1.0 (3.1) | >8 (>16) | 1.8 (1.3) |
| E. faecalis | + | 156 (74) | 94 (34) | 78 (24) | 1.5 (4.7) | n.d. | 1.8 (1.3) |
| E. coli | – | >1000 (>476) | 1000 (370) | 313 (98) | n.d. | >40 (>80) | >40 (>28) |
| A. baumannii | – | 417 (198) | 670 (247) | 250 (78) | 1.3 (4.2) | >8 (>16) | >8 (>5.5) |
| P. aeruginosa | – | 1000 (476) | 50 (185) | 250 (78) | 0.83 (2.6) | >8 (>16) | >8 (>5.5) |
The MIC in micromolar is presented in parentheses, using Mn with trifluoroacetate.
Community-associated methicillin-resistant S. aureus
Figure 4.

Minimum inhibitory concentration (MIC) of AEMPs for selected Gram-positive and -negative bacteria.
The number of ammonium groups in a polymer chain, or DP of AEMPs, did not appear to have a large influence on an AEMP’s activity against any of the Gram-positive bacterial strains tested, as the MICs for all AEMPs tested for a particular bacterium are within a 2-fold dilution. On the other hand, the MIC values of AEMPs against E. coli and P. aeruginosa decreased as the DP of AEMPs increased, indicating the AEMPs with higher DPs are more active against these bacteria. However, the MIC values of AEMPs against A. baumannii do not appear to depend on the DP of AEMPs. The general trend of AEMPs for lower activity toward Gram-negative bacteria may be, at least in part, due to the inability of AEMPs to penetrate the outer membrane of Gram-negative bacteria, preventing AEMP access to the cell wall and cytoplasmic membranes, although the antimicrobial target of AEMPs in bacteria is not clear at this point.
Antimicrobial Mechanism
We have previously demonstrated that conventional cationic polymers of unmodified BPEIs showed potent antimicrobial activity against S. aureus without causing significant membrane permeabilization, indicating that membrane disruption is not likely the primary mechanism of antimicrobial action.16 To elucidate the antimicrobial mechanism and bacterial targets of AEMPs, we attempted to determine membrane permeabilization by the AEMPs using a membrane-potential sensitive fluorophore DISC3(5).16,19,30 This fluorophore binds to intact S. aureus cytoplasmic membranes and undergoes self-quenching. When the membrane is permeabilized through interaction with the polymers, the self-quenching of DISC3(5) is alleviated, and the fluorescence is recovered. Because the AEMPs did not cause any significant fluorescence recovery, it appears that the AEMPs do not permeabilize the S. aureus membranes. However, we found that the AEMPs cause strong quenching of DISC3(5) fluorescence in solution (see the Supporting Information for the assay protocol, results, and fluorescence quenching). The lack of fluorescence recovery could be due to the fluorescence quenching rather than a lack of membrane depolarization. Therefore, it is not possible to determine if the AEMPs cause membrane permeabilization. It should be noted that PEI did not cause significant quenching of DISC3(5),16 and here we provide a caution to the use of this assay for cationic polymers. In addition to the fluorescence assay, we also performed a cell leakage assay to determine membrane damage by an AEMP. S. aureus cells were incubated with the P7.7 for 2 h, and the cells were removed by centrifugation. The absorbance of cell-free supernatant at 260 nm was measured to determine if any UV-absorbing compounds leaked from S. aureus cells due to any damage to membrane integrity. We observed high absorbance of supernatant. However, the absorbance of AEMP supernatant is about 2-fold higher than a control of 100% cell lysis by lysostaphin. Therefore, the membrane disruption could not be quantitatively determined by this assay method. We speculate that the absorbance was increased due to the interaction or aggregation of AEMPs with cellular components including proteins and lipids (see the Supporting Information for the assay protocol and results). Therefore, it is not clear at this point if the AEMPs are membrane-active or if they have a different mode of action from other antimicrobial polymers.
Antimicrobial Activity in the Presence of Serum
To evaluate the activity of AEMPs under physiological conditions, the MIC values of AEMPs were determined in the presence of FBS. It has been reported that the activity of antimicrobial peptides is reduced in the presence of serum because the serum salts curtail the electrostatic binding of cationic peptides to anionic bacterial surfaces and that serum proteins such as albumin nonspecifically bind to peptides.31,32 Therefore, the activity of AEMPs could also be mitigated in the presence of serum.
AEMP activity was determined in 50% (v/v) FBS in MH broth (MHB). MHB components could nonspecifically bind to the polymers, reducing the polymer activity. The reduction of these antagonizing factors in MHB by dilution with PBS buffer would increase their antimicrobial activity (decrease MIC values). To take this dilution effect into account, we used 50% PBS buffer in MHB as a control.
Against E. coli, all of the polymers did not show any activity in the presence of FBS (MIC > 1000 μg/mL), whereas the high MW polymers P10 and P12 are active toward E. coli in the absence of FBS (Table 3). The MIC of cationic surfactant CTAB also increased in 50% FBS, indicating that serum components reduce the activity of cationic polymers AEMPs and surfactant.
Table 3. Antimicrobial Activity of AEMPs in the Presence of Fetal Bovine Serum.
| MIC (μg/mL) |
|||||||
|---|---|---|---|---|---|---|---|
| bacteria | condition | P7.7 | P10 | P12 | CTAB | mupirocin | norfloxacin |
| E. coli | MHB | >1000 | 670 | 250 | 35 | n.d. | n.d. |
| 50% PBS | >1000 | 670 | 104 | 35 | n.d. | n.d. | |
| 50% FBS | >1000 | >1000 | >1000 | >63 | n.d. | n.d. | |
| S. aureus ATCC 25923 | MHB | 130 | 63 | 63 | 0.98 | 0.5 | 1.3 |
| 50% PBS | 63 | 31 | 16 | 0.98 | 0.5 | 1.0 | |
| 50% FBS | 20 | 5.9 | 6.8 | >7.8 | >4.0 | 2.0 | |
| S. aureus BB 2146 | MHB | 83 | 63 | 42 | 0.81 | 0.33 | 1.0 |
| 50% PBS | 31 | 16 | 16 | 0.41 | 0.25 | 0.67 | |
| 50% FBS | 3.9 | 2.0 | 2.0 | 6.5 | >4.0 | 1.0 | |
Interestingly, the MICs of AEMPs for S. aureus are decreased significantly in the presence of FBS when compared to those in MHB. For example, P7.7, which is used for the in vivo testing described below, had an MIC of 125 μg/mL in MHB and a MIC of 19.5 μg/mL in FBS, giving a 6-fold reduction in MIC (Figure 5). The MIC of P7.7 showed a 2-fold reduction in PBS/MHB, indicating that the MIC reduction of P7.7 in FBS is not due only to the effect of dilution of MHB described above. The MIC of AEMPs with higher molecular weights also decreased in the presence of serum to give MICs of 5.9 and 6.8 μg/mL for P10 and P12, respectively, which is about a 10-fold reduction in their MIC values compared to those in MH broth (Table 3). The MIC values of AEMPs in 50% FBS are 6–20 μg/mL (Table 3), which are comparable to those of potent antimicrobial polymers reported in the literature,9−13 although the literature values were generally determined in the absence of serum. In addition, caution must be taken when comparing MIC values between research groups, as many groups use different assay protocols, and the MIC values depend on multiple assay conditions including bacterial strain, assay plate, and broth media. The MICs of AEMPs for S. aureus strain BB2146, which is the strain used for the in vivo assay described below, are 2–4 μg/mL, indicating that the polymers are highly active against this strain of S. aureus. The MIC values of the surfactant CTAB and the antibiotic mupirocin, which is an RNA duplication inhibitor33 widely used in the topical treatment of skin/wound infections, significantly increased in 50% FBS, indicating that FBS does not generally increase S. aureus susceptibility to antimicrobials. However, the mechanism of potent activity of AEMPs in FBS is not clear at this point. It should be noted that the decrease in MIC of AEMPs for S. aureus was observed for different batches of AEMPs with different lots of FBS, suggesting that the results presented in this report are not batch/lot specific. In summary, the AEMPs showed potent activity against S. aureus in the presence of FBS, which contrasts with the activity reduction for CTAB and antibiotics. These results demonstrate that these AEMPs have potential for potent activity against S. aureus infections under physiological conditions.
Figure 5.

Effect of FBS on the activity of AEMPs and mupirocin against S. aureus.
Bactericidal Kinetics
We examined the bactericidal activity exerted by the AEMPs against S. aureus ATCC 25923 and their time dependence to assess the rate of killing. Accordingly, we monitored the number of viable S. aureus cells in a colony-forming unit (cfu) as a function of exposure time to the AEMPs at concentrations of twice their respective MICs. We used the conventional antibiotics mupirocin and norfloxacin (DNA gyrase and topoisomerase IV inhibitor, respectively)34,35 for comparison.
At two times the MIC, the antibiotic mupirocin caused less than 1 log reduction in the number of viable S. aureus (Figure 6), indicating that mupirocin is rather bacteriostatic under this condition, which is in agreement with the literature.36 Norfloxacin did not cause any change in the number of viable S. aureus cells when the bacteria were in the lag phase of growth (0–40 min), but after 40 min, the number of viable cells started to decrease, with a 2 log reduction after 190 min. After 18 h, the bacteria treated with norfloxacin grew slightly, which is in agreement with the literature.37
Figure 6.

Bactericidal kinetics of AEMPs and antibiotics mupirocin and norfloxacin at 2 times MIC. The detection limit is 10 cfu/mL due to the dilution factor in this assay.
In contrast to the antibiotics tested, the AEMPs showed killing of S. aureus with relatively higher killing rates. All three polymers are bactericidal at 2 times their MICs and caused 4-log reductions in the number of viable bacteria (99.99% killing) within 360 min. The highest MW polymer, P12, caused a 3-log reduction in the number of viable cell population (99.9% killing) after 60 min, whereas P10 and P7.7 needed at least twice as much time, 130 and 210 min, respectively for the same 3-log reduction. This demonstrates that for AEMPs the rate of killing increased as the molecular weight of the polymers increased.
After 18 h, the bacteria incubated with the lower MW polymers P7.7 and P10 grew back to give a 2-fold (99%) or 3-fold (99.9%) reduction in the number of initial bacteria. This indicates that some population of bacteria may be resistant to the antimicrobial action of the AEMPs and are still viable. The development of S. aureus resistance to the polymer will be discussed in detail below.
Resistance Development
To assess the potential emergence of antibacterial resistance to AEMPs, S. aureus was exposed to subinhibitory concentrations (1/2 MIC) of antimicrobial agents during successive subcultures. We used P7.7 as a model compound and two conventional antibiotics norfloxacin and mupirocin as positive controls, as the antibiotic resistance in S. aureus to these antibiotics has been previously reported.38,39
The MIC values of P7.7 and the antibiotics against S. aureus were determined for each passage over 14 successive subcultures (Figure 7). The MIC values of norfloxacin started to increase on the first passage and continuously increased up to 64 times the starting MIC at the 11th passage. The MIC of mupirocin began increasing at the second passage and continued increasing up to 6 times the original MIC at the 11th passage. On the other hand, the MIC of P7.7 started to increase at the fourth passage and increased up to 6 times the original MIC after 12 passages, which is at the same level of resistance as that against mupirocin.
Figure 7.

Propensity of AEMP P7.7 for resistance development in S. aureus. (A) Fold increase in MIC against S. aureus as a function of passage. One-sided error bars are presented for clarity. (B) Relative increase in MIC after 14 passages.
It has been reported that S. aureus has become resistant to cationic antimicrobial peptides by chemically modifying their anionic biopolymer teichoic acids in the cell wall.40 The alanyl esterification of the teichoic acids reduces the net anionic charge in the S. aureus cell wall,41,42 which decreases the electrostatic binding of cationic polymers to the bacterial cell surfaces. The same resistance mechanism would also reduce the electrostatic binding of cationic polymers to S. aureus, resulting in lower AEMP activity or an increase in MIC, although the antimicrobial target of AEMPs in bacteria is not clear at this point.
Hemolytic Activity
As an initial metric of biocompatibility, the lysis of human red blood cells (hemolysis) by AEMPs was measured. The AEMPs showed 1.6–7.6% hemolysis at 1000 μg/mL, the highest concentration tested (Figure 8), indicating the AEMPs are not potent hemolysins. For comparison, under the same assay conditions, bee venom toxin melittin causes 100% hemolysis at concentrations as low as 10 μg/mL (data not shown). In corroboration with the antimicrobial activity of AEMPs, the AEMPs are antimicrobial against Gram-positive bacteria over Gram-negative bacteria, but they are not hemolytic, indicating the AEMPs are cell-selective to Gram-positive bacteria.
Figure 8.
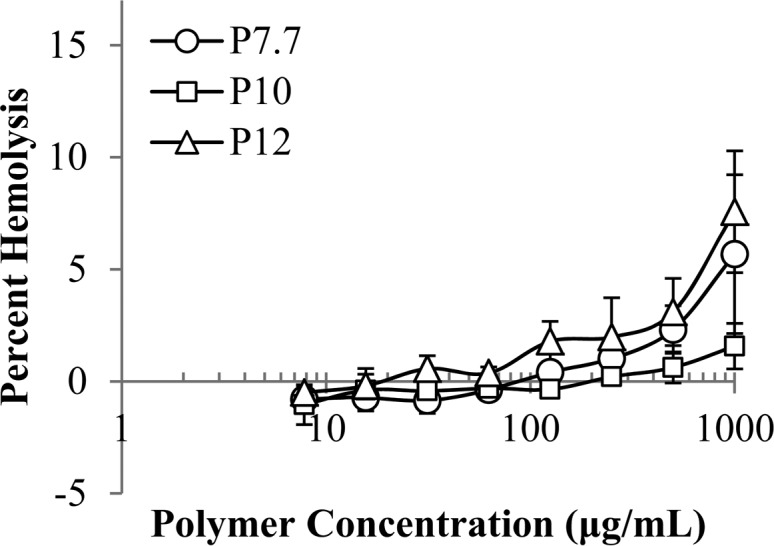
Hemolytic activity of AEMPs against human red blood cells, with hemolysis by Triton X set as 100%.
Cell Cytotoxicity
To assess the toxic profile of AEMPs, the reduction of cell viability of mammalian cells exposed to AEMPs or cytotoxicity was determined. We used human epithelial HEp-2 cells because a potential application of AEMPs is topical antimicrobials for skin and nasal infections. Monkey kidney fibroblast COS-7 cells were also used to test for cytotoxicity in order to examine the cell dependence of AEMP cytotoxicity. The cell viability was determined using the XTT colorimetric assay.43,44 In addition to the AEMPs, commercially available polymers including neutral nontoxic PEG (MW 2000) as well as BPEI (MW 1800) were used for comparison.
For both cell lines tested, the cell viability decreased with increasing AEMP and BPEI concentrations, eventually reaching 0% (complete cell death) (Figure 9). PEG did not show any significant reduction in cell viability for either cell line. For the AEMPs, cell viability decreased with increasing polymer concentration, and the cytotoxicity of AEMPs was dependent on the molecular weight of the AEMP. The polymer concentration which caused a 50% reduction in cell viability after 24 h incubation with AEMPs was defined as the IC50 value (Table 4).
Figure 9.

Cytotoxicity of AEMPs. Cell viability of HEp-2 (A) and COS-7 (B) cells was determined after 24 h incubation with AEMPs.
Table 4. Cytotoxicity of AEMPs to HEp-2 and COS-7 cells.
| IC50 (μg/mL)a |
||
|---|---|---|
| polymer | HEp-2 | COS-7 |
| P7.7 | 250 | >1000 |
| P10 | 75 | 270 |
| P12 | 20 | 55 |
| PEG (MW 2000) | >1000 | >1000 |
| BPEI (MW 1800) | 85 | 175 |
Concentration for a 50% reduction in cell viability.
For HEp-2 cells, the IC50 values decreased as the molecular weight of the CMPs increased, indicating that high molecular weight or more cationic groups of AEMPs cause higher cytotoxicity (Figure 9A). It has been previously reported that traditional cationic polymers such as PEIs and PAMAM dendrimers cause cytotoxicity, possibly by increasing the permeability of cell membrane of mammalian cells,45−47 and that membrane permeabilization was strongly dependent on the number of cationic charges presented at the polymer and dendrimer surfaces.46,47 The structure–function study on the cytotoxicity of cationic amine-poly(vinyl alcohol) polymers demonstrated that the cationic ammonium groups of polymers may bind through multiple points to cell membranes, resulting in membrane disruption or permeabilization.48 These results indicated that cationic functionality in polymer structures may have an intrinsic toxicity mechanism against host cells through the interactions with cell membranes. Similarly, the polycationic AEMPs might also cause cytotoxic effect by permeabilizing cell membranes. The high MW AEMPs have higher cationic densities, resulting in higher cooperative action of cationic groups for membrane binding and permeability though multiple-point interaction with lipids, resulting in higher toxicity (a lower IC50 value) than its lower molecular weight counterparts.
For COS-7 cells, all AEMPs reduced cell viability when compared to that of PEG, which showed 100% COS-7 viability across all concentrations tested (7.8–1000 μg/mL, Figure 9B). The higher MW AEMPs cause a larger reduction in cell viability; P12 was the most cytotoxic (IC50 = 55 μg/mL) followed by P10 (IC50 = 270 μg/mL) and P7.7 (IC50 > 1000 μg/mL), indicating that more cationic groups of AEMPs cause toxicity to COS-7 cells, as shown for HEp-2 cells. As the IC50 values of AEMPs for HEp-2 cells are lower than those for COS-7 cells, it appears that HEp-2 cells are more susceptible to the AEMPs than COS-7 (Table 4).
Selectivity to Bacteria over Mammalian Cells
To examine the selective activity of AEMPs to bacterial cells over mammalian cells, we determined the IC50/MIC as a selectivity measure (Table 5). In general, because of the low activity of AEMPs against E. coli (MICs > 1000 μg/mL), the selectivity indices for E. coli are small (<0.3) for all polymers, indicating that the AEMPs are not selective to E. coli over mammalian cells. On the other hand, the low molecular weight AEMPs P7.7 and P10 showed higher selectivity for S. aureus than did P12. These data demonstrate that P7.7 and P10 are more selective for S. aureus over both HEp-2 and COS-7 cells. The AEMPs P7.7 and P10 showed potent activity against S. aureus in the presence of FBS (MIC = 2–4 μg/mL for S. aureus BB2146 and 13 μg/mL for S. aureus ATCC 25923), indicating that these two AEMPs would be good candidates for in vivo applications for treatment of S. aureus infections, as demonstrated below.
Table 5. Selectivity of AEMPs to S. aureus over Mammalian Cells.
| HEp-2a |
COS-7a |
|||||
|---|---|---|---|---|---|---|
| polymers | E. coli | S. aureus ATCC 25923 | S. aureus BB 2146 | E. coli | S. aureus ATCC 25923 | S. aureus BB 2146 |
| P7.7 | >0.3 (<0.3) | 2.0 (13) | 4.0 (64) | n.d.b | 8.0 (>51) | 16 (>256) |
| P10 | 0.1 (<0.1) | 1.2 (13) | 1.2 (39) | 0.3 (<0.3) | 4.3 (46) | 4.3 (139) |
| P12 | 0.1 (<0.1) | 0.3 (3.0) | 0.5 (10) | 0.2 (<0.1) | 0.9 (8.1) | 1.3 (28) |
Selectivity is calculated by IC50/MIC (MHB). The selectivity index for MIC in 50% FBS in MH broth is presented in parentheses.
Not determined because IC50 and MIC (E.c.) are both > 1000 μg/mL.
In Vivo Antimicrobial Activity of AEMPs
As a preliminary assessment of the in vivo topical treatment of S. aureus infections using AEMPs, we chose a cotton rat nasal S. aureus colonization model because of the clinic issues associated with nasal S. aureus colonization, as described below. The nasal cavity is the primary reservoir for S. aureus, with approximately 30% of the human population being asymptomatically colonized.49−51 Patients who are asymptomatically colonized are at significantly higher risk for several infections including bacteremia, postoperative infections, and diabetic foot ulcer infections. Furthermore, most nosocomial S. aureus infections are caused by the patient’s own S. aureus cells.51−54 The nasal environment also serves as a hotbed for drug-resistance development of S. aureus.27,49−51 Treatment with the topical the antibiotic mupirocin has proven to be effective at reducing both nasal colonization and the risk of postoperative infection.50,53 However, the appearance of mupirocin resistance threatens this nasal eradication strategy.55
S. aureus strain BB214627 colonies were allowed to establish in the nasal passage for 3 days. After 3 days, the rats were given a nasal spray treatment consisting of either PBS buffer (control), mupirocin (antibiotic control), P7.7, or P10. Mupirocin was added at a treatment concentration of 400 μg/mL, which is 2000× MIC (MHB) (800 μM), as this treatment concentration of mupirocin has been demonstrated to eliminate most S. aureus strains from the nose.56 P7.7 was added at a treatment concentration of 125 μg/mL. This concentration was used for treatment because it is higher than the MIC of P7.7 against S. aureus BB2146 (MIC (MHB) = 63 μg/mL, MIC (50% FBS) = 3.9 μg/mL) and because HEp-2 and COS-7 are tolerant to the polymer (cell viabilities of >90%), giving the maximum polymer concentration for the selective activity to S. aureus over mammalian cells. After 3 days, the animals were sacrificed, and the number of S. aureus cells in each nasal passage were determined (Figure 10). Trial 1 involved 5 animals for P7.7, 3 animals for mupirocin, and 3 animals for PBS buffer (control). Trial 2 involved 5 animals for P10, 5 animals for mupirocin, and 5 animals for PBS buffer. The experiments for P7.7 and P10 were performed independently, and the combined data for these controls (PBS control and mupirocin) are presented below (Figure 10). All data from these two trials are provided in the Supporting Information. Because mupirocin has widespread use in S. aureus nasal decolonization,57,58 mupirocin provides a benchmark for the efficacy of antimicrobials.
Figure 10.

In vivo assessment in a cotton rat nasal S. aureus colonization model. *, p < 0.001; **, p < 0.0001.
Mupirocin and P7.7 reduced the number of viable S. aureus cells when compared to that in the PBS control, but the difference in reduction between these two treatments is not statistically significant. Therefore, under these test conditions, P7.7 is as effective at reducing the number of viable S. aureus cells as mupirocin is. It should be noted that the treatment concentration of P7.7 is about two times the MIC, whereas mupirocin used a treatment concentration of 2000 times the MIC, although lower concentrations of mupirocin may be effective.
AEMP P10 was also tested as a treatment for S. aureus nasal colonization (MIC for S. aureus BB2146 = 63 μg/mL in MHB and 2.0 μg/mL in 50% FBS) at the same polymer treatment concentration (125 μg/mL) as that for the testing of P7.7, although at this concentration the polymer indicated significant cytotoxicity to HEp-2 cells (Figure 9A). P10 also showed a significant reduction in the number of viable S. aureus cells when compared to that in the PBS treatment control. These in vivo tests demonstrate that AEMPs result in encouraging treatment outcomes for S. aureus in a nasal infection model.
Conclusions
In summary, we investigated the in vitro and in vivo antimicrobial activity of cationic ammonium ethyl methacrylate polymers (AEMPs) with primary ammonium groups in the side chains and with varying molecular weights. The AEMPs were active against Gram-positive bacteria when compared to Gram-negative bacteria, although the polymers did not show a strong preference to any specific Gram-positive bacteria. The AEMPs also inhibited methicillin-resistant S. aureus with similar MIC values against the susceptible strain. The AEMPs also showed potent activity against S. aureus in the presence of FBS, whereas their activity against E. coli was reduced, suggesting that the AEMPs may be active against S. aureus infections under physiological conditions. However, the antimicrobial mechanism of AEMPs and their targets in bacteria are not clear at this point. The AEMPs showed bactericidal activity against S. aureus, with higher rates compared to that of other antibiotics. AEMP P7.7 showed similar resistance development as that toward mupirocin (6 times original MIC after 14 passages). In a cotton rat nasal infection model, the AEMP P7.7 significantly reduced the number of viable S. aureus cells. This AEMP was as effective at reducing the number of viable S. aureus cells as mupirocin when compared to the control, without polymer, treatment. These in vivo tests demonstrate the potential of cationic methacrylate homopolymers, particularly with primary ammonium groups, for use in the treatment of S. aureus infections. However, more work is needed to better understand the antimicrobial mechanism of these polymers to aid in the design of more potent antimicrobials.
The development of antimicrobial polymers has been focused on the design of polymers with both cationic and hydrophobic groups in the side chains for efficient disruption of bacteria cell membranes, which mimic the function of natural host-defense antimicrobial peptides. However, our study indicates that cationic homopolymer AEMPs without strong hydrophobic moieties can exert antimicrobial activity and that they, interestingly, show potent anti-S. aureus activity in the presence of serum. Recent studies indicate that naturally occurring antimicrobial peptides exert their antimicrobial effects by binding to the multiple targets of cell walls, in addition to membrane disruption, which may be one of the components in the antimicrobial mechanism of peptides.57 The AEMPs will serve as a simple model for the antimicrobial mechanism of cationic polymers and also may capture the modes of action associated with cationic functionality in the bacterial cell wall. Although it was not investigated in this study, the antimicrobial activity of AEMPs is likely pH-dependent due to the protonation of primary amine groups. We have previously demonstrated that chemical structures of ammonium groups (primary, tertiary, and quaternary) determine the binding of polymers to bacterial cell membranes and antimicrobial activity against E. coli.59,60 The tuning of cationic functionality of polymers would be of interest in the design of pH-responsive antimicrobial polymers, as has been previously demonstrated using acidic groups.61 Our findings may provide a new design strategy for antimicrobial polymers that are effective under physiological conditions and provide new insight into the mode of action of antimicrobial polymers with cell-selective activity.
Acknowledgments
We would like to thank the National Science Foundation for NSF CAREER Award (DMR-0845592 to K.K.) and the Department of Biologic and Materials Sciences, School of Dentistry, University of Michigan. Research reported in this artricle was supported by the National Center for Advancing Translational Sciences of the National Institutes of Health under award no. 2UL1TR000433 through Michigan Institute for Clinical and Health Research (MICHR) and NIH NIAID award AI081748 to B.R.B.. The content is solely the responsibility of the authors and does not necessarily represent the official views of the National Institutes of Health. We thank Dr. Robertson Davenport at the University of Michigan Hospital for supplying red blood cells. We also thank Dr. Edmund Palermo at the University of Michigan for his help with polymerization, Dr. Anne McNeil at the University of Michigan for the use of GPC, and Dr. Haruko Takahshi for her help and guidance with cell culture. Thanks also to Drs. Erik Krukonis and Vern Carruthers at the University of Michigan for providing us with the HEp-2 and COS-7 cell lines, respectfully.
Supporting Information Available
1H NMR spectra of monomer, CPETC, and polymers as well as CPETC treatment with TFA and in vivo testing data. This material is available free of charge via the Internet at http://pubs.acs.org.
The authors declare the following competing financial interest(s): K. Kuroda is a coinventor on a patent application filed by the University of Pennsylvania covering Antimicrobial Copolymers and Uses Thereof. The patent application has been licensed to Cellceutix (Beverly, MA). Cellceutix did not play a role in the design and conduct of this study, in the collection, analysis, or interpretation of the data, or in the preparation, review, or approval of this article.
Funding Statement
National Institutes of Health, United States
Supplementary Material
References
- Levy S. B.; Marshall B. Nat. Med. 2004, 10, S122–S129. [DOI] [PubMed] [Google Scholar]
- Coates A. R. M.; Halls G.; Hu Y. M. Br. J. Pharmacol. 2011, 163, 184–194. [DOI] [PMC free article] [PubMed] [Google Scholar]
- Asuquo A. E.; Piddock L. J. V. J. Antimicrob. Chemother. 1993, 31, 865–880. [DOI] [PubMed] [Google Scholar]
- Riley M. A.; Robinson S. M.; Roy C. M.; Dorit R. L. Future Med. Chem. 2013, 5, 1231–1242. [DOI] [PubMed] [Google Scholar]
- Engler A. C.; Wiradharma N.; Ong Z. Y.; Coady D. J.; Hedrick J. L.; Yang Y. Y. Nano Today 2012, 7, 201–222. [Google Scholar]
- Kuroda K.; Caputo G. A. Wiley Interdiscip. Rev.: Nanomed. Nanobiotechnol. 2013, 5, 49–66. [DOI] [PubMed] [Google Scholar]
- Li P.; Li X.; Saravanan R.; Li C. M.; Leong S. S. J. RSC Adv. 2012, 2, 4031–4044. [Google Scholar]
- Munoz-Bonilla A.; Fernandez-Garcia M. Prog. Polym. Sci. 2012, 37, 281–339. [Google Scholar]
- King A.; Chakrabarty S.; Zhang W.; Zeng X. M.; Ohman D. E.; Wood L. F.; Abraham S.; Rao R.; Wynne K. J. Biomacromolecules 2014, 15, 456–467. [DOI] [PMC free article] [PubMed] [Google Scholar]
- Liu R. H.; Chen X. Y.; Chakraborty S.; Lemke J. J.; Hayouka Z.; Chow C.; Welch R. A.; Weisblum B.; Masters K. S.; Gellman S. H. J. Am. Chem. Soc. 2014, 136, 4410–4418. [DOI] [PMC free article] [PubMed] [Google Scholar]
- Liu R. H.; Chen X. Y.; Falk S. P.; Mowery B. P.; Karlsson A. J.; Weisblum B.; Palecek S. P.; Masters K. S.; Gellman S. H. J. Am. Chem. Soc. 2014, 136, 4333–4342. [DOI] [PMC free article] [PubMed] [Google Scholar]
- Stratton T. R.; Applegate B. M.; Youngblood J. P. Biomacromolecules 2011, 12, 50–56. [DOI] [PubMed] [Google Scholar]
- Thaker H. D.; Cankaya A.; Scott R. W.; Tew G. N. ACS Med. Chem. Lett. 2013, 4, 481–485. [DOI] [PMC free article] [PubMed] [Google Scholar]
- Palermo E. F.; Vemparala S.; Kuroda K. Biomacromolecules 2012, 13, 1632–1641. [DOI] [PubMed] [Google Scholar]
- Sovadinova I.; Palermo E. F.; Urban M.; Mpiga P.; Caputo G. A.; Kuroda K. Polymers 2011, 3, 1512–1532. [Google Scholar]
- Gibney K. A.; Sovadinova I.; Lopez A. I.; Urban M.; Ridgway Z.; Caputo G. A.; Kuroda K. Macromol. Biosci. 2012, 12, 1279–1289. [DOI] [PMC free article] [PubMed] [Google Scholar]
- Al-Ahmad A.; Laird D.; Zou P.; Tomakidi P.; Steinberg T.; Lienkamp K. PLoS One 2013, 8, e73812. [DOI] [PMC free article] [PubMed] [Google Scholar]
- Lienkamp K.; Madkour A. E.; Musante A.; Nelson C. F.; Nusslein K.; Tew G. N. J. Am. Chem. Soc. 2008, 130, 9836–9843. [DOI] [PMC free article] [PubMed] [Google Scholar]
- Epand R. F.; Sarig H.; Mor A.; Epand R. M. Biophys. J. 2009, 97, 2250–2257. [DOI] [PMC free article] [PubMed] [Google Scholar]
- Raafat D.; von Bargen K.; Haas A.; Sahl H. G. Appl. Environ. Microbiol. 2008, 74, 3764–73. [DOI] [PMC free article] [PubMed] [Google Scholar]
- Sievert D. M.; Ricks P.; Edwards J. R.; Schneider A.; Patel J.; Srinivasan A.; Kallen A.; Limbago B.; Fridkin S.; Infect. Control Hosp. Epidemiol. 2013, 34, 1–14. [DOI] [PubMed] [Google Scholar]
- Stryjewski M. E.; Corey G. R. Clin. Infect. Dis. 2014, 58, S10–S19. [DOI] [PubMed] [Google Scholar]
- Weidenmaier C.; Goerke C.; Wolz C. Trends Microbiol. 2012, 20, 243–250. [DOI] [PubMed] [Google Scholar]
- Wertheim H. F. L.; Melles D. C.; Vos M. C.; van Leeuwen W.; van Belkum A.; Verbrugh H. A.; Nouwen J. L. Lancet Infect. Dis. 2005, 5, 751–762. [DOI] [PubMed] [Google Scholar]
- Ishitake K.; Satoh K.; Kamigaito M.; Okamoto Y. Angew. Chem., Int. Ed. 2009, 48, 1991–1994. [DOI] [PubMed] [Google Scholar]
- Voyich J. A.; Braughton K. R.; Sturdevant D. E.; Whitney A. R.; Said-Salim B.; Porcella S. F.; Long R. D.; Dorward D. W.; Gardner D. J.; Kreiswirth B. N.; Musser J. M.; DeLeo F. R. J. Immunol. 2005, 175, 3907–3919. [DOI] [PubMed] [Google Scholar]
- Pynnonen M.; Stephenson R. E.; Schwartz K.; Hernandez M.; Boles B. R. Plos Pathogens 2011, 7, e1002104.20. [DOI] [PMC free article] [PubMed] [Google Scholar]
- Kokai-Kun J. F.The cotton rat as a model for Staphylococcus aureus nasal colonization in humans. In Bacterial Pathogenesis: Methods and Protocols; DeLeo F. R., Otto M., Eds.; Humana Press Inc: Totowa, NJ, 2008; Vol. 431, pp 241–254. [DOI] [PubMed] [Google Scholar]
- Methods for dilution antimicrobial susceptibility tests for bacteria that grow aerobically: approved standard–seventh edition; Clinical and Laboratory Standards Institute: Wayne, PA, 2006; M07-A7.
- Friedrich C. L.; Moyles D.; Beveridge T. J.; Hancock R. E. W. Antimicrob. Agents Chemother. 2000, 44, 2086–2092. [DOI] [PMC free article] [PubMed] [Google Scholar]
- Maisetta G.; Di Luca M.; Esin S.; Florio W.; Brancatisano F. L.; Bottai D.; Campa M.; Batoni G. Peptides 2008, 29, 1–6. [DOI] [PubMed] [Google Scholar]
- Marr A. K.; Gooderham W. J.; Hancock R. E. W. Curr. Opin. Pharmacol. 2006, 6, 468–472. [DOI] [PubMed] [Google Scholar]
- Hughes J.; Mellows G. J. Antibiot. 1978, 31, 330–335. [DOI] [PubMed] [Google Scholar]
- Crumplin G. C.; Kenwright M.; Hirst T. J. Antimicrob. Chemother. 1984, 13, B9–23. [DOI] [PubMed] [Google Scholar]
- Drlica K.; Zhao X. L. Microbiol. Mol. Biol. Rev. 1997, 61, 377–392. [DOI] [PMC free article] [PubMed] [Google Scholar]
- Chapnick E. K.; Gradon J. D.; Kreiswirth B.; Lutwick L. I.; Schaffer B. C.; Schiano T. D.; Levi M. H. Infect. Control Hosp. Epidemiol. 1996, 17, 178–180. [DOI] [PubMed] [Google Scholar]
- Minguez F.; Ramos C.; Barrientos S.; Loscos A.; Prieto J. Chemotherapy 1991, 37, 420–425. [DOI] [PubMed] [Google Scholar]
- Eltringham I. J. Hosp. Infect. 1997, 35, 1–8. [DOI] [PubMed] [Google Scholar]
- McConeghy K. W.; Mikolich D. J.; LaPlante K. L. Pharmacotherapy 2009, 29, 263–280. [DOI] [PubMed] [Google Scholar]
- Peschel A. Trends Microbiol. 2002, 10, 179–186. [DOI] [PubMed] [Google Scholar]
- Neuhaus F. C.; Baddiley J. Microbiol. Mol. Biol. Rev. 2003, 67, 686–723. [DOI] [PMC free article] [PubMed] [Google Scholar]
- Peschel A.; Otto M.; Jack R. W.; Kalbacher H.; Jung G.; Gotz F. J. Biol. Chem. 1999, 274, 8405–8410. [DOI] [PubMed] [Google Scholar]
- Roehm N. W.; Rodgers G. H.; Hatfield S. M.; Glasebrook A. L. J. Immunol. Methods 1991, 142, 257–265. [DOI] [PubMed] [Google Scholar]
- Scudiero D. A.; Shoemaker R. H.; Paull K. D.; Monks A.; Tierney S.; Nofziger T. H.; Currens M. J.; Seniff D.; Boyd M. R. Cancer Res. 1988, 48, 4827–4833. [PubMed] [Google Scholar]
- Fischer D.; Li Y.; Ahlemeyer B.; Krieglstein J.; Kissel T. Biomaterials 2003, 24, 1121–1131. [DOI] [PubMed] [Google Scholar]
- Hong S. P.; Bielinska A. U.; Mecke A.; Keszler B.; Beals J. L.; Shi X. Y.; Balogh L.; Orr B. G.; Baker J. R.; Holl M. M. B. Bioconjugate Chem. 2004, 15, 774–782. [DOI] [PubMed] [Google Scholar]
- Hong S. P.; Leroueil P. R.; Janus E. K.; Peters J. L.; Kober M. M.; Islam M. T.; Orr B. G.; Baker J. R.; Holl M. M. B. Bioconjugate Chem. 2006, 17, 728–734. [DOI] [PubMed] [Google Scholar]
- Unger F.; Wittmar M.; Kissel T. Biomaterials 2007, 28, 1610–1619. [DOI] [PubMed] [Google Scholar]
- Kuehnert M. J.; Kruszon-Moran D.; Hill H. A.; McQuillan G.; McAllister S. K.; Fosheim G.; McDougal L. K.; Chaitram J.; Jensen B.; Fridkin S. K.; Killgore G.; Tenover F. C. J. Infect. Dis. 2006, 193, 172–179. [DOI] [PubMed] [Google Scholar]
- Munoz P.; Hortal J.; Giannella M.; Barrio J. M.; Rodriguez-Creixems M.; Perez M. J.; Rincon C.; Bouza E. J. Hosp. Infect. 2008, 68, 25–31. [DOI] [PubMed] [Google Scholar]
- Peacock S. J.; de Silva I.; Lowy F. D. Trends Microbiol. 2001, 9, 605–610. [DOI] [PubMed] [Google Scholar]
- Stanaway S.; Johnson D.; Moulik P.; Gill G. Diabetes Res. Clin. Pract. 2007, 75, 47–50. [DOI] [PubMed] [Google Scholar]
- von Eiff C.; Becker K.; Machka K.; Stammer H.; Peters G.; Study G. N. Engl. J. Med. 2001, 344, 11–16. [DOI] [PubMed] [Google Scholar]
- Wertheim H. F. L.; Vos M. C.; Ott A.; van Belkum A.; Voss A.; Kluytmans J.; van Keulen P. H. J.; Vandenbroucke-Grauls C.; Meester M. H. M.; Verbrugh H. A. Lancet 2004, 364, 703–705. [DOI] [PubMed] [Google Scholar]
- Caffrey A. R.; Quilliam B. J.; LaPlante K. L. J. Hosp. Infect. 2010, 76, 206–210. [DOI] [PubMed] [Google Scholar]
- Gilbart J.; Perry C. R.; Slocombe B. Antimicrob. Agents Chemother. 1993, 37, 32–38. [DOI] [PMC free article] [PubMed] [Google Scholar]
- Peschel A.; Sahl H. G. Nat. Rev. Microbiol. 2006, 4, 529–536. [DOI] [PubMed] [Google Scholar]
- Simor A. E. Lancet Infect. Dis. 2011, 11, 952–962. [DOI] [PubMed] [Google Scholar]
- Palermo E. F.; Kuroda K. Biomacromolecules 2009, 10, 1416–1428. [DOI] [PubMed] [Google Scholar]
- Palermo E. F.; Lee D.-K.; Ramamoorthy A.; Kuroda K. J. Phys. Chem. B 2011, 115, 366–375. [DOI] [PMC free article] [PubMed] [Google Scholar]
- Jiang Y. J.; Yang X.; Zhu R.; Hu K.; Lan W. W.; Wu F.; Yang L. H. Macromolecules 2013, 46, 3959–3964. [Google Scholar]
Associated Data
This section collects any data citations, data availability statements, or supplementary materials included in this article.