Abstract
High-intensity focused ultrasound (HIFU) is a treatment modality that relies on the delivery of acoustic energy to remote tissue sites to induce thermal and/or mechanical tissue ablation. To ensure the safety and efficacy of this medical technology, standard approaches are needed for accurately characterizing the acoustic pressures generated by clinical ultrasound sources under operating conditions. Characterization of HIFU fields is complicated by nonlinear wave propagation and the complexity of phased-array transducers. Previous work has described aspects of an approach that combines measurements and modeling, and here we demonstrate this approach for a clinical phased array transducer. First, low-amplitude hydrophone measurements were performed in water over a scan plane between the array and the focus. Second, these measurements were used to holographically reconstruct the surface vibrations of the transducer and to set a boundary condition for a 3-D acoustic propagation model. Finally, nonlinear simulations of the acoustic field were carried out over a range of source power levels. Simulation results were compared to pressure waveforms measured directly by hydrophone at both low and high power levels, demonstrating that details of the acoustic field including shock formation are quantitatively predicted.
I. Introduction
Medical ultrasound involves the delivery of acoustic pressures to tissues for either diagnostic or therapeutic purposes. Diagnostic applications are widespread and include neonatal and cardiographic imaging, among many others [1]. Therapeutic applications are currently less prevalent, though many treatments are in the process of development [2]. One longstanding treatment is shock wave lithotripsy (SWL), which has been used clinically for several decades to break up renal calculi [3]. In addition, high intensity focused ultrasound (HIFU) describes a category of therapies that use ultrasound to either thermally ablate or mechanically fractionate tissue [4]–[6].
For both diagnostic and therapeutic applications, it is important to know how acoustic energy is delivered to tissues in order to ensure the safety and efficacy of ultrasound exposures. As described in several review articles [7]–[9], relevant measurement standards are available for diagnostic ultrasound, but remain in development for therapeutic applications that utilize high acoustic intensities. As defined by the International Electrotechnical Commission (IEC), standards for characterizing the acoustic field generated by an ultrasound transducer involve measurements of acoustic pressure and power in water. Such measurements are often described as “exposimetry” and are used to estimate in situ pressures because direct pressure measurements in patients are not feasible. This process, termed “derating”, accounts for acoustic propagation in tissue rather than in water and necessarily requires estimation of the acoustic properties of tissue over the propagation path in a given patient. Moreover, derating schemes inherently involve a model-based calculation to determine in situ pressures based on measurements. In this way, all standard approaches for quantitatively evaluating the delivery of ultrasound to tissues rely upon a combination of measurements and modeling.
The quantitative characterization of HIFU fields poses technical challenges related to both the acquisition and derating of exposimetry data. These challenges and the ongoing development of approaches to address them are evident in the status of the relevant IEC document [10], which is currently a draft revision of a technical specification. Challenges in acquiring exposimetry data are related to high pressure levels, highly localized focal regions, and nonlinear distortion of pressure waveforms that can include the formation of shocks. Direct measurement of such fields poses stringent hydrophone requirements in terms of resistance to damage, size of the sensitive region, and bandwidth. Moreover, multiple scans of a hydrophone throughout a 3D volume can be impractical for characterizing a HIFU field over a range of operating power outputs. The derating of exposimetry measurements for estimating in situ pressures also poses particular challenges for intense fields. Typical derating strategies such as that included in the AIUM/NEMA standard for diagnostic ultrasound [9] assume linear acoustic propagation; however, it is well established that nonlinear propagation effects can significantly affect the in situ acoustic field for both diagnostic and therapeutic applications [11]–[13]. Accordingly, methods for modeling nonlinear propagation for intense ultrasound fields has received significant attention in recent years [14]–[18]. Moreover, derating schemes for HIFU fields in tissue have been proposed based on nonlinear propagation characteristics of highly focused ultrasound beams [6], [19], [20].
To address these challenges, we propose a straightforward, stepwise approach that combines measurements and modeling for characterizing the performance of medical ultrasound sources. Canney et al. [21] and later Bessonova and Wilkens [22] have implemented a similar approach for characterizing focused, single-element sources. In these efforts, an equivalent piston source was used for model boundary conditions, where the effective aperture, radius of curvature, and source pressure were determined by fitting the shape of the simulated linear acoustic field to measurements made at low pressure amplitudes. Moreover, the nonlinear model in both cases used a parabolic approximation for diffraction and presumed an axisymmetric acoustic field. However, clinical HIFU sources can comprise random arrays of elements, and the earlier work has shown that non-uniform vibration velocities over the transducer surface affect the nearfield beam. To better capture these effects, the present effort incorporates acoustic holography measurements to define realistic, non-uniform model boundary conditions, while nonlinear modeling is performed in 3D with a full-diffraction model. Implementation of this numerical model was previously described by Yuldashev and Khokhlova [23] for an ideal array with uniformly vibrating piston elements. Here we present details of a full characterization of a phased-array source designed for clinical HIFU therapies (Sonalleve V1 3.0T, Philips Healthcare). As such, the scope of this work includes measurements and nonlinear modeling in water to quantify the behavior of a clinical array source. In addition, we present direct measurements of focal waveforms for comparison.
Details of the approach are described below in the Methods section. In the ensuing Results section, low-power calibration measurements used to initialize the model are described, including the reconstruction of an acoustic hologram to describe the surface vibrations of the transducer as a model boundary condition. Next, modeling results are presented and compared with independently measured pressure waveforms that were collected over a wide range of clinically relevant output power levels. Although the main focus of this effort is to demonstrate the quantitative characterization of a clinical source under basic operating conditions with all elements vibrating in phase, additional results are also presented for conditions with electronic steering of the focus away from the center of curvature of the transducer.
II. Methods
To fully calibrate a HIFU source in water across a range of output levels, the approach adopted here utilizes low-amplitude hydrophone measurements in the linear propagation regime in conjunction with nonlinear modeling validated against measurements. Specific steps of the method can be listed as follows:
At a low output level, use a calibrated hydrophone to measure in water the linear pressure magnitude and phase over a planar region in front of the source. The position and orientation of such a region should be chosen so that it is crossed by most of the ultrasound field emitted by the source. A practical choice would be to position the measurement plane close to the source, with an orientation perpendicular to the ultrasound propagation direction and a size that extends beyond the geometrical cross section of the ultrasound beam. Such measurements can be used to define a 2-D hologram of the full 3-D sound field and can be used to mathematically reconstruct the pattern of vibrations on the surface of the source [24] as a boundary condition for the acoustic propagation model.
At a near-source location, measure the linear pressure magnitude across a range of clinically relevant output levels, including the level used in Step 1. The measurement location ideally should be near a local pressure maximum, while also being close to the source to minimize the possibility of nonlinear propagation effects. This single-point measurement allows relation of the source pressure level at various output settings to the source pressure level for the holography measurements in Step 1. Accordingly, the pattern of reconstructed source vibrations from Step 1 can be scaled in magnitude to obtain a boundary condition at any other output setting. In addition, the total acoustic power calculated from the measured hologram can be used to determine the source power at all measured output levels.
Simulate the nonlinear acoustic field using the boundary condition from Step 1 and scaling factors from Step 2 for different output settings. Nonlinear modeling of the full 3-D field generated by an array transducer is possible though computationally challenging [23].
This basic method has been used here to characterize a clinical HIFU array; independent hydrophone measurements were also performed to evaluate the approach. In the ensuing subsections, details of the clinical source, the hydrophone measurements, and the nonlinear modeling are described.
A. Experimental Arrangement and Transducer Array Details
The transducer array was part of a Sonalleve V1 3.0T MR-HIFU system (Philips Healthcare, Vantaa, Finland) installed at the Bio-Molecular Imaging Center at the University of Washington (Seattle, WA). As a part of the MR-HIFU system, the transducer was mounted in a patient table, which was moved outside the magnet room to facilitate the acquisition of hydrophone data.
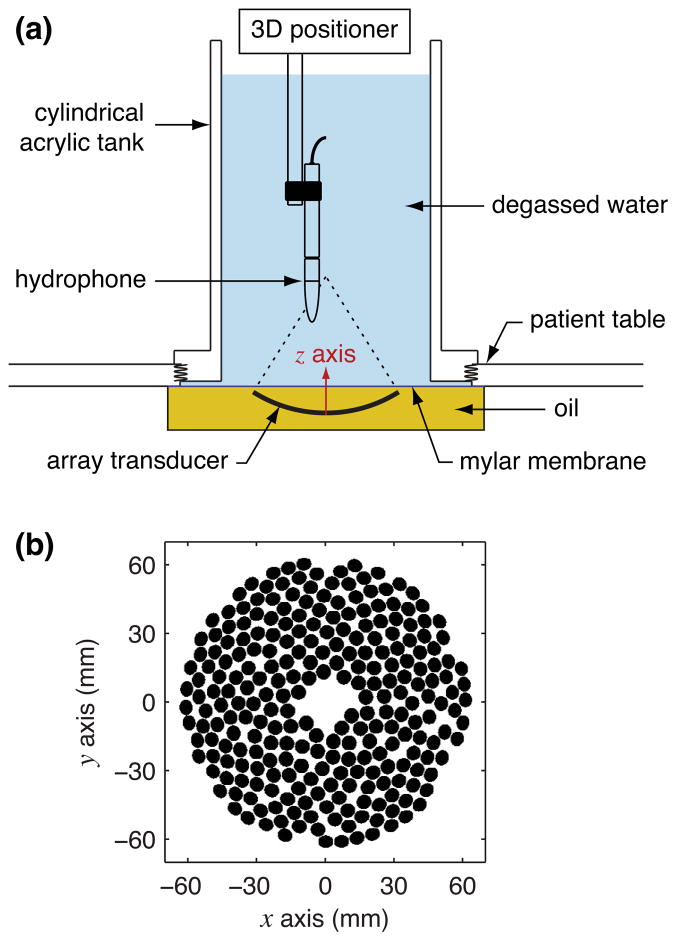
The overall experimental arrangement used for hydrophone measurements is depicted in Fig. 1a. A cylindrical acrylic tank with an inside diameter of 184 mm was attached to the top of the patient table and filled with water degassed to about 10% dissolved oxygen. Inside the patient table, the transducer was surrounded by oil that was separated from the degassed water by a mylar membrane with a thickness of 50 μm. The oil specifications at room temperature suggest a sound speed near 1380 m/s and a density near 840 kg/m3. Though the impedance mismatch at the oil-membrane-water interface was designed to reflect very little acoustic energy, the lower sound speed of the oil relative to water was expected to produce some refraction that tends to make the actual focal distance shorter than the geometric focus defined by the spherical curvature of the transducer. From its “home” position defined in the system software, the transducer was moved 17.5 mm closer to the membrane to reduce the acoustic propagation distance in oil. In this configuration, the aperture plane of the transducer was about 5 mm below the membrane. To minimize the impact of acoustic reflections from the surface of the degassed water, the water height was kept at a minimum of 230 mm above the membrane, which was about 130 mm above the geometric focus of the transducer.
Fig. 1.
Schematics of the experimental arrangement (color online): (a) the measurement configuration with a custom tank mounted to the patient table, and (b) a 2-D projection of the mathematically defined element locations from the transducer design. Note that a transducer-aligned z-coordinate is shown in the top illustration, where z = 0 is defined at the inverted “apex” in the center of the transducer.
Additional details of the transducer array are illustrated in Fig. 1b, which shows a 2-D projection of the element locations on a spherically curved surface. These positions are mathematically defined based on the array design. Specifically, the array comprises 256 elements arranged on a surface with a 120 mm radius of curvature. Each element is circular with a 6.6 mm diameter, while the aperture of the entire array is 127.8 mm. The array operated at a frequency of 1.2 MHz and its output levels were controlled in software by specifying an “ampvals” number. Ampvals is a label for a 12 bit variable used to control the voltage applied to each generator channel used to drive the array; although specific values are arbitrary, they are uniquely related to the source power and are reported here to describe the output level measured in a given configuration. For a generic Sonalleve V1 3.0T MR-HIFU system, Philips has correlated these ampvals indices to acoustic power levels using radiation force balance measurements. All measurements were performed by operating the array using custom sonication protocols that were programmed for this effort.
B. Hydrophone Measurements
The hydrophone measurements can be divided into two categories: calibration measurements used to define boundary conditions for modeling and validation measurements used for independent comparisons with the results of corresponding model calculations. Calibration measurements included both the construction of a 2-D acoustic hologram (i.e., the complex pressure distribution comprising magnitude and phase) and a series of pressure waveforms acquired at a single, near-source location (on-axis, 40 mm proximal to the focus) as a function of the ampvals index used to control the array. Independent validation measurements included the acquisition of focal waveforms and scans of the focal region at various output power levels. The primary goal was to characterize basic array operation with no off-axis steering of the beam; accordingly, calibration measurements for this configuration included both holography data and near-source pressure waveforms. A separate hologram was measured for a configuration in which the beam was steered to shift the focus 8 mm off-axis, while the scaling of power output as a function of ampvals was presumed to match that for the no-steering case. Validation measurements were collected in both no-steering and steering configurations.
All hydrophone measurements were performed using a custom LabVIEW program (National Instruments; Austin, TX, USA) running on a personal computer. The program coordinated movement of the hydrophone using a 3-D positioner (NF90 motor controllers, Velmex, Inc.; Bloomfield, NY, USA); triggering of the HIFU array using a function generator (Model 33250A, Agilent Technologies, Inc.; Santa Clara, CA, USA); and capturing of the hydrophone signal using a digital oscilloscope (Model LT344, LeCroy Corp.; Chestnut Ridge, NY, USA). Digitized measurement data were saved to disk and later processed in Matlab (MathWorks; Natick, MA, USA).
Two different hydrophones were used to accommodate both low-amplitude and high-amplitude waveforms. All of the calibration measurements were conducted at low amplitudes and utilized an HGL-0200 capsule hydrophone in conjunction with an AH-2020 preamplifier set at 0 dB gain (Onda Corporation; Sunnyvale, CA, USA). The capsule hydrophone was also used for some validation measurements designed to evaluate the linear field structure in the focal region. This hydrophone is designed for measurements from 1–20 MHz and pressures up to several megapascals at the array’s operational frequency of 1.2 MHz. Its sensitive area is a PVDF film with a 200 μm diameter, implying minimal directivity effects at this frequency. For validation measurements at higher output levels, a fiber optic probe hydrophone (FOPH) was used (Model FOPH 2000, RP Acoustics; Leutenbach, Germany). This hydrophone measures changes from static pressure in the fluid at the tip of a 100 μm optical fiber and has a stated bandwidth up to 100 MHz. Because a new tip for the optical fiber can be easily cleaved, accumulated mechanical damage is not a concern. However, though the FOPH is very well suited for measuring large pressures, it is relatively insensitive with a noise floor of a few megapascals.
Two well-known equations were used for absolute calibration of the FOPH hydrophone: the Gladstone-Dale equation to relate the optical index of refraction in water to density, and the Tait equation to relate density and pressure [21]. Here, all FOPH measurements were conducted with the axis of the fiber roughly parallel to the acoustic axis, using a slight angle (~5–10 degrees) to minimize the length of fiber in the focal region. As noted by the manufacturer, oblique incidence of an incoming wave primarily limits the FOPH bandwidth in terms of the time needed for the wave to traverse the fiber tip. Hence the 100 μm fiber diameter in water at an angle of 10 degrees would only be able to resolve a shock rise time of about 12 ns, whereas the full 100 MHz bandwidth implies a capability to measure 5 ns rise times. Because 12 ns is still much less than the fundamental period of the waveform at 1.2 MHz, the slight inclination of the fiber and associated bandwidth limitations should not have affected measurements appreciably in terms of peak pressure values or overall waveform shapes. Aside from directivity considerations, other diffraction effects at the fiber tip [25] were considered in that measured waveforms were deconvolved using time-domain impulse-response data provided by the manufacturer.
Using the FOPH as a reference standard, measurements made with the capsule hydrophone were calibrated by matching a low-amplitude focal waveform measured with the FOPH to a waveform generated by a simulation that used boundary conditions from a hologram measured with the capsule hydrophone. This approach yielded a sensitivity of 2.88 · 10−8 V/Pa at 1.2 MHz for the capsule hydrophone, which was independently confirmed through a direct comparison of focal waveforms measured by both hydrophones in a separate laboratory configuration.
Acoustic holography measurements of pressure magnitude and phase were carried out using the capsule hydrophone. This method has been described in detail for characterizing medical ultrasound sources operating in continuous wave (CW) or transient modes [24], [26]. Here, pulses lasting 85 acoustic cycles were used to represent CW conditions while minimizing the impact of acoustic reflections within the water tank. Such pulses were repeatedly triggered and corresponding waveforms were collected in a plane transverse to the acoustic axis, 40 mm in front of the focal maximum (which was about 55 mm from the transducer’s aperture plane). The measurement scan required about 6 hours to complete and covered an 86.4 mm square in steps of 0.6 mm for a total of 21025 measurement locations. Because the 0.6 mm step size is less than half of a wavelength at 1.2 MHz, the possibility of spatial aliasing was eliminated. Measured waveforms were saved to disk and later processed to define a hologram: First, an analysis window lasting for 10 acoustic cycles and beginning 84 μs after initiation of the pulse was identified. Then these acoustic cycles were analyzed by Fourier transform to determine pressure magnitude and phase at 1.2 MHz. Given the basic idea of holography, the timing of this analysis window was selected to capture waves originating from anywhere on the transducer surface at each measurement point.
From the measured holograms, a number of properties of the linear acoustic fields produced by the array were interpreted. Based on well-known solutions of the Helmholtz equation, calculations were implemented using either the Rayleigh integral or the angular spectrum approach. The Rayleigh integral can be interpreted to consider each measurement location in the hologram as a point source so that the integral sums contributions from all locations. This approach is particularly useful for evaluating the acoustic field on curved surfaces [27] and was used here to visualize source holograms at the transducer surface [24]. The angular spectrum is based on the idea that an arbitrary acoustic field can be decomposed into a superposition of plane waves propagating at different angles, where the angles are represented by different spatial frequencies. This method is computationally efficient for acoustic propagation between parallel planes [28] and was used here to evaluate the acoustic powers represented by measured holograms [29]. With this approach, true acoustic powers were calculated without assuming that the field comprised a plane wave.
C. Nonlinear Acoustic Propagation Model
A 3-D model based on the Westervelt equation was implemented to simulate the nonlinear acoustic field produced by the array at different output levels, including the effects of nonlinearity, diffraction, and absorption in the focused ultrasound beam [30]. Details of the model geometry and the numerical algorithm have been presented in an earlier paper [23]. For completeness, the model and its implementation are briefly summarized here. First, the Westervelt equation is written in a retarded time coordinate:
| (1) |
Here p is the acoustic pressure, z is the spatial coordinate along the beam axis, t is time, and τ = t−z/c0 is the retarded time. In addition, Δp = ∂2p/∂x2 + ∂2p/∂y2 + ∂2p/∂z2, where x and y are spatial coordinates perpendicular to z. Finally, ρ0, c0, β and δ are the density, ambient sound speed, nonlinearity coefficient, and diffusivity of sound of the medium, respectively. Values of the physical parameters in Eq. (1) were chosen to represent the experimental measurement conditions in water at room temperature: ρ0 = 998 kg/m3, c0 = 1485 m/s, β = 3.5, δ = 4.33 · 10−6 m2/s.
The boundary condition to the model (1) was set at the plane (x, y, z = 0) at the apex of the source [see Fig 1(a)] as a pressure distribution determined from the experimentally measured hologram. The distribution was calculated using the angular spectrum method to linearly backpropagate the field represented by the hologram. As described in the previous section, near-source hydrophone data were acquired over a range of array output levels to calibrate the power output relative to the hologram measured at a low power. The pressure magnitudes at z0 = 0 were scaled according to these calibration measurements and nonlinear forward propagation was then simulated starting from this plane. Note that in all simulations of nonlinear forward propagation, the presence of oil surrounding the transducer was neglected so that propagation only occurred in water. This simplification is justified because propagation far from the focal region is virtually linear and the physical propagation path in oil was short. As such, the development of superharmonic content during propagation occurred in water rather than in oil. In addition, because the boundary conditions were calculated from a hologram measured in water, this approach inherently accounts for any refraction at the oil-membrane-water interface.
The numerical solution to Eq. (1) was calculated sequentially, passing from a plane (x, y, z = z1) to a plane (x, y, z = z1 + Δz) with a step size of Δz, following the method of fractional steps with an operator splitting procedure of second order [31]–[33]. According to this method, Eq. (1) was divided into simpler equations for diffraction,
| (2) |
nonlinearity,
| (3) |
and absorption,
| (4) |
If one denotes the action of the diffraction operator over the step Δz as ΓD,Δz, and the combined action of the nonlinearity and absorption operators as ΓN+A,Δz, then the scheme of applying the splitting method can be represented as follows:
| (5) |
To efficiently implement the model with these split operators, both time-domain and frequency-domain representations of the acoustic field were used. In the frequency domain, the solution to Eq. (1) was represented in the form of a finite Fourier series expansion of harmonic components:
| (6) |
Transitions between the time and frequency domains were accomplished using fast Fourier transform (FFT) routines from the FFTW library.
The diffraction operator (2) was calculated in the frequency domain for each harmonic component with the angular spectrum method, using 2-D FFTs in spatial coordinates [32]–[34]. According to this method, the complex pressure magnitude of the n-th harmonic in the plane (x, y) at axial position z was transformed by FFT into a two-dimensional spectrum with spatial frequencies (kx, ky). The angular spectrum components at the next propagation step were calculated by multiplying the spectrum by the corresponding phase factor
| (7) |
where kn = nω/c0 is the wavenumber of the n-th harmonic. As the coordinate z changed and the amplitudes of high-frequency components of the wave spectrum increased, the step size Δz was decreased to improve accuracy. Specifically, for the wavelength λ at the fundamental frequency, Δz = 0.2λ was used near the transducer and Δz = 0.1λ was used in the focal region (i.e., where 0.8F < z < 1.2F for focal distance F). Increasing the diffraction step size in the focal region by a factor of two led to only a 0.5% difference in the peak positive pressures of focal waveforms.
The combined action of the nonlinearity and absorption operators in Eq. (5) was calculated using the same second-order fractional step algorithm by dividing the step Δz into smaller substeps dz: Δz = dz + dz + … + dz = m × dz. In this way, the corresponding evolution operator is calculated by applying alternately the absorption and nonlinear operators:
| (8) |
Here, the nonlinear operator ΓN,dz is applied m times, the absorption operator ΓA,dz is applied m − 1 times, and ΓA,dz/2 is applied twice, at the beginning and at the end. Unlike the diffraction splitting, m substeps dz of the main step Δz were introduced to increase simulation accuracy [32]. The number of substeps m within a given step varied as a function of the axial position z: in the vicinity of the transducer m = 2 was used, while m = 8 was used in the focal region. With a diffraction step size of 0.2λ everywhere, decreasing the number of nonlinear substeps in the focal region from m = 8 to m = 4 produced only a 0.2% difference in the peak positive pressures of focal waveforms.
The nonlinear operator (3) at each node of the mesh over the transverse spatial coordinates was calculated using one of two algorithms. At small distances from the source, the integration was performed in the frequency domain using a fourth-order Runge-Kutta method for the set of nonlinear coupled equations for harmonic amplitudes [35]:
| (9) |
where denotes the complex conjugate harmonic amplitude. Since the number of operations in this algorithm is proportional to the squared number of harmonics N, it is quite efficient when a relatively small number (several tens) of harmonics are considered. To shorten the calculation time, additional harmonics were introduced into the algorithm gradually, as the wave spectrum broadened with increasing propagation distance z. For initial steps, from z = 0 to the aperture plane of the array, the nonlinear operator was applied only at transverse grid points that were located “inside” the spherical surface representing the physical transducer. As the steepness of the wave profile increased and more harmonics were required, the nonlinear algorithm was changed to a conservative time-domain Godunov-type scheme. The switch to the Godunov-type scheme was made at a distance z where the amplitude of the 10th harmonic exceeded 1% of the amplitude at the fundamental frequency. Because the number of operations in this algorithm is proportional to the number of time points, simulations are more efficient for waveforms with many harmonics. Specifically, it is possible to simulate diffracting acoustic beams with shocks by using only five to seven grid points at the shock [36], [37].
Finally, the absorption operator (4) was calculated in the frequency domain using an exact solution for each harmonic:
| (10) |
where ωn is the angular frequency of the n-th harmonic.
Numerical simulations of three-dimensional nonlinear acoustic fields using the numerical method presented above are computationally intensive, requiring long calculation times and large allocations of memory (RAM). In order to reduce memory requirements, the storage of harmonic amplitudes in memory was optimized by storing only several harmonics at the periphery of the beam and larger numbers near the focus. For typical simulations reported here, 500 harmonics were used in the focal region. A more detailed description of this optimization technique can be found in [23]. As a rule, 32–72 GB of RAM were sufficient to perform the simulations even when 100 MPa shocks were present in the focal region. The computational time required for cases with shocked focal waveforms was about 1–2 days.
D. Reconciliation of Measurement and Modeling Coordinates
Nonlinear acoustic fields can have highly localized focal regions where pressure waveforms are extremely sensitive to small changes in position. Moreover, as intensities increase, the location of maximum pressure within a focused field shifts slightly away from the transducer. Consequently, comparing measured and simulated waveforms at different intensities requires a careful approach for identifying equivalent positions within the field.
Coordinates for measurements were naturally defined to coincide with the axes of the 3-D positioner, with the origin located at the acoustic focus. For holography measurements, the linear acoustic focus was located with no beam steering, and then the center of the scan plane was found by moving 40 mm toward the transducer. Considering z′ as the positioner axis roughly aligned with the axis of propagation (no steering), this position was then defined in millimeters as (x′, y′, z′) = (0, 0, −40). Similarly, focal waveforms at high output levels with the fiber optic hydrophone were acquired at the ‘origin’ of the spatial maximum of the peak positive pressure. Because the location of this maximum (i.e., the nonlinear focus) changed with the array power, description of this ‘origin’ requires specification of the output level at which it was found. Here, the location of the nonlinear focus was identified at 820 ampvals for the case with no steering, while 1200 ampvals was used for the steering case. All focal waveforms from measurements and modeling are reported at these two locations.
Because model boundary conditions are determined from holography measurements, the definition of separate coordinates aligned to the physical transducer is not strictly necessary. The measured hologram can be backprojected to define a source hologram at the approximate location of the transducer, and nonlinear forward propagation proceeds from there. Because acoustic amplitudes remain small and nonlinear effects are negligible near the transducer, small variations in the position and orientation of the source hologram relative the transducer are not important. However, the approximate location of the transducer in the measurement coordinates should be known. Because the measured hologram contains information about the entire 3-D field, the transducer position and orientation can be ascertained from backprojection calculations. Here, the proper backprojection distance was identified as the distance where the source hologram appears as a focused image with sharp edges. Similarly, the approximate angular orientation of the source hologram was found by considering the backprojected phase, which should be the same at the centers of array elements (or recognizably controlled for beam-steering applications). In addition, because the transducer was focused, the orientation of the acoustic axis relative to measurement coordinates was deduced from the position of the acoustic focus as determined from forward projections of the measured hologram.
Although not strictly necessary, it is natural to describe the acoustic field in terms of coordinates aligned with the transducer rather than more arbitrary coordinates associated with a positioner apparatus. Such a coordinate system with its origin at the transducer apex is partially depicted in Fig. 1(a). Where possible, modeling results are reported in this coordinate system, where the transducer-aligned axes are described by the unprimed coordinates (x, y, z). Elsewhere, measurement results are presented in the primed coordinates that correspond to the 3-D positioner used in the experiments.
III. Results
Hydrophone measurements and model calculations were used to determine performance characteristics of the array for a range of operating output power levels and for two different steering conditions of the focused beam. The next two subsections present results for conditions with no beam steering, including calibration measurements used to define model boundary conditions, nonlinear acoustic fields predicted by modeling, and independent validation measurements. In the last subsection, these results are compared against those obtained under conditions with beam steering.
A. Linear Acoustic Field – Calibration Measurements for Model Initialization
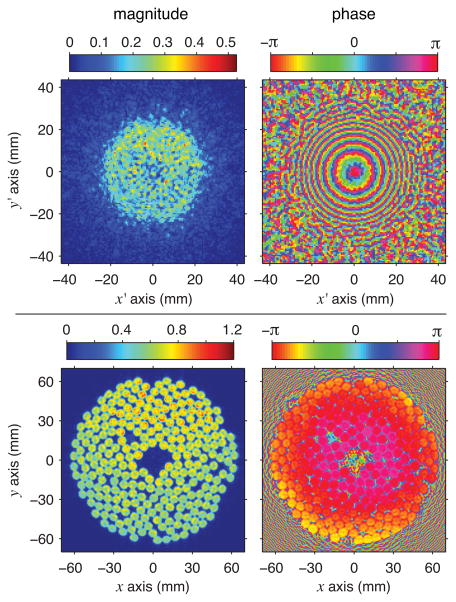
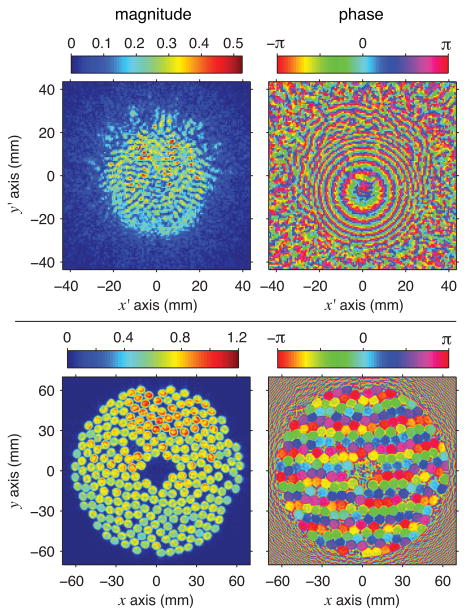
A hologram was measured and then backpropagated using the Rayleigh integral approach to define a source hologram as the pattern of vibrations at the transducer’s surface. Fig. 2 depicts the source hologram as a distribution of normal acoustic velocities, where refraction at the oil-membrane-water interface was accounted for by considering separate propagation steps in water and in oil. Note that while refraction was considered to achieve the clearest visualization of the vibration pattern, reflections at this interface were neglected so that the source hologram displays relative values of acoustic velocity rather than absolute ones.
Fig. 2.
Holograms representing the continuous-wave linear acoustic field with no beam steering (color online): measured pressure hologram in megapascals (top) and source hologram calculated by backpropagating the acoustic field to the surface of the transducer (bottom). Note that the source hologram depicts acoustic velocity normal to the transducer surface, with magnitudes normalized relative to the maximum value.
At the proper position in 3-D space, such source holograms should appear to be in focus, where the edges of individual elements are sharply defined. With assumed sound speeds in water and oil of 1485 and 1380 m/s respectively, the source hologram shown in Fig. 2 was calculated using backpropagation over a distance of 73.5 mm. In this hologram, individual elements are clearly seen and the absence of one element in the upper-left quadrant can be readily identified. This missing element corresponds to a damaged connector pin that was previously known. The phase of the source hologram is approximately axisymmetric, but not exactly uniform as would be expected for conditions with no beam steering. The radial phase variations were likely caused by sagging of the membrane under the weight of the water above it. Because the backpropagation presumed a flat membrane, any sagging would lead to the appearance of phase variation at the transducer surface. Moreover, because phase is quite sensitive to alignment errors, the phase axisymmetry in the source hologram suggests good alignment between the holographic measurement plane and the physical orientation of the transducer array.
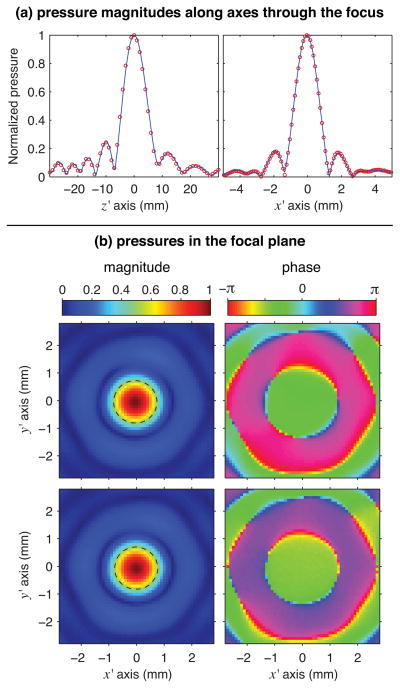
Forward propagation of the measured hologram was used to determine the 3-D structure of the linear acoustic field in the focal region as shown in Fig. 3, where holography-based calculations are compared directly against independent hydrophone measurements. In these plots, pressures are normalized relative to the peak pressure value in the measurements and the x, y, and z coordinates are indicated relative to the position of the focal maximum. These comparisons show that the field structure captured by the hologram is virtually the same as that measured directly by hydrophone. In Fig. 3a, the beamwidths and the locations of the nulls match almost exactly, while the focal planes in Fig. 3b show the same characteristic patterns that are not quite axisymmetric.
Fig. 3.
Comparison of the structure of the linear acoustic field as measured directly with a capsule hydrophone and as calculated from a 2-D hologram measured separately (color online). (a) Along focal axes with coordinates plotted relative to the pressure maximum, calculated pressure magnitudes are shown as solid lines and independent measurement data as circles. (b) In the focal plane, pressure magnitude and phase are either calculated from a hologram measured pre-focally (top) or directly measured (bottom). The dashed line in each magnitude plot is a contour marking the −6 dB focal region.
Field projections using a resolution of 0.1 mm show the exact location of the focus at a distance of 39.8 mm from the measurement plane. Given the backpropagation distance of 73.5 mm, the true linear focal distance of the transducer is estimated to be 113.3 mm. This distance is considerably shorter than the geometric focal distance of 120 mm and is readily explained by refractive effects at the oil-membrane-water interface. The focal maximum implied by the measured hologram remained on-axis, confirming minimal alignment error between the positioner and the source transducer. Given the stated 0.1 mm resolution and a projection distance of 40 mm, the alignment error was less than 0.2°.
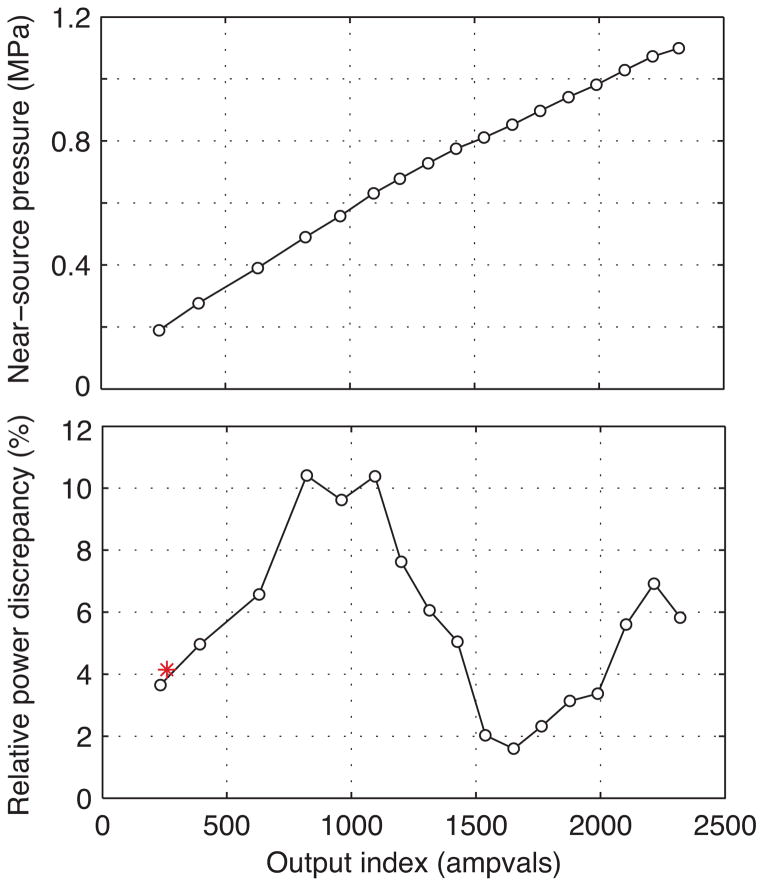
Additional single-point, near-source hydrophone data were acquired to quantify pressure amplitudes at the array elements at different array output levels. Measurement results are shown in Fig. 4, where pressure magnitudes at the fundamental frequency of 1.2 MHz are plotted as a function of the ampvals output index (top). The correlation is predominantly linear, especially at lower output levels, which suggests that the ampvals label corresponds to an extent with the driving voltage applied to each transducer element. The slight deviation from linearity at higher output levels may have been caused in part by nonlinear propagation effects. Data were acquired on-axis and 40 mm proximal to the focus, where the ratio of the magnitude of the second harmonic to the fundamental was 0.10 at 1426 ampvals and 0.15 at 2321 ampvals. However, other factors such as non-ideal electronics may have contributed to the deviation from linearity: The Philips system reported electric powers actually generated, and these powers should be effectively proportional to pressure squared. Although electric powers were clearly not influenced by nonlinear acoustic propagation, plotting their square root versus ampvals exhibits a similar deviation from linearity as shown in the plot.
Fig. 4.
Calibration of the acoustic power output of the array using a series of near-source pressure measurements at a single point (color online). Measured pressure (top) and relative difference between measured and nominal power levels normalized to the nominal level (bottom) are plotted as a function of the ampvals settings. Measured powers were determined by using single-point, near-source measurements to scale the power represented by a measured hologram at 259 ampvals (denoted by the asterisk); nominal powers were specified by Philips. Selected values are listed in Table I.
Representative values of the near-source measurements along with corresponding parameters used in setting model boundary conditions are listed in Table I. First, each “ampvals” value corresponds to a nominal output acoustic power as determined from radiation force balance measurements performed by Philips for a generic Sonalleve V1 3.0T MR-HIFU system. To determine “measured” acoustic powers for different settings, the power of the measured hologram at 259 ampvals (Fig. 2) was calculated using an angular spectrum approach [29] and then scaled based on relative pressure changes from the near-source measurement data. Figure 4 (bottom) shows the discrepancy between the measured acoustic powers and the nominal powers provided by Philips, expressing the difference as a percentage of the nominal power. As such, output powers were about 2–10% higher than the nominal values. The acoustic powers reported here were calculated for an arbitrary acoustic beam rather than for plane-wave propagation parallel to the acoustic axis. For this array, an assumption of plane-wave propagation would overestimate the true acoustic power by about 10%.
TABLE I.
Array output conditions
| Array setting [ampvals] | Nominal acoustic power [W] | Measured near-source pressure [MPa] | Power from measured hologram [W] | Source pressure [hologram units] | Nominal source intensity I0 [W/cm2] | Nominal source pressure p0 [MPa] |
|---|---|---|---|---|---|---|
|
| ||||||
| 259 | 28.4 | 0.21 | 29.6 | 1.00 | 0.34 | 0.10 |
| 233 | 24.0 | 0.19 | 24.9 | 0.92 | 0.29 | 0.09 |
| 392 | 50.8 | 0.28 | 53.4 | 1.34 | 0.61 | 0.13 |
| 629 | 100 | 0.39 | 107 | 1.90 | 1.22 | 0.19 |
| 820 | 152 | 0.49 | 168 | 2.38 | 1.92 | 0.24 |
| 1094 | 252 | 0.63 | 278 | 3.06 | 3.19 | 0.31 |
| 2103 | 700 | 1.03 | 740 | 5.00 | 8.48 | 0.50 |
| 2321 | 799 | 1.10 | 846 | 5.35 | 9.70 | 0.54 |
Additional columns in Table I are convenient for characterizing the output of the array. Corresponding to the measured powers listed in the fourth column, the fifth column presents factors used to scale the measured hologram for setting boundary conditions to the model. The remaining two columns to the right define convenient parameters at the surface of the transducer. First, a nominal source intensity I0 is defined by dividing the total array power from the fourth column by the area of the 255 active elements. From I0, a characteristic source pressure p0 is then defined by assuming a uniform plane wave over the surface of each element – i.e., , where ρ0 and c0 are taken as the density and sound speed of water.
B. Nonlinear Acoustic Fields – Model Simulations and Validation Measurements
The results of nonlinear acoustic modeling with boundary conditions determined from a source hologram are presented below. These results enable a full assessment of the 3-D field under operating conditions that are challenging to measure directly. To validate the numerical model, focal waveforms from simulations are compared to direct fiber optic hydrophone measurements for nominal acoustic powers ranging from 25 W to 800 W. Comparisons are also made between simulated and measured peak pressures both in the focal region for selected output levels and at the focus over the total range of the operating power outputs. Model predictions relied only on measured or known parameters (e.g., the thermophysical properties of water); these parameters were not iteratively adjusted toward effective values as is necessary in approaches relying on more simplified boundary conditions for the source [21], [22].
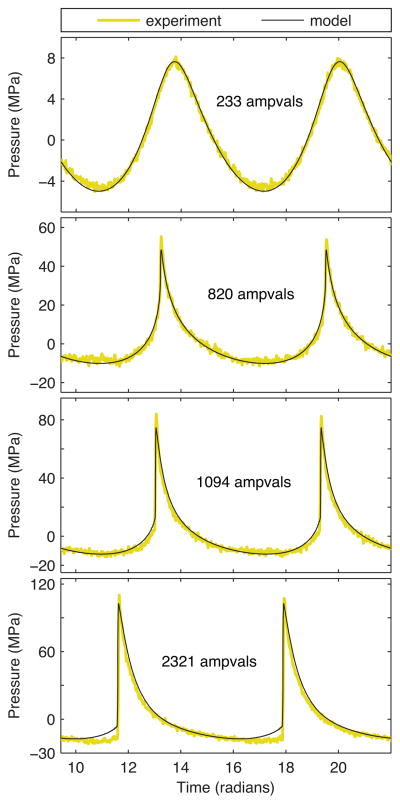
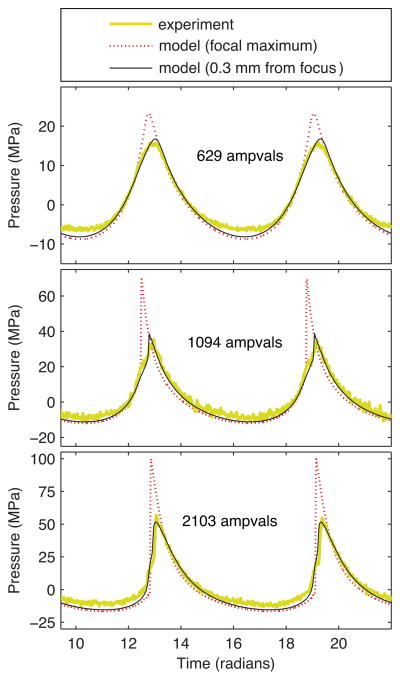
Representing the range of output levels listed in Table I, several experimentally measured and simulated waveforms are presented in Fig. 5. These simulations show good agreement with the FOPH data for both quasilinear and shocked waveforms. The most notable discrepancy occurs at the highest output level (2321 ampvals), where the negative pressure magnitude preceding the shock is larger in the FOPH data. For a waveform with such a large shock amplitude in excess of 100 MPa, it is not clear whether the discrepancy is caused by inaccuracies in the FOPH behavior or unexpected operating conditions that are not captured by the model. For instance, if the array’s amplifier behaved nonlinearly at high powers, harmonics not represented by the source hologram in Fig. 2 would be present at the transducer surface and result in additional distortion of the focal waveform.
Fig. 5.
Comparison of focal waveforms with no beam steering (color online). Experimental waveforms were measured directly with a fiber optic hydrophone. Simulated waveforms utilized boundary conditions defined by calibration measurements for the power level (Fig. 4 and Table I) in combination with a source vibration pattern based on the source hologram (Fig. 2).
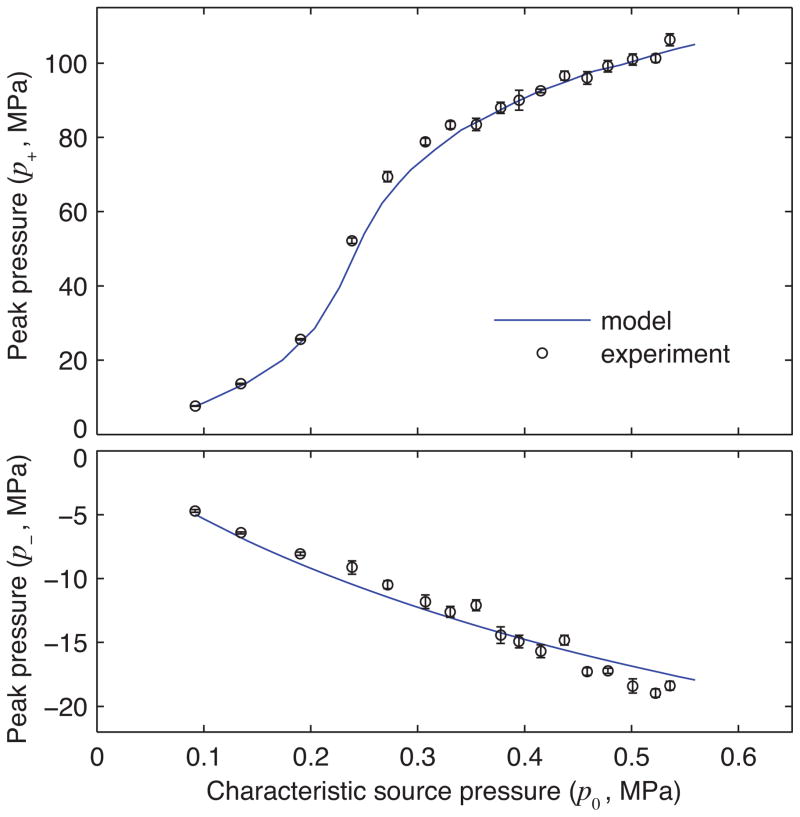
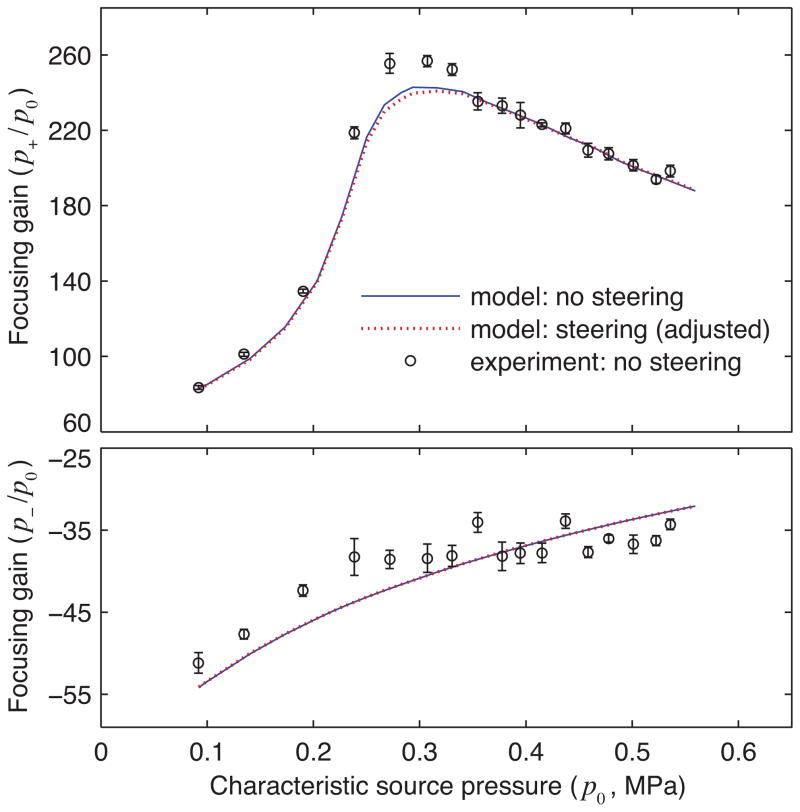
To summarize validation comparisons of simulations and measurements, peak positive and negative pressures are plotted in Fig. 6 over the range of all measured output levels. The output levels are shown here in terms of the nominal source pressure p0 described in Table I. Experimental data were analyzed by averaging peak values over 8 acoustic cycles; mean values are plotted as circles, while vertical error bars depict the mean ± one standard deviation. Note that the first three experimental data points exhibit relatively small standard deviations because multiple waveforms were averaged during acquisition to minimize the noise inherent to the FOPH (20 averages at 233 ampvals; 10 averages each at 392 and 629 ampvals). At higher output levels where the signal-to-noise ratio was naturally improved, averaging was avoided to decrease the exposure time given concerns about cavitation at the tip of the FOPH.
Fig. 6.
Summary of waveform comparisons between simulations and measurements with no beam steering (color online): peak positive (top) and negative (bottom) pressures at the focus are plotted against the source pressure output. Experimental peak values are represented as a mean value ± one standard deviation over 8 acoustic cycles.
For peak positive pressures, simulations and measurements show very good quantitative agreement. They both track the formation of shocks as indicated by the steep slope in the curve near p0 = 0.25 MPa. Across the entire range of output levels, simulation results remain within 6 MPa of the corresponding measurement data averaged over 8 acoustic cycles. Normalized to the measured values, the largest discrepancy of about 10% occurs in the region where shocks develop and pressure amplitudes are very sensitive to the source pressure p0. Away from this region, the relative discrepancies are considerably smaller. For peak negative pressures, simulations also track consistently with experimental data. The differences between simulated and measured values remain less than 2 MPa, with the largest relative discrepancy at 14%.
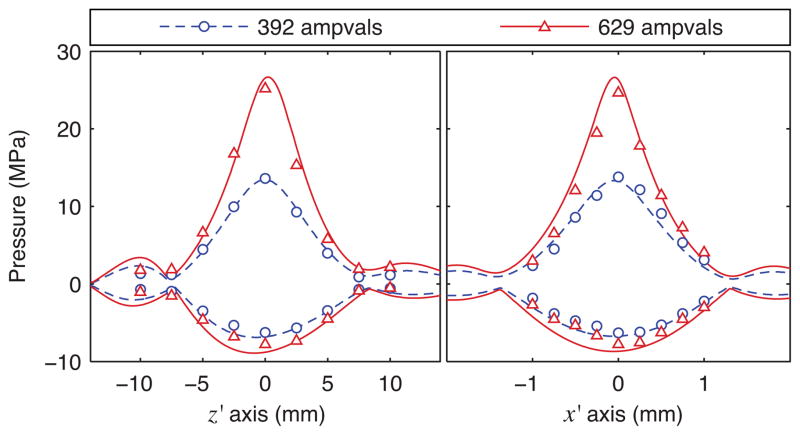
To directly assess the impact of nonlinear propagation on the size of the focal region, simulation results were compared to measurements performed by scanning the FOPH along axial and transverse lines through the focus. Accordingly, beam profiles for simulations and independent measurements are plotted in Fig. 7 for two relatively low output levels. These profiles demonstrate that nonlinear propagation effects lead to smaller peak-positive and larger peak-negative focal regions [16], [21]. This behavior is quantitatively captured in both simulations and independent measurements. For example, from the calculated solid lines in the plots in Figs. 3 and 7, the −6 dB beamwidths in the x direction for positive pressure are 1.56 mm, 1.24 mm, and 0.96 mm for linear propagation and nonlinear propagation at 392 and 629 ampvals, respectively. In contrast, the corresponding −6 dB beamwidths for negative pressure are 1.56 mm, 1.81 mm, and 1.88 mm.
Fig. 7.
Beam profiles along axes passing through the focus (no beam steering) (color online). The dashed and solid lines represent the peak positive and peak negative pressures based on modeled waveforms. The circles and triangles represent experimental data. In each plot, data for two power levels are included, where 392 and 629 ampvals correspond to nominal acoustic powers of 50 and 100 W respectively.
C. Comparison of Acoustic Fields with and without Beam Steering
Results from calibration measurements and nonlinear modeling are presented below for the case in which the focus was steered −8 mm off-axis in the y direction, which is the maximum amount of steering typically recommended by Philips for this array. For the same output level of 259 ampvals used for the non-steering case, a hologram was measured and the corresponding source hologram was calculated (Fig. 8). In comparison with Fig. 2, the phase adjustments applied for steering are very clear in the source hologram. In addition, given that the velocity magnitudes are normalized to the same value for the source holograms in both figures, it is also clear that the power output was higher when steering was applied. Using an angular spectrum approach [29] to calculate power directly from the measured holograms, we find that the steering hologram represents 11% more acoustic power (i.e., about 5.4% higher source pressures) at the same ampvals setting. Because access time to the array was limited, calibration measurements for steering conditions were only performed to acquire holography data; it was assumed that relative changes in acoustic power as a function of ampvals would follow those measured for the no-steering case. This assumption was checked by monitoring the electric powers delivered to the array, which varied with ampvals similarly for both steering and no-steering conditions.
Fig. 8.
Holograms representing the continuous-wave linear acoustic field with beam steering -8 mm in the y direction (color online): measured pressure hologram in megapascals (top) and source hologram calculated by backpropagation (bottom). The source hologram depicts acoustic velocity normal to the transducer surface, with magnitudes normalized to the maximum in the no-steering case for direct comparison to Fig. 2.
Aside from output power levels, experimental measurements also determined the relative position of the linear focus for steering and no-steering conditions. While the nominal setting was to steer the focus 8 mm off axis from the natural in-phase focus, the actual focus was located at −7.4 mm in the transverse y direction and 1.5 mm further from the transducer in the axial z direction. This difference from the nominal setting likely occurred because the array utilized phase-shift calculations based on a soft-tissue sound speed of 1540 m/s instead of the actual value of 1485 m/s for water. In accord with this finding, the hologram from Fig. 8 also predicts the linear focal location at y = −7.4 mm.
Using the source hologram and the calibration of output levels summarized in the fifth column of Table I, nonlinear acoustic fields generated by the array over the range of operating power levels were simulated. Focal waveforms simulated with steering are compared to direct FOPH data in Fig. 9, showing that measured waveforms had considerably smaller peak positive pressures than those predicted by the model at the focal maximum. To explain this discrepancy, two possibilities were considered: actual output power levels were much lower than expected for a given ampvals index, or FOPH measurements were not performed at the actual focus despite careful alignment efforts. Because the near-source hydrophone measurements used to calibrate power levels (Fig. 4 and Table I) were made in the absence of beam steering, some additional uncertainty in the delivered power levels is reasonable. However, electric power levels reported by the array during the measurement of steered waveforms suggest that this uncertainty was much too small to explain the discrepancies between measurements and modeling. Considering a small inconsistency in the FOPH positioning, Fig. 9 shows that simulated off-axis waveforms at y = −7.7 mm match the measurements fairly closely across a range of output levels. Moreover, simulated waveforms in this off-axis region qualitatively agree with measured waveforms, which consistently exhibited a step-like shape rather than a single shock front at higher power levels. Aside from uncertainties in hydrophone positioning, hardware variability in controlling the amplitude and phase of each element with steering at high power levels may also have contributed to the discrepancies between simulations and measurements. Regardless of the reason, such uncertainties can lead to considerable underestimates of nonlinear focal pressures, which highlights a particular challenge of characterizing a 3-D field with a limited set of measurements.
Fig. 9.
Comparison of focal waveforms for the steering case (color online). Experimental waveforms were measured directly with a fiber optic hydrophone, while simulated waveforms utilized boundary conditions determined by the source hologram from Fig. 8 and power levels described by holography units from the fifth column in Table I. For model simulations, the focal maximum occurred at y = −7.4 mm, while waveforms at y = −7.7 mm approximately match the experimental data.
Though direct FOPH measurements likely did not capture the true focal pressures, the expected acoustic field under steering conditions can still be explored and compared with the no-steering case using model calculations. Despite the increased power in the steering hologram at the same ampvals setting, the linear focal pressure corresponding to this hologram was only 92% of that corresponding to the no-steering hologram. This discrepancy simply reflects that the array elements are arranged on a spherical surface, so that focusing is most efficient along the axis aligned to this surface. To facilitate the comparison of the gains, the steering hologram shown in Fig. 8 was first scaled by a factor of 1/0.92 = 1.087 to match the linear focal pressure without steering. This rescaled hologram was then used as a boundary condition for simulations at increased source output levels. Note that the pressure adjustment in terms of the nominal source pressure corresponds to a scaling factor of for the steering case.
To compare the acoustic fields with and without steering, focusing gains were considered by normalizing peak focal pressures to the corresponding nominal source pressure p0 as defined in Table I. Figure 10 shows focusing gains obtained from simulations of the two focusing configurations as well as from measurements for the no-steering case (same data as plotted in Fig. 6). Note that for the steering case, the simulated peak focal pressures were normalized by the same p0 used for the no-steering case even though the steering hologram was scaled to represent higher p0 values at the source. As such, this plot shows that once the array output level is adjusted to achieve the same linear focal pressure, nonlinear focusing is quantitatively similar with and without steering.
Fig. 10.
Focal gains determined from both direct FOPH measurements and modeling (color online). The data shown in Fig. 6 are included along with steering simulations. Peak pressures at the focus are normalized to the corresponding nominal source pressure p0 for no-steering case. Note that the adjusted p0 was used in the boundary conditions for the steering case to account for the increased output level required to achieve the same linear focal pressure as measured without steering.
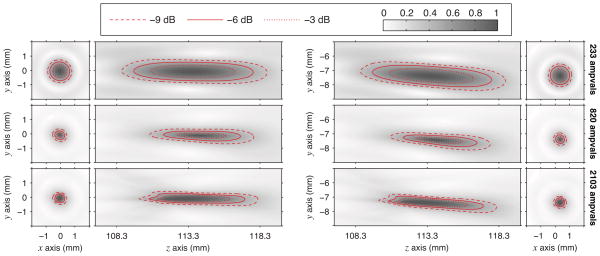
For completeness, a final comparison of the shapes of the nonlinear focal regions with and without steering was made. Such a comparison of simulations for an axial plane through the focus is depicted in Fig. 11 for peak positive pressures and in Fig. 12 for peak negative pressures. In both figures, the steering simulations adopt the same source-pressure adjustment used in Fig. 10. Figures 11 and 12 show that the size of the focal region tracks inversely with the gains plotted in Fig. 10. For positive pressures, the minimum spot size occurs at the intermediate output level of 820 ampvals; conversely, the spot size for negative pressures continues to increase with the output level. The sizes and shapes of focal regions are quite similar under both steering and no-steering conditions. This similarity was expected given the consistency of focal gains depicted in Fig. 10. Note again that Figs. 10–12 represent focal gains and regions that include source pressures that were augmented by 14.5% for steering conditions; the true focal gains with steering are lower.
Fig. 11.
From simulations without steering (left column) and with steering (right column), peak positive pressures in an axial plane through the focus are plotted at three different power levels (color online). Each plot depicts values normalized to the maximum as a grayscale intensity, while three contour lines are added for clarity. Steering simulations utilized the same adjusted source pressures as in Fig. 10.
Fig. 12.
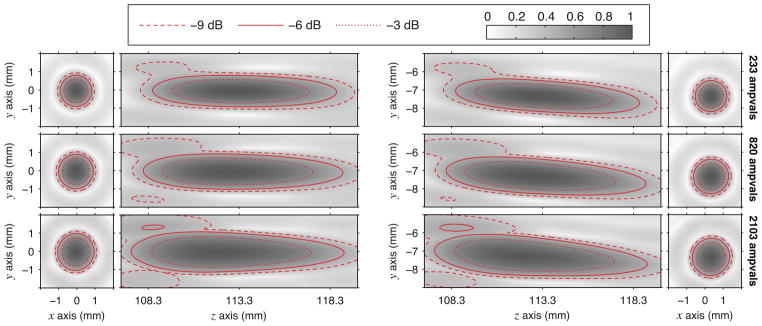
A corollary to Fig. 11 for negative pressures (color online).
IV. Discussion and Conclusions
An approach using a combination of measurements and modeling was described for quantitatively characterizing the acoustic fields generated by HIFU sources. This approach utilizes linear field measurements to quantify the acoustic output level and to capture the pattern of vibrations at the transducer surface with acoustic holography. Such calibration measurements were then used to define boundary conditions for a 3-D nonlinear acoustic model based on the Westervelt equation. Finally, nonlinear simulations were carried out to obtain detailed characteristics of the array field over its range of operational power settings. This combined approach was implemented and evaluated for a clinical HIFU array manufactured by Philips.
Results of this combined characterization approach were tested using independent hydrophone measurements. In the absence of beam steering, these complementary measurements confirm that the linear acoustic field is well represented by a measured hologram, and also that peak pressures and nonlinear waveforms are accurately modeled in the focal region. Simulations captured shock formation and quantitatively predicted shock amplitudes in excess of 100 MPa. A series of measurements and calculations performed for a steered beam also showed good agreement of focal waveforms with independent measurements. However, it appears that measurements of focal waveforms at high power levels may not have been made at the true focus despite careful attempts to align the hydrophone. Because shock amplitudes and peak positive pressures change significantly from 100 MPa to 50 MPa over a 0.3 mm change in the transverse coordinate, even a small misalignment could explain the discrepancy. Aside from operator error in positioning the hydrophone, it is also possible that non-ideal hardware performance led to small shifts in the true location of the steered focus at high powers. Such possibilities highlight a key challenge in characterizing nonlinear acoustic fields by direct measurement: results can be extremely sensitive to hydrophone positioning.
Because clinical transducer arrays can operate in various configurations and are generally complex, the potential is high for some variability in operational behaviors. At low acoustic amplitudes, such variabilities likely have little effect on the resulting acoustic field. However, nonlinear fields can be considerably more sensitive to variations in the source behavior. Though it may be extremely difficult to conduct accurate nonlinear measurements in such situations, simulations based on realistic boundary conditions can help to address such challenges by explicitly capturing the entire 3-D field.
In this effort, realistic boundary conditions were obtained by defining the pattern of surface vibrations of the array at the fundamental frequency by scaling in magnitude the holography measurement data acquired at a low output level. Though this is a reasonable approach that was quite successful for modeling focal waveforms even at high output levels, further development of the acoustic holography method would enable a more accurate representation of the source behavior to be captured at high output levels. Considering holography measurements that involve some content at higher harmonics (as expected at high outputs) and nonlinear backpropagation of the acoustic field to the transducer surface, such an implementation of “nonlinear holography” could be used to understand how the source behavior changes at high power levels [38].
This work demonstrates the feasibility of using a combination of measurements and modeling to characterize the acoustic fields of a clinical HIFU array source over a wide range of output levels. This approach can address the challenges of characterizing nonlinear HIFU fields in clinical situations and may be uniquely suited for meeting measurement standards that are being developed to ensure the clinical safety and efficacy of HIFU treatments.
Acknowledgments
The authors would like to thank Matti Tillander from Philips Healthcare for helpful discussions regarding the behavior of the Sonalleve V1 3.0T MR-HIFU system. We also thank Fran Olson from the Applied Physics Laboratory for design and construction of the water tank that was coupled to the patient table to permit acoustic measurements in a clinical setting. Finally, for helping to coordinate the experiments, we thank Dr. Shunmugavelu Sokka and David Brazzle from Philips Healthcare along with Dr. Baocheng Chu (Bio-Molecular Imaging Center) and Dr. Joo Ha Hwang from the University of Washington. Numerical simulations were performed on the SKIF “Chebyshev” and “Lomonosov” clusters of the Moscow State University supercomputer center.
The work was supported by the National Institutes of Health (EB007643 and DK43881), NSBRI through NASA NCC 9-58, and the Russian Foundation for Basic Research (11-02-01189 and 10-02-91062).
Contributor Information
Wayne Kreider, Email: wkreider@uw.edu, Center for Industrial and Medical Ultrasound, Applied Physics Laboratory, University of Washington, Seattle, WA USA.
Petr V. Yuldashev, LMFA UMR CNRS 5509, Ecole Centrale de Lyon, F-69134 Ecully Cedex, France. Physics Faculty, M. V. Lomonosov Moscow State University, Leninskie Gory, Moscow 119991, Russia
Oleg A. Sapozhnikov, Center for Industrial and Medical Ultrasound, Applied Physics Laboratory, University of Washington, Seattle, WA USA. Physics Faculty, M. V. Lomonosov Moscow State University, Leninskie Gory, Moscow 119991, Russia
Navid Farr, Center for Industrial and Medical Ultrasound, Applied Physics Laboratory, University of Washington, Seattle, WA USA.
Ari Partanen, Philips Healthcare, Cleveland, OH, USA.
Michael R. Bailey, Center for Industrial and Medical Ultrasound, Applied Physics Laboratory, University of Washington, Seattle, WA USA
Vera A. Khokhlova, Center for Industrial and Medical Ultrasound, Applied Physics Laboratory, University of Washington, Seattle, WA USA. Physics Faculty, M. V. Lomonosov Moscow State University, Leninskie Gory, Moscow 119991, Russia
References
- 1.Kremkau FW. Sonography Principles and Instruments. 8. St. Louis, MO: Saunders; 2011. [Google Scholar]
- 2.Hill CR, Bamber JC, ter Haar G, editors. Physical Principles of Medical Ultrasonics. 2. West Sussex, UK: John Wiley & Sons; 2004. [Google Scholar]
- 3.Rassweiler JJ, Knoll T, Koehrmann KU, McAteer JA, Lingeman JE, Cleveland RO, Bailey MR, Chaussy C. Shock wave technology and application: an update. Eur Urol. 2011;59(5):784–796. doi: 10.1016/j.eururo.2011.02.033. [DOI] [PMC free article] [PubMed] [Google Scholar]
- 4.Bailey MR, Khokhlova VA, Sapozhnikov OA, Kargl SG, Crum LA. Physical mechanisms of the therapeutic effect of ultrasound - (A review) Acoust Phys. 2003;49(4):369–388. [Google Scholar]
- 5.Xu Z, Hall TL, Fowlkes JB, Cain CA. Effects of acoustic parameters on bubble cloud dynamics in ultrasound tissue erosion (histotripsy) J Acoust Soc Am. 2007;122(1):229–236. doi: 10.1121/1.2735110. [DOI] [PMC free article] [PubMed] [Google Scholar]
- 6.Khokhlova TD, Canney MS, Khokhlova VA, Sapozhnikov OA, Crum LA, Bailey MR. Controlled tissue emulsification produced by high intensity focused ultrasound shock waves and millisecond boiling. J Acoust Soc Am. 2011;130(5 Part 2 SI):3498–3510. doi: 10.1121/1.3626152. [DOI] [PMC free article] [PubMed] [Google Scholar]
- 7.Harris GR. Progress in medical ultrasound exposimetry. IEEE Trans Ultrason Ferroelectr Freq Control. 2005;52(5):717–736. doi: 10.1109/tuffc.2005.1503960. [DOI] [PubMed] [Google Scholar]
- 8.Harris G. FDA regulation of clinical high intensity focused ultrasound (HIFU) devices. In: Worrell G, Pan X, Kim Y, He B, editors. Engineering in Medicine and Biology Society, 2009. EMBC 2009; Annual International Conference of the IEEE; 2009. pp. 145–148. [DOI] [PubMed] [Google Scholar]
- 9.Zeqiri B, Hodnett M. Measurements, phantoms, and standardization. Proc Inst Mech Eng Part H-J Eng Med. 2010;224(H2, SI):375–391. doi: 10.1243/09544119JEIM647. [DOI] [PubMed] [Google Scholar]
- 10.IEC/TS 62556 Ed. 1.0, Surgical systems – Specification and measurement of field parameters for High Intensity Therapeutic Ultrasound (HITU) transducers and systems. International Electrotechnical Commission; 2012. [Google Scholar]
- 11.Carstensen E, Becroft S, Law W, Barbee D. Finite-amplitude effects on the thresholds for lesion production in tissues by unfocused ultrasound. J Acoust Soc Am. 1981;70(2):302–309. [Google Scholar]
- 12.Carstensen EL, Dalecki D, Gracewski SM, Christopher T. Nonlinear propagation and the output indices. J Ultrasound Med; Workshop on the Effects of Nonlinear Ultrasound Propagation on Output Display Indices; Boston, MA. 20 Mar 1998; 1999. pp. 69–80. [DOI] [PubMed] [Google Scholar]
- 13.Szabo TL, Clougherty F, Grossman C. Effects of nonlinearity on the estimation of in situ values of acoustic output parameters. J Ultrasound Med; Workshop on the Effects of Nonlinear Ultrasound Propagation on Output Display Indices; Boston, MA. 20 Mar 1998; 1999. pp. 33–41. [DOI] [PubMed] [Google Scholar]
- 14.Filonenko EA, Khokhlova VA. Effect of acoustic nonlinearity on heating of biological tissue by high-intensity focused ultrasound. Acoust Phys. 2001;47(4):468–475. [Google Scholar]
- 15.Filonenko EA, Gavrilov LR, Khokhlova VA, Hand JW. Heating of biological tissues by two-dimensional phased arrays with random and regular element distributions. Acoust Phys. 2004;50(2):222–231. [Google Scholar]
- 16.Bessonova OV, Khokhlova VA. Spatial structure of high intensity focused ultrasound beams of various geometry. Phys Wave Phenom. 2009;17(1):45–49. [Google Scholar]
- 17.Soneson JE, Myers MR. Gaussian representation of high-intensity focused ultrasound beams. J Acoust Soc Am. 2007;122(5 Part 1):2526–2531. doi: 10.1121/1.2783124. [DOI] [PubMed] [Google Scholar]
- 18.Soneson JE, Myers MR. Thresholds for Nonlinear Effects in High-Intensity Focused Ultrasound Propagation and Tissue Heating. IEEE Trans Ultrason Ferroelectr Freq Control. 2010;57(11):2450–2459. doi: 10.1109/TUFFC.2010.1711. [DOI] [PubMed] [Google Scholar]
- 19.Bessonova OV, Khokhlova VA, Canney MS, Bailey MR, Crum LA. A derating method for therapeutic applications of high intensity focused ultrasound. Acoust Phys. 2010;56(3):354–363. doi: 10.1134/s1063771010030140. [DOI] [PMC free article] [PubMed] [Google Scholar]
- 20.Canney MS, Khokhlova VA, Bessonova OV, Bailey MR, Crum LA. Shock-induced heating and millisecond boiling in gels and tissue due to high intensity focused ultrasound. Ultrsound Med Biol. 2010;36(2):250–267. doi: 10.1016/j.ultrasmedbio.2009.09.010. [DOI] [PMC free article] [PubMed] [Google Scholar]
- 21.Canney MS, Bailey MR, Crum LA, Khokhlova VA, Sapozhnikov OA. Acoustic characterization of high intensity focused ultrasound fields: A combined measurement and modeling approach. J Acoust Soc Am. 2008;124(4 Part 1):2406–2420. doi: 10.1121/1.2967836. [DOI] [PMC free article] [PubMed] [Google Scholar]
- 22.Bessonova O, Wilkens V. Membrane hydrophone measurement and numerical simulation of HIFU fields up to developed shock regimes. IEEE Trans Ultrason Ferroelectr Freq Control. 2013;60(2):290–300. doi: 10.1109/TUFFC.2013.2565. [DOI] [PubMed] [Google Scholar]
- 23.Yuldashev PV, Khokhlova VA. Simulation of three-dimensional nonlinear fields of ultrasound therapeutic arrays. Acoust Phys. 2011;57(3):334–343. doi: 10.1134/S1063771011030213. [DOI] [PMC free article] [PubMed] [Google Scholar]
- 24.Sapozhnikov OA, Pishchal’nikov YA, Morozov AV. Reconstruction of the normal velocity distribution on the surface of an ultrasonic transducer from the acoustic pressure measured on a reference surface. Acoust Phys. 2003;49(3):354–360. [Google Scholar]
- 25.Krucker JF, Eisenberg A, Krix M, Lotsch R, Pessel M, Trier HG. Rigid piston approximation for computing the transfer function and angular response of a fiber-optic hydrophone. J Acoust Soc Am. 2000;107(4):1994–2003. doi: 10.1121/1.428483. [DOI] [PubMed] [Google Scholar]
- 26.Sapozhnikov OA, Ponomarev AE, Smagin MA. Transient acoustic holography for reconstructing the particle velocity of the surface of an acoustic transducer. Acoust Phys. 2006;52(3):324–330. [Google Scholar]
- 27.Cathignol D, Sapozhnikov OA. On the application of the Rayleigh integral to the calculation of the field of a concave focusing radiator. Acoust Phys. 1999;45(6):735–742. [Google Scholar]
- 28.Stepanishen PR, Benjamin KC. Forward and backward projection of acoustic fields using FFT methods. J Acoust Soc Am. 1982;71(4):803–812. doi: 10.1121/1.390975. [DOI] [PubMed] [Google Scholar]
- 29.Sapozhnikov OA, Bailey MR. Radiation force of an arbitrary acoustic beam on an elastic sphere in a fluid. J Acoust Soc Am. 2013;133(2):661–676. doi: 10.1121/1.4773924. [DOI] [PMC free article] [PubMed] [Google Scholar]
- 30.Westervelt P. Parametric acoustic array. J Acoust Soc Am. 1963;35(4):535–537. [Google Scholar]
- 31.Tavakkoli J, Cathignol D, Souchon R, Sapozhnikov O. Modeling of pulsed finite-amplitude focused sound beams in time domain. J Acoust Soc Am. 1998;104(4):2061–2072. doi: 10.1121/1.423720. [DOI] [PubMed] [Google Scholar]
- 32.Zemp R, Tavakkoli J, Cobbold R. Modeling of nonlinear ultrasound propagation in tissue from array transducers. J Acoust Soc Am. 2003;113(1):139–152. doi: 10.1121/1.1528926. [DOI] [PubMed] [Google Scholar]
- 33.Varslot T, Taraldsen G. Computer simulation of forward wave propagation in soft tissue. IEEE T Ultrason Ferr. 2005;52(9):1473–1482. doi: 10.1109/tuffc.2005.1516019. [DOI] [PubMed] [Google Scholar]
- 34.Christopher P, Parker K. New approaches to the linear propagation of acoustic fields. J Acoust Soc Am. 1991;90(1):507–521. doi: 10.1121/1.401277. [DOI] [PubMed] [Google Scholar]
- 35.Khokhlova V, Souchon R, Tavakkoli J, Sapozhnikov O, Cathignol D. Numerical modeling of finite-amplitude sound beams: Shock formation in the near field of a cw plane piston source. J Acoust Soc Am. 2002;110(1):95–108. [Google Scholar]
- 36.Kurganov A, Tadmor E. New high-resolution central schemes for nonlinear conservation laws and convection-diffusion equations. J Comput Phys. 2000;160(1):241–282. [Google Scholar]
- 37.Averiyanov M, Blanc-Benon P, Cleveland R, Khokhlova V. Nonlinear and diffraction effects in propagation of n-waves in randomly inhomogeneous moving media. J Acoust Soc Am. 2011;129(4):1760–1772. doi: 10.1121/1.3557034. [DOI] [PubMed] [Google Scholar]
- 38.Tsysar SA, Khokhlova VA, Kreider W, Sapozhnikov OA. Nonlinear acoustic holography for therapeutic source characterization. Book of Abstracts of the 12th International Symposium on Therapeutic Ultrasound; June 10–13, 2012; Heidelberg, Germany. 2012. p. 255. [Google Scholar]


