

Abstract
We examined whether the preparation of saccadic eye movements, when behaviorally dissociated from covert attention, modulates activity within visual cortex. We measured single-neuron and local field potential (LFP) responses to visual stimuli in area V4 while monkeys covertly attended a stimulus at one location and prepared saccades to a potential target at another. In spite of the irrelevance of visual information at the saccade target, visual activity at that location was modulated at least as much as, and often more than, activity at the covertly attended location. Modulations of activity at the attended and saccade target locations were qualitatively similar, and included increased response magnitude, stimulus selectivity, and spiking reliability, as well as increased gamma and decreased low frequency power of LFPs. These results demonstrate that saccade preparation is sufficient to modulate visual cortical representations and suggest that the interrelationship of oculomotor and attention-related mechanisms extends to posterior visual cortex.
Introduction
In order to efficiently interpret the sensory world, many species have evolved powerful orienting systems to select among multiple objects or features for enhanced processing. In primate vision, orienting involves shifting gaze in order to position the foveae on targets of interest, and this behavior requires using the visual parameters of the target (e.g. position, velocity, and shape) to guide gaze shifts. Each orienting movement thus necessarily involves the selection of one stimulus over all others prior to movement onset. Psychophysical studies in human subjects indicate that this selection is accompanied by attention, that is, enhanced detection and discrimination at the location of intended movements (Hoffman and Subramaniam, 1995). Furthermore, this deployment of attention can occur whether or not orienting movements are actually carried out (Posner, 1980); that is, selective attention can be either overt or covert.
Given the co-occurrence of gaze and attentional shifts, investigators have long debated whether the mechanisms underlying these two functions are dissociable (e.g. Moore et al., 2003). For example, while some studies have found that the preparation of saccadic eye movements (saccades) to a particular location is sufficient to improve psychophysical performance at that location, and therefore to direct attention, (Deubel and Schneider, 1996), others have found that saccade preparation can be dissociated from attention (Hunt and Kingstone, 2003). Thus, at present, the degree to which saccade preparation is sufficient to bring about changes in perceptual mechanisms remains controversial. In particular, it is not known whether saccade preparation is sufficient to modulate representations within the visual system, modulation thought to underlie the perceptual enhancements of selective attention (e.g. Reynolds and Chelazzi, 2004).
Ample neurophysiological evidence suggests that certain brain structures have roles in both overt and covert attention. The frontal eye field (FEF), the lateral intraparietal area (LIP), and the superior colliculus (SC), for example, appear to be involved both in saccade programming and in directing visual spatial attention. Several studies have shown that neural activity in these regions changes prior to saccades (FEF: Bruce and Goldberg, 1985; LIP: Barash et al., 1991; SC: Schiller and Stryker, 1972) as well as during covert spatial attention (FEF: Thompson et al., 2005; LIP: Bushnell et al., 1981; SC: Ignashchenkova et al., 2004). Furthermore, pharmacological inactivation of neurons in these areas affects saccades (FEF: Dias and Segraves, 1999; LIP: Liu et al., 2010; SC: Hikosaka and Wurtz, 1986) and covert attention (FEF: Wardak et al., 2006; LIP: Wardak et al., 2004; SC: Lovejoy and Krauzlis, 2010). However, more recent studies suggest that at the level of single neurons, saccades and attention are nevertheless dissociable. For example, within the FEF, only neurons functional classified as “visual” or “visuomovement” exhibit enhanced sensory responses at attended locations while “movement” neurons do not (Thompson et al., 2005). More importantly, only the enhanced responses of “visual” neurons become more synchronized with activity within area V4, suggesting that visual cortex receives only attention-related, but not saccade-related, signals (Gregoriou et al., 2012). An absence of saccade-related modulation within “ventral stream” areas such as V4 would also be consistent with the notion of separate processing streams for perception and action between ventral and dorsal visual areas, respectively (Goodale and Milner, 1992).
We sought to determine whether covert and overt attention are dissociable within visual cortex. We trained monkeys to perform a task in which the focus of covert attention was behaviorally dissociated from the target of an upcoming saccade. In the task, monkeys were faster and more accurate in detecting visual events at a cued, covertly attended, location than at un-cued locations. However, monkeys were trained to respond to these events with saccades to stimuli in the opposite direction. While monkeys performed the task, we recorded neural activity from ventral area V4. In addition to modulation of the visual responses to covertly attended stimuli, we also found modulation of visual cortical responses to potential targets of saccades. The modulation during saccade preparation was qualitatively similar to modulation by covert attention, including increases of firing rates, stimulus selectivity, across-trial spiking response reliability, and gamma local field potential (LFP) power, as well as decreases in low frequency LFP power. Our results demonstrate that saccade preparation is sufficient to modulate responses in visual cortex.
Results
Two monkeys (G and B) performed an attention-demanding, “change-blindness” task (Simons and Rensink, 2005) that required them to detect orientation changes in one of four peripheral Gabor gratings while maintaining central fixation (Figure 1A; see Experimental Procedures). During each trial, the identity of the relevant stimulus was indicated with a central cue. After a variable interval, the complete array of stimuli - the cued stimulus and all three distractors - disappeared for a brief moment and then reappeared. Monkeys were trained to detect changes in orientation of any of the four stimuli upon reappearance. In order to dissociate the locus of attention from that of saccade preparation, monkeys were rewarded for responding to an orientation change with a saccade to the stimulus diametrically opposite of the changed stimulus (antisaccade). The central cue validly indicated the relevant stimulus on a vast majority of trials (90–93%); on other trials, the cue invalidly indicated a stimulus other than the one that changed. Orientation changes occurred on only a random half of trials. On trials with no orientation change (“catch” trials), monkeys were rewarded for maintaining central fixation.
Figure 1. Cued change-detection and antisaccade task.

A, Task design and trial sequence. Monkeys fixated a white dot while four peripheral oriented-grating stimuli were presented. After a variable delay, stimuli disappeared then reappeared, either with or without one of the four stimuli rotating (change trial or catch trial, respectively). Monkeys could earn a reward by making a saccade to the diametrically opposite stimulus from the change on change trials, or by maintaining fixation on catch trials. A small, central cue (white line) indicated which stimulus, if any, was most likely to change. Green outlined panels emphasize the change in orientation, or lack of change, across the blank period. Dashed circle indicates area V4 receptive field (RF) locations and arrow indicates saccade direction; these were not visible to the monkey. All graphical elements are not precisely to scale; in particular, the cue is shown much larger than scale for visibility. B, Task conditions. On cue-RF trials, the relevant visual stimulus was in the RF of recorded neurons (spotlight) while the direction of the potential antisaccade was to the diametrically opposite stimulus (dashed arrow). Conversely, on cue-opposite trials, antisaccades were directed to the RF stimulus, while the relevant stimulus was diametrically opposite. On cue-orthogonal trials, neither the relevant stimulus nor the saccade target was in the RF.
Without making use of the cue, chance performance on the task is 20% correct, as there are four possible saccade targets and the option to make no saccade. Alternatively, a strategy in which the monkey uses the cue to choose the direction of saccade yields a chance performance of 50% on validly cued trials. Both monkeys performed firmly above chance in spite of the difficulty of this change-blindness, antisaccade paradigm. Monkey G correctly responded on 69% of trials on average, 77% on change trials and 62% on catch trials. Monkey B correctly responded on 67% of trials, 62% on change trials and 70% on catch trials.
Monkeys used the cue to direct selective attention. On validly cued trials, when the change occurred at the cued location, monkeys responded correctly to 71.7% of changes (Figure 2A). Monkeys responded with very low accuracy to changes at the locations opposite the cue (12.7%, pitalic>10−7, Wilcoxon signed rank test) or orthogonal to the cue (11.1%, pbold>10−7). Similarly, monkeys exhibited faster reaction times when responding to validly cued changes (Figure 2B; mean = 256 ms) than to invalidly cued changes at the opposite location (373 ms, p<10−31, t-test) and orthogonal locations (318 ms, p<10−15). This effect was stable across recording sessions (Figure S1). These differences in performance and reaction times between validly and invalidly cued trials indicate that monkeys allocated covert attention according to the direction of cues (Cook and Maunsell, 2002; Kustov and Robinson, 1996).
Figure 2. Effects of cueing on behavioral measures.

A. Effect of cue validity on performance. The plot compares the rate of correct responses to orientation changes with valid and invalid cues. B, Effect of cue validity on reaction time. The plot compares the time between the orientation change and the onset of a correctly executed response across conditions. C, Examples of saccades executed after the onset of the cue, but before the blank period. Colored circles represent stimulus positions. Black traces and red dots indicate path of eye position and saccade endpoint, respectively, for all saccades from one behavioral session and one cue direction. D, Mean proportion of early saccades made to each stimulus, sorted relative to the direction of the cue. Error bars denote S.E.M.; asterisk = p<0.01.
We next asked whether monkeys used the cue to begin planning a saccade. With the onset of the cue, the probability of the trial requiring a saccade to a particular stimulus changed from 12.5% (50% change trials/4 locations) to nearly 50% or 0%, depending on whether that stimulus was opposite the cued location or not, respectively. Thus, even though a saccade was never required until the end of the trial, the cue nonetheless reduced the uncertainty about the potential saccade location. We reasoned that if the change in saccade probability indeed resulted in the preparation of saccades to the opposite location, then saccades executed early during the post-cue period (aborting the trial) would be biased in the direction of that plan. We therefore examined the distribution of these early saccades (Figure 2C, D; n = 2195 saccades from 24 recordings, see Experimental Procedures). Indeed, a greater proportion of early saccades were made the location opposite to the cue (mean = 63.8%), i.e. to the correct antisaccade direction needed given the cue, than to either the cued location (12.5%, p<10−4, Wilcoxon signed rank test) or the orthogonal locations (11.8%, p<10−4). Taken together, the above behavioral evidence indicates that although monkeys exhibited fastest and accurate performance at the cued location, they nonetheless prepared saccades disproportionately to the opposite location, consistent with the demands of the task.
We recorded activity from 268 single neurons, 428 multi-neuron clusters, and local field potentials (LFPs) at 736 sites in area V4 (see Experimental Procedures) of the two monkeys while they performed the selective attention task. Monkey G completed 34,803 trials over 25 sessions, and Monkey B completed 33,853 trials over 21 sessions with simultaneous neural recordings. The task had four conditions with respect to cue direction and receptive field (RF) location (Figure 1B). In the “cue-RF” condition, the cue directed attention to the RF stimulus. In the “cue-opposite” condition, the cue directed attention to the opposite location, such that the RF stimulus would be the target of rewarded saccades when a change occurred at the opposite location, i.e. on validly cued change trials. Finally, in the “cue-orthogonal” condition, the RF stimulus was 90° clockwise or 90° counter-clockwise from the cue direction, such that neither attention nor a saccade to the RF stimulus was likely to be required. The two cue-orthogonal conditions were identical in terms of the irrelevance of the RF stimulus to task performance and thus they were combined. Correlates of attention in the neural activity were measured as the difference between cue-RF and cue-orthogonal conditions, while correlates of saccade preparation were measured as the difference between cue-opposite and cue-orthogonal conditions.
Firing rate modulation
Numerous studies have found that visually driven firing rates of neurons in V4 are enhanced during selective attention to RF stimuli (e.g. Moran and Desimone, 1985; Reynolds et al., 2000). Our task dissociated covert attention and saccade preparation such that we could separately measure the modulations due to both. We computed firing rates during the post-cue period of the task (Figure 1A), averaged across trials of the same cue condition, for each single neuron or multi-neuron cluster and compared these average rates between the different cue conditions for the population of neurons (see Experimental Procedures). The responses of three example single neurons on cue-RF trials are plotted against those on cue-orthogonal trials (Figure 3A). As expected, beginning several hundred milliseconds after cue onset, the responses diverged. Neurons responded more strongly when the cue directed the monkey’s attention to the RF stimulus (p<10−5 for each example neuron). To compare the effects of attention with those of saccade preparation, when dissociated from attention, the responses of the same neurons on cue-opposite trials are also plotted against those on cue-orthogonal trials (Figure 3B). Similar to the modulation during cue-RF trials, the responses of these three neurons were robustly enhanced when the cue was directed to the stimulus opposite to the RF (p<10−5), that is, when saccades for validly cued change trials were to be directed to the RF stimulus. Thus, for these three neurons, firing rates during the post-cue period were enhanced during both attention and saccade preparation.
Figure 3. Responses of example neurons in the cued change-detection and antisaccade task.

A, Peristimulus time histogram of spiking activity around the time of cue onset for cue-RF (cyan) trials relative to cue-orthogonal (purple) trials. Shaded region indicates ±1 standard error of the mean. B, As in A, but for cue-opposite (red) trials relative to cue-orthogonal.
We observed the same results across the population of neurons. Firing rates were significantly larger for cue-RF trials compared to cue-orthogonal. As in previous studies, we computed a modulation index (MI) as the difference of rates between test (i.e. cue-RF or cue-opposite) and control (cue-orthogonal) conditions divided by their sum. The median index was significantly greater than zero (median = 0.013, p<10−10, Wilcoxon signrank test; Figure 4A, see also Figure S2), indicating higher firing rates during cue-RF condition. The effect was also significant when considering data from each monkey individually (monkey G, median = 0.006, p<0.01; monkey B, median = 0.027, p<10−13). In addition, of the 268 isolated single neurons recorded in the two monkeys, significant effects (p<0.05) were observed in 65 (24%) of them.
Figure 4. Effects of cue direction on firing rate.

A, Histogram of the effect of cueing the RF stimulus on firing rate across all recordings. The effect is measured as a modulation index: the difference between mean rates in the cue-RF and the cue-orthogonal conditions divided by the sum. Rates were computed on each trial during the period from 500ms after cue onset until the start of the blank period; p-value shown for Wilcoxon signed rank test. The colored part of the histogram corresponds to units (i.e., single neurons or multi-neuron clusters) for which firing rate modulation was individually significant. Triangles in this and following figures indicate median values. B, As in A, but for modulation indices computed between the cue-opposite condition and the cue-orthogonal condition.
We also found that firing rates increased during the cue-opposite trials relative to cue orthogonal trials, i.e. when the RF stimulus was likely to be the target of saccades on validly cued change trials. The median index was significantly greater than zero (median = 0.026, p<10−18; Figure 4B). Similar to the effect during cue-RF trials, the effect was also significant when considering data from each monkey individually (monkey G, median = 0.017, p<10−9; monkey B, median = 0.036, p<10−13). In addition, of the 268 isolated single neurons recorded in the two monkeys, significant effects were observed in 71 (26%) of them. Interestingly, the MI for the cue-opposite condition was larger than that for cue-RF trials (p=0.006). Similarly, a direct comparison of neuronal firing rates during cue-opposite trials to those of cue-RF trials demonstrated that the cue-opposite rates were larger (p<0.001). Thus not only were responses enhanced during saccade preparation, those effects were significantly more robust than those observed during covert attention.
Orientation tuning
In addition to the enhancement of firing rates, past studies have described increased tuning amplitudes of V4 neurons during covert attention (McAdams and Maunsell, 1999). We examined the changes of the orientation tuning curves of V4 neurons during both attention and saccade preparation. Since the firing rate effects described above were similar for single neurons and multi-neuron clusters, we combined the two datasets for this and further analyses. Of the neurons in our sample, 54% were well tuned for orientation (378 of 696; see Experimental Procedures). We fit the responses of these neurons with von Mises (circular Gaussian) functions and quantified the difference between peak and trough (see Experimental Procedures), referred to as tuning amplitude, separately for trials of each cue condition. The orientation tuning functions of four example single neurons are plotted for all three behavioral conditions in Figure 5A. For each of these neurons, the tuning amplitude was greater in the cue-RF versus the cue-orthogonal condition. Similar to the firing rate analysis, we computed a tuning amplitude modulation index to compare cue-RF (or cue-opposite) to the cue-orthogonal condition. Across the population, we found that the median tuning amplitude modulation index was significantly greater than zero (Figure 5B; median = 0.043, p<10−5), indicating an increase in tuning amplitude in the cue-RF condition. In addition, we found an increase in the same period for cue-opposite compared to cue-orthogonal trials, as exemplified by the tuning functions plotted in Figure 5A. Across the population, the median tuning amplitude modulation index for the cue-opposite condition was significantly greater than zero (Figure 5C; median = 0.052, p<10−7) indicating an increase in tuning amplitude in the cue-opposite condition. The increase during cue-opposite trials was not significantly different from that during cue-RF trials (p = 0.56). Thus the amplitudes of V4 neurons’ orientation tuning functions were increased both during attention and saccade preparation, even though in the latter condition the orientation of the RF stimulus was behaviorally irrelevant.
Figure 5. Effects of cue direction on tuning amplitude.

A, Tuning curves for four example V4 neurons. Firing rate during the post-cue period is averaged across groups of trials with identical RF stimuli and cue-direction, then plotted against the stimulus orientation for each cue condition. Fit lines shown are best-fit von Mises functions. Tuning amplitude modulation indices for cue-RF versus cue-orthogonal (cyan text) and for cue-opposite versus cue-orthogonal (red text) are shown for each neuron. B, Histogram of the effect of cueing the RF stimulus on tuning amplitude across all tuned units. Other histogram conventions are as in figure 2. C. As in B, but for cue-opposite condition compared to cue-orthogonal condition.
Response reliability
The correlates of covert attention have been interpreted as enhancing the signal-to-noise ratio of neural responses (Noudoost et al., 2010). This can involve both increasing signal by enhancing firing rates or decreasing noise by increasing reliability of spiking responses (Mitchell et al., 2007). To determine whether reliability increases in the post-cue period of our task, we quantified across-trial spiking reliability with the Fano factor, or the variance divided by the mean of spike counts across trials within a sliding 50ms window. We found a significant decrease in Fano factor (i.e. increase in reliability) during cue-RF trials relative to cue-orthogonal (Figure 6; median=−0.4%; p=0.002; see also Figure S3). Similarly, we found a decrease in the same period for cue-opposite compared to cue-orthogonal trials (median=−0.7%; p=0.001). Thus, both attention and saccade preparation correlate with decreased variability, or increased reliability, of area V4 spiking responses.
Figure 6. Effects of cue direction on across-trial spiking reliability.

A. Histogram of the effect of cueing the RF stimulus on Fano factor (FF) across all units. The effect is measured as a modulation index: the difference between FF in the cue-RF and the cue-orthogonal conditions divided by the sum. Positive modulation indices indicate larger FF in cue-RF than cue-orthogonal condition, corresponding to increased variability, i.e. decreased reliability. B. As in A, but for cue-opposite condition compared to cue-orthogonal condition.
Relationship between attention-related and saccadic modulations for individual neurons
The effects described thus far demonstrate that activity in the population of V4 neurons is robustly modulated both during attention and saccade preparation. However, for individual neurons these effects might be uncorrelated. That is, a given neuron might be enhanced during attention but unaffected during saccade preparation or vice versa, suggesting two divergent mechanisms. Therefore, we examined the relationship between the firing rate modulations in the two conditions on a neuron-by-neuron basis. For the following analysis, we only considered isolated single neurons. We re-computed firing rate modulation indices using only independent subsets of cue-orthogonal trials to compare with cue-RF and cue-opposite trials (see Experimental Procedures). First, we measured the correlation between the magnitudes of the two modulations for all single neurons, whether or not they showed significant effects. We found that attention-related and saccadic modulation were weakly, but significantly, correlated (r=0.05, p<10−3). Since this correlation was likely diminished by many unmodulated neurons, we next narrowed our analysis to only those neurons significantly modulated during cue-RF trials (i.e. during attention; n=64 neurons, 38 enhanced and 26 suppressed; median 0.180 and −0.135 cue-RF vs. cue-orthogonal modulation indices, respectively). We asked whether these neurons were likely to be modulated, and in the same direction, during saccade preparation (cue-opposite trials). Of the 64 neurons modulated during attention, 25 of them (39%) were also significantly modulated during saccade preparation, and of those, 24 (96%) were modulated in the same direction (19 enhanced during both, 5 suppressed during both). In this subpopulation of 25 neurons significantly modulated during both trial conditions, the correlation between the two modulations was strong (r=0.77, p<10−5). When considering all 38 neurons enhanced by attention, we found that on average they exhibited enhanced responses during saccade preparation (median MI = 0.052; Figure 7; see also Figure S4), and by an amount that significantly exceeded that of the overall population (0.052 vs. 0.013; p=0.02). Similarly, neurons suppressed during cue-RF trials were also suppressed during cue-opposite trials (median MI = −0.027), and this suppression exceeded that of the overall population (p=0.03). Moreover, the cue-opposite modulations (cue RF enhanced vs. cue RF suppressed) of these two groups were significantly different from one another (MI difference = 0.080, p=0.001). Thus, not only did the two behavioral conditions produce similar effects on the population of neurons, but both effects were similar on a neuron-by-neuron basis..
Figure 7. Modulation during saccade preparation in neurons significantly modulated during covert attention.

Overlaid histograms of modulation indices during saccade preparation (cue-opposite condition) for neurons significantly enhanced (red) and significantly suppressed (black) during covert attention (cue-RF condition).
Local field potential (LFP) power
During covert attention, the frequency spectrum of LFPs in area V4 changes markedly, with increases in power at high frequencies and decreases in low frequencies (Fries et al., 2001), changes that may reflect underlying cortical state dynamics (Harris and Thiele, 2011). We computed the power in the delta (0.5–5Hz), beta (10–20Hz), and gamma (40–70Hz) frequency bands on trials split by cue direction (see Experimental Procedures). We found significant decreases in delta (p<0.01) and beta power (p<10−6) as well as an increase in gamma power (p<10−7) during cue-RF trials relative to cue-orthogonal (Figure 8). On cue-opposite trials we found the same changes in LFP power compared to cue-orthogonal trials (delta, p<0.001; beta, p<10−5; gamma, p<10−8). Similar changes in the oscillatory structure of LFPs accompany both attention and saccade preparation.
Figure 8. Difference in LFP power between cue conditions across frequencies.
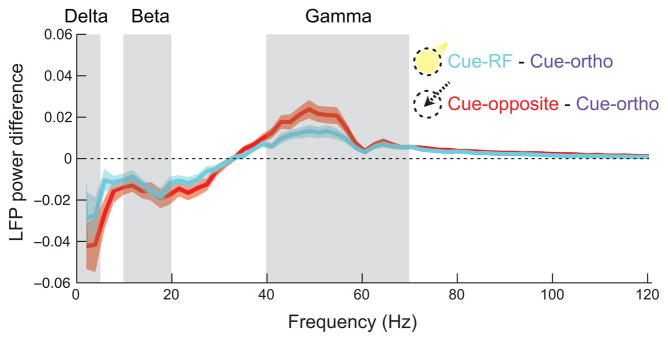
Fourier transforms were computed for the final 500ms of the post-cue period for each trial and each channel, then averaged across trials and channels within each cue condition and recording. The mean differences, cue-RF minus cue-orthogonal (cyan) and cue-opposite minus cue-orthogonal (red), across recordings are represented with shaded regions reflecting ±1 S.E.M.
Discussion
We trained monkeys to perform an attentionally demanding task that dissociated attention from saccade preparation by requiring monkeys to attend a stimulus at one location while planning and eventually executing a saccade to another. Consistent with the demands of the task, behavioral evidence indicated that monkeys exhibited fastest and accurate performance at the cued location, yet prepared saccades disproportionately to the opposite location. While monkeys performed the task, we recorded neural activity from area V4. Similar to numerous prior studies, we observed modulation of the visual responses to covertly attended stimuli, including increased magnitude, selectivity, and reliability of spiking activity, as well as increased gamma and decreased low frequency power of LFPs. In addition, in spite of the behavioral irrelevance of visual information at the potential saccade target, we found qualitatively similar modulation of visual responses to the target stimulus. Responses during saccade preparation were modulated at least as much as during covert attention.
Presaccadic modulation in visual cortex
Several previous studies reported presaccadic modulation in visual cortex during visually guided saccade tasks, particularly in area V4 (Fischer and Boch, 1981; Moore, 1999; Sheinberg and Logothetis, 2001). As in our study (Figure S5), these studies found that within 100 ms before saccades are directed to RF stimuli, firing rates increase (Fischer and Boch, 1981), as does orientation selectivity (Moore and Chang, 2009) and spiking reliability (Steinmetz and Moore, 2010), effects similar to those observed in this area during covert attention (Reynolds and Chelazzi, 2004). However, evidence of presaccadic modulation in V4 has generally been interpreted as reflecting the shift in attention to the target that is often observed prior to saccadic onset (e.g. Moore et al., 1998), consistent with a greater role of this area in perceptual rather than motor functions (Goodale and Milner, 1992). In the saccade tasks employed in these studies, the location of covert attention was unconstrained by task demands, and thus it was not possible to determine whether saccade preparation is sufficient to drive modulation. The neuronal modulation observed in such tasks could have reflected either an optional presaccadic allocation of perceptual resources to the saccade target or an obligatory allocation due merely to the preparation of a saccade. In contrast, our task design explicitly dissociated the saccade target location from the location of covert attention. In our task visual information at the saccade target was not only behavioral irrelevant, but presumably distracting. Thus, our results demonstrate for the first time that saccade preparation per se is sufficient to modulate firing rate, orientation selectivity, and spiking reliability in visual cortex, and thus may reflect an obligatory allocation of perceptual resources to the targets of saccades.
Relationship of task design to attention effect size
The median size of the attention-related effects on firing rate (median MI = 0.013, or ~2.8%) was considerably smaller than observed in past studies in area V4, which averaged ~25% (Noudoost et al., 2010). Thus we considered whether this difference might have been due to task design, specifically the antisaccade response. Although other methodological details may well have contributed to the difference in effect size, the task design was likely key. The other methodological details that may have contributed to the difference include our use of multielectrode recordings and high contrast stimuli. The use of multielectrode recordings may reduce the sampling bias toward high firing-rate neurons and certainly impedes the optimization of stimuli to a particular neuron’s response preferences. Indeed, one recent study utilizing electrode arrays also found much smaller effects (8.6%; Cohen and Maunsell, 2010). Attentional modulation may also be stronger for relatively low contrast stimuli (Reynolds et al., 2000) whereas we used relatively high contrast stimuli. However, given that our task design yielded clear modulation of responses to the saccade target stimulus, modulation at least as large as the modulation during attention, it is possible that the relatively small attention effect size may reflect the splitting of a single resource involved in directing both covert attention and saccades. Such an effect would be consistent with the predictions of previous quantitative models (e.g. Zirnsak et al., 2011).
Implications for the circuits controlling attention
Given that we observed similar modulation of visual cortex during covert attention and saccade preparation, we considered what neurons might be the source. Three key structures that have a role in both covert attention and saccadic behaviors are often considered as possible sources of attention-related modulation of visual cortex: LIP, SC, and FEF (e.g. Noudoost et al., 2010). Theoretical accounts of selective attention have suggested that the focus of attention may be driven by a “saliency map” or a “priority map” which reflects the behavioral relevance of visual stimuli based on a combination of their intrinsic visual properties as well as top-down biases related to task demands (Fecteau and Munoz, 2006; Koch and Ullman, 1985; Serences and Yantis, 2006; Bisley and Goldberg, 2010). This saliency map would then direct the attentional modulation of visual cortical activity to favor the most salient stimulus. Each of these three candidate source areas (LIP, SC, and FEF) have been proposed to comprise such a map (Bisley and Goldberg, 2010; Fecteau and Munoz, 2006; Thompson and Bichot, 2005).
Activity of many neurons in area LIP reflects the salience of visual stimuli, either produced by abrupt onset or by behavioral context, but appears to be largely independent of saccade planning (Bisley and Goldberg, 2003; Gottlieb and Goldberg, 1999; Gottlieb et al., 1998). Consequently, it has been suggested that LIP primarily conveys signals about the attended stimulus and less about the planned saccade (Gottlieb, 2007). Therefore, to the extent that LIP neurons represent the location of attention as distinct from the location of planned saccades, the feedback input from these neurons to V4 (Andersen et al., 1990) is unlikely to account for the modulation we observed there during saccade preparation.
Given the recent strong evidence that attention-related modulation in extrastriate cortex operates independently of inputs from the SC (Zénon and Krauzlis, 2012), the FEF may be a more likely source. In addition to the established role of the FEF in the control of saccades, much evidence suggests that FEF also controls visual spatial attention (Monosov et al., 2011; Moore and Fallah, 2001, 2004; Wardak et al., 2006). Consistent with this evidence, changes in FEF neuronal activity are sufficient to modulate responses in area V4 (Noudoost and Moore, 2011). Other recent work suggests that attention-related modulation in V4 may be driven by “visual” FEF neurons, i.e. those that respond only to visual stimulation during a memory guided saccade task and not prior to saccades (Gregoriou et al., 2012). However, these neurons are unlikely to comprise the source of the V4 modulation during saccade preparation that we observed. Instead, our results suggest that modulation of V4 responses is likely to be driven by a source or sources that jointly represent attention-related and saccade-related information. One possible explanation is that the neurons within FEF driving V4 modulation could be those that exhibit no saccade-related activity in memory guided saccade tasks but that nevertheless exhibit saccade-related activity in visually guided saccade tasks, similar to the task in this study. About half of FEF “visual” neurons exhibit enhanced activity when saccades are directed to RF stimuli while nevertheless exhibiting no presaccadic modulation in a memory guided or learned saccade task (Bruce and Goldberg, 1985). Future experiments could clarify the extent to which neurons in these areas are capable of driving visual cortical modulation, and what circuits might underlie the interrelationship of the control of covert attention with that of saccades, by recording from likely source areas during a task that dissociates the two behaviors.
Experimental Procedures
Subjects
Two male monkeys (Macaca mulatta, 8–12 kg) were used in these experiments. All experimental procedures were in accordance with National Institutes of Health Guide for the Care and Use of Laboratory Animals, the Society for Neuroscience Guidelines and Policies, and Stanford University Animal Care and Use Committee. General surgical procedures have been described previously (Armstrong et al., 2009).
Behavioral task and visual stimuli
We trained two monkeys on a cued change-detection task with a change-blindness manipulation and an antisaccade response. In brief, the monkey was required to make a difficult visual discrimination at a peripheral location, made easier by a central cue indicating which location would contain the change, but made more attentionally demanding by the simultaneous disappearance and reappearance of all peripheral stimuli (change-blindness). The monkey was rewarded for reporting a successful detection with a saccade to the diametrically opposite peripheral location (antisaccade response). The sequence of trial events for most trials was as follows. All time ranges are uniformly distributed and independently chosen unless otherwise stated. A small white dot (~0.15° diameter) appeared on the screen and the monkey initiated a trial by fixating it. Within 100ms, the four peripheral target stimuli appeared (described below). After a brief delay of 300–500ms, the cue appeared: a white line less than half a degree in length and one pixel (<0.1°) in width, originating at the fixation dot and extending in the direction of one of the four stimuli (randomly, independently chosen on each trial with equal probability). The cue indicated with 90 or 93% validity which of the four stimuli would change on this trial (if any). After a post-cue period of 600–2200ms with the display static as described, the four peripheral stimuli synchronously disappeared for a brief (<270ms) interval (“blank period”), and then reappeared. Upon reappearance, one of the four stimuli changed its orientation (i.e. was rotated in place) on 50% of trials. On these trials (“change trials”), the monkey could earn a reward by executing a saccadic eye movement within 800 ms to the stimulus opposite the changed stimulus. On the other 50% of trials (“catch trials”), all four stimuli appeared at identical orientations to those they had before disappearing; in this case, the monkey was rewarded for maintaining fixation on the central dot for 800 ms. The trial was terminated without reward if, at any time prior to the stimulus reappearance, the eye position left a small square box (~1.5° width) around the fixation dot.
The target stimuli were four static gabor patches, i.e. oriented black and white gratings in a circular gaussian aperture. In Monkey G the gratings were square wave; in Monkey B they were sine wave modulated. Both types elicited robust responses from the neurons in this study. In both monkeys the gratings were at maximal contrast for the monitor, i.e. the maximum was the brightest white available and the minimum pixels were turned off. The dimensions of the gratings varied somewhat from session to session but were typically ~4 degrees in diameter and ~1 cycles/degree in spatial frequency. The location of the gratings also varied depending on the receptive field locations of the neurons being recorded, but the centers were always between 5 and 8 degrees eccentricity. All four gratings had equal eccentricity and were spaced evenly, i.e. at 90 degree intervals around a circle. The screen background was dark gray in Monkey G and middle gray in Monkey B, but in neither monkey were the mean luminances of the gratings matched to the background color. The orientation of the grating took one of 16 possible values, evenly spaced from 0 to 360 degrees in 22.5 degree intervals. Note that orientations 180 degrees apart (e.g. 45 and 225 degrees) were identical except for a mirror reflection, and for nearly all neurons drove the neurons identically and have therefore been combined for analysis. The grating orientations were chosen independently for each of the four stimuli and for each trial. The amount of rotation took multiple values to vary the difficulty of the task, but was typically 45, 67, or 90 degrees, and trials with these different rotation magnitudes were interleaved randomly. The rotation was clockwise or counterclockwise with equal probability, independently chosen for each trial.
Visual stimuli were displayed on a Samsung 2233RZ monitor at 120Hz and 1680×1050 resolution (17.8 pixels/°). The monitor was positioned at 28.5cm from the monkey’s eyes. Presentation of stimuli was controlled by Cortex software (http://dally.nimh.nih.gov). Eye position was monitored in some sessions for Monkey G with a scleral search coil. In the remaining sessions for Monkey G as well as all sessions for Monkey B, eye position was monitored with an EyeLink 1000 video eye tracking system.
Percentages of correctly performed trials were computed considering only trials on which monkeys maintained fixation through the end of the blank period, i.e. those in which the monkeys fixated until the start of the response window. Statistics were computed on the summary percentages for each recording. Reaction times were measured from the end of the blank period, that is, stimulus re-onset, to the start of the saccade. Only correctly executed saccades, meaning those directed to the stimulus opposite the changed stimulus, were included in this analysis. Statistics were computed on all saccades considered together, irrespective of which recording session they came from. Aborted saccades were considered if they occurred after the cue was issued and before the start of the blank period, and if their endpoint was within 3 d.v.a. of the center of one of the four stimuli. Only recordings with at least 30 aborted saccades were included in the statistics. Statistics were computed on the summary percentages for each recording.
Neural recordings
Linear array recordings
Recordings were made with 16-channel U-Probes (Plexon Inc., Dallas, TX). These electrodes are cylindrical in shape (180μm diameter) and have a row of 16 circular platinum/iridium electrical contacts (15μm diameter) with 150μm center-to-center spacing (total length of array is 2.25mm). Data were amplified and recorded using the Omniplex system (Plexon Inc., Dallas, TX). Wide-band data, filtered only in hardware at 0.5Hz highpass and 8kHz lowpass, were recorded to disk at 40kHz. Spikes were detected from this signal as described below.
Spike detection and sorting
When recording with electrode arrays, it is not possible to isolate the waveforms of single neurons using the traditional method, by adjusting the position of the electrode carefully throughout the recording to ensure that its recording surface remains as close to the neuron as possible since any adjustment of the electrode position would alter the isolations on all 16 contacts simultaneously. Instead, we set the electrodes in place and left them for the duration of the session, taking whatever neurons presented themselves there. The waveforms we recorded therefore came in a wide range of isolation qualities, and so we employed post-hoc spike detection and sorting methods to maximize yield, using the steps described below. To determine whether sorted waveforms could be included for analysis, we quantified the quality of these isolations.
Spike detection
The wide-band data was filtered with notch filters at multiples of 60Hz to remove line noise harmonics. “Common average referencing” (CAR) was applied (Ludwig et al., 2009) in order to remove other noise components appearing on all channels. CAR is performed by averaging the signal from all channels together and subtracting this average signal from each individual channel. This filtered and re-referenced signal was used for spike detection using the matched-filter method (Hill et al., 2011). First, the signal is convolved with a waveform representing the average, expected shape of cortical neuron spike waveforms. Specifically, the waveform used was biphasic with 0.425 ms trough-to-peak duration. Next, a threshold is applied to the new filtered signal and peaks of sections of the signal that cross the threshold are determined. The threshold is chosen such that the rate of crossings is 100Hz. Finally, putative spike waveforms are pulled from the pre-convolution signal at the times of threshold crossing peaks. Spike waveforms were 1ms in duration (40 samples), with 0.5 ms prior and 0.5 ms after the peak times. Waveforms within 500μs of each other were disallowed. Putative waveforms are selected in order of descending peak height, such that bigger peaks (i.e. waveforms of larger amplitude or more similar to the average waveform used as in the convolution) have “priority” over smaller ones for cases in which two waveforms are less than the disallowed interval (500μs) from each other.
Spike sorting
Spike waveforms were sorted in the attempt to classify separately those waveforms originating from one neuron and those from others. Sorting was initially performed manually using Offline Sorter (Plexon) by identifying clusters of waveforms with similar shapes. In many cases, this initial sorting was refined by computing the Fisher Linear Discriminant between the clustered waveforms and all other waveforms on the same channel (Hill et al., 2011), projecting the waveforms along this dimension, and reclassifying waveforms according to their value on this axis. The extent to which the waveforms of any of these sorted clusters could be confidently reported as originating from a single neuron was determined with further quality metrics (below).
Sorting quality quantification
Under the assumption that cortical neurons have a “refractory period,” or minimum time between spikes, we computed an estimation of the false-positive rate for waveforms of each cluster (Hill et al., 2011). This calculation considers the rate of spikes, the duration of the experiment, and the number of waveforms too close together in time to plausibly arise from a single neuron to arrive at a figure estimating what percentage of the total spike count arose from neuron(s) besides the one in question. If greater than 10% of spikes were probably due to contamination from other neurons, the cluster was referred to and analyzed as a “multi-neuron cluster.” Note that this does not mean that 10% of spike times fell within the refractory period relative to other spikes. On the contrary, only a small fraction of a percentage of spikes falling in the refractory period would yield a false-positive estimate greater than 10%, depending on the overall firing rate of the cluster. If the false-positive estimate was less than 10%, and if the shape of the waveform appeared stable over the duration of the experiment, and if the histogram of waveform amplitudes was approximately symmetric, then the cluster was declared a “single neuron” indicating our confidence that those waveforms reflect the responses of just one individual neuron. For some analyses, where stated, both single neurons and multi-neuron clusters were included; in those cases we refer to both as “units.”
Quantification of firing rate modulation
Spikes were counted within the window between 500ms post-cue onset the end of the post-cue period (i.e., start of blank period) and converted to rates for each trial based on the duration of that period. Mean rates in each condition were compared by computing a modulation index, defined as:
| (1) |
where A is the mean firing rate in the modulated condition (either cue-RF or cue-opposite) and B is the mean firing rate in the control condition (cue-orthogonal). To statistically compare the spike counts on modulated versus unmodulated trials for each individual unit, the Wilcoxon ranksum test was computed between modulated and unmodulated rates. For the population as a whole, the Wilcoxon signrank test was computed on the modulation indices of all neurons. Neurons with average spike rate over the whole trial of less than 0.1Hz were excluded from this and all other analyses (21 of 717 excluded). Though we included some neurons that emitted only 1 or 2 spikes per trial on average, visual inspection of these neurons revealed that many nevertheless showed clear tuning and/or modulation by condition, thanks to the large numbers of trials (>1000) per recording session. For the purposes of correlating the firing rate modulation on cue-RF trials with modulation on cue-opposite trials, we used independent sets of cue-orthogonal trials as the reference for the computation of modulation index. We selected randomly half of the trials from each cue-orthogonal direction to serve as the reference for the cue-RF modulation (i.e. “B” in eq. 1 above) and the other half to serve as the reference for the calculation of cue-opposite modulation.
Quantification of tuning amplitude
Spikes were counted within the window between 500ms post-cue and the start of the blank period, each trial’s spike count was converted to a firing rate, and rates were combined across trials that had the same stimulus orientation in the RF. Neurons were only considered for this analysis if they were significantly modulated by the stimulus orientation during the stimulus onset period (p<0.0001 on Kruskal-Wallis test of spike rates grouped by receptive field stimulus orientation). The tuning curves were fit to a von Mises distribution (circular gaussian). Just as with a standard gaussian, the von Mises distribution has two parameters, the mean (μ; preferred direction of the unit) and standard deviation (κ; tuning width). Two other parameters allow the tuning curves to be fully fit: a baseline offset (b; added to the tuning curve) and a scaling factor (s; multiplies the tuning curve). The fit equation for firing rate (r) as a function of stimulus orientation (θ) is given by:
| (2) |
where “Io” is the modified zeroth-order Bessel function. We fit the equation with constrained least squares curve-fitting, with the mean parameter μ restricted to be in the range [−π, π], width parameter κ to [0, 8] and all other parameters [0, ∞]. The restriction on κ prevented tuning widths being narrower than ~45°. Any tuning curves with true widths less than 45 could not be adequately measured with our sampling of orientations, so the constraint on κ prevented some clearly artifactual fits. The final value of tuning curve amplitude was computed by subtracting the trough from the peak value of the fit tuning curve, that is:
| (3) |
To assess whether tuning amplitude was significantly influenced by cue direction for individual units, we computed bootstrapped 95% confidence intervals (CIs) by randomly selecting trials, with replacement, and re-performing the above analyses to determine tuning amplitude for each cue direction on each of 1000 sets of resampled trials. 95% CIs were determined as the 25th and 975th largest tuning amplitudes from this distribution. If the 95% CIs for the modulation condition (either cue-RF or cue-opposite) were not overlapping with the 95% CI for the cue-orthogonal condition, the difference in tuning amplitude was declared significant at p=0.05.
Quantification of across-trial spiking reliability (Fano factor, FF)
Spikes were counted in non-overlapping 50 ms bins (as in Churchland et al. 2010) during the final 400ms of the post-cue period, prior to the blank period. The FF was computed as variance divided by the mean of these spike counts for groups of identical trials (same RF stimulus orientation and cue direction) and was averaged across the groups corresponding to different stimulus orientations. To assess significance of the difference in FF between conditions for an individual unit, we performed a shuffle test by randomly reassigning cue direction labels for each trial and re-computing FF for each cue direction. The true difference between modulation condition (cue-RF or cue-opposite) and cue-orthogonal was compared to the distribution of 1000 shuffled differences, and declared significant if it was greater or less than 97.5% of this distribution (p=0.05 significance level).
Quantification of power in local field potentials (LFP) within a frequency band
The LFP was defined as the continuous voltage signal highpass filtered at 0.5Hz and lowpass filtered at 200Hz, and downsampled to 1kHz. A second-order 60Hz notch filter was also applied. LFP segments were taken from the final 500ms of the post-cue period (prior to the blank period) and the fast Fourier transform (FFT) was computed. FFTs were averaged across trials within each cue condition and, due to the large correlations from channel to channel, averaged across channels within each recording.
Supplementary Material
Footnotes
Publisher's Disclaimer: This is a PDF file of an unedited manuscript that has been accepted for publication. As a service to our customers we are providing this early version of the manuscript. The manuscript will undergo copyediting, typesetting, and review of the resulting proof before it is published in its final citable form. Please note that during the production process errors may be discovered which could affect the content, and all legal disclaimers that apply to the journal pertain.
References
- Andersen RA, Asanuma C, Essick G, Siegel RM. Corticocortical connections of anatomically and physiologically defined subdivisions within the inferior parietal lobule. J Comp Neurol. 1990;296:65–113. doi: 10.1002/cne.902960106. [DOI] [PubMed] [Google Scholar]
- Armstrong KM, Chang MH, Moore T. Selection and maintenance of spatial information by frontal eye field neurons. J Neurosci. 2009;29:15621–15629. doi: 10.1523/JNEUROSCI.4465-09.2009. [DOI] [PMC free article] [PubMed] [Google Scholar]
- Barash S, Bracewell RM, Fogassi L, Gnadt JW, Andersen Ra. Saccade-related activity in the lateral intraparietal area. I Temporal properties; comparison with area 7a. J Neurophysiol. 1991;66:1095. doi: 10.1152/jn.1991.66.3.1095. [DOI] [PubMed] [Google Scholar]
- Bisley JW, Goldberg ME. Neuronal activity in the lateral intraparietal area and spatial attention. Science (80-) 2003;299:81–86. doi: 10.1126/science.1077395. [DOI] [PubMed] [Google Scholar]
- Bisley JW, Goldberg ME. Attention, intention, and priority in the parietal lobe. Annu Rev Neurosci. 2010;33:1–21. doi: 10.1146/annurev-neuro-060909-152823. [DOI] [PMC free article] [PubMed] [Google Scholar]
- Bruce CJ, Goldberg ME. Primate frontal eye fields. I Single neurons discharging before saccades. J Neurophysiol. 1985;53:603–635. doi: 10.1152/jn.1985.53.3.603. [DOI] [PubMed] [Google Scholar]
- Bushnell MC, Goldberg ME, Robinson DL. Behavioral enhancement of visual responses in monkey cerebral cortex. I Modulation in posterior parietal cortex related to selective visual attention. J Neurophysiol. 1981;46:755–772. doi: 10.1152/jn.1981.46.4.755. [DOI] [PubMed] [Google Scholar]
- Cohen MR, Maunsell JHR. A neuronal population measure of attention predicts behavioral performance on individual trials. J Neurosci. 2010;30:15241–15253. doi: 10.1523/JNEUROSCI.2171-10.2010. [DOI] [PMC free article] [PubMed] [Google Scholar]
- Cook EP, Maunsell JHR. Attentional modulation of behavioral performance and neuronal responses in middle temporal and ventral intraparietal areas of macaque monkey. J Neurosci. 2002;22:1994–2004. doi: 10.1523/JNEUROSCI.22-05-01994.2002. [DOI] [PMC free article] [PubMed] [Google Scholar]
- Deubel H, Schneider WXX. Saccade target selection and object recognition: Evidence for a common attentional mechanism. Vision Res. 1996;36:1827–1837. doi: 10.1016/0042-6989(95)00294-4. [DOI] [PubMed] [Google Scholar]
- Dias EC, Segraves MA. Muscimol-Induced Inactivation of Monkey Frontal Eye Field: Effects on Visually and Memory-Guided Saccades. J Neurophysiol. 1999;81:2191–2214. doi: 10.1152/jn.1999.81.5.2191. [DOI] [PubMed] [Google Scholar]
- Fecteau JH, Munoz DP. Salience, relevance, and firing: a priority map for target selection. Trends Cogn Sci. 2006;10:382–390. doi: 10.1016/j.tics.2006.06.011. [DOI] [PubMed] [Google Scholar]
- Fischer B, Boch R. Enhanced activation of neurons in prelunate cortex before visually guided saccades of trained rhesus monkeys. Exp Brain Res. 1981;44:129–137. doi: 10.1007/BF00237333. [DOI] [PubMed] [Google Scholar]
- Fries P, Reynolds JH, Rorie aE, Desimone R. Modulation of Oscillatory Neuronal Synchronization by Selective Visual Attention. Science (80-) 2001;291(5508):1560–1563. doi: 10.1126/science.1055465. [DOI] [PubMed] [Google Scholar]
- Goodale MA, Milner AD. Separate visual pathways for perception and action. Trends Neurosci. 1992;15:20–25. doi: 10.1016/0166-2236(92)90344-8. [DOI] [PubMed] [Google Scholar]
- Gottlieb J. From thought to action: the parietal cortex as a bridge between perception, action, and cognition. Neuron. 2007;53:9–16. doi: 10.1016/j.neuron.2006.12.009. [DOI] [PubMed] [Google Scholar]
- Gottlieb J, Goldberg ME. Activity of neurons in the lateral intraparietal area of the monkey during an antisaccade task. Nat Neurosci. 1999;2:906–912. doi: 10.1038/13209. [DOI] [PubMed] [Google Scholar]
- Gottlieb J, Kusunoki M, Goldberg ME. The representation of visual salience in monkey parietal cortex. Nature. 1998;391:481–484. doi: 10.1038/35135. [DOI] [PubMed] [Google Scholar]
- Gregoriou GG, Gotts SJ, Desimone R. Cell-type-specific synchronization of neural activity in FEF with V4 during attention. Neuron. 2012;73:581–594. doi: 10.1016/j.neuron.2011.12.019. [DOI] [PMC free article] [PubMed] [Google Scholar]
- Harris KD, Thiele A. Cortical state and attention. Nat Rev Neurosci. 2011;12 doi: 10.1038/nrn3084. [DOI] [PMC free article] [PubMed] [Google Scholar]
- Hikosaka O, Wurtz RH. Saccadic eye movements following injection of lidocaine into the superior colliculus. Exp Brain Res. 1986;61:531–539. doi: 10.1007/BF00237578. [DOI] [PubMed] [Google Scholar]
- Hill DN, Mehta SB, Kleinfeld D. Quality metrics to accompany spike sorting of extracellular signals. J Neurosci. 2011;31:8699–8705. doi: 10.1523/JNEUROSCI.0971-11.2011. [DOI] [PMC free article] [PubMed] [Google Scholar]
- Hoffman JE, Subramaniam B. The Role of Visual Attention in Saccadic Eye Movements. Percept Psychophys. 1995;57:787. doi: 10.3758/bf03206794. [DOI] [PubMed] [Google Scholar]
- Hunt AR, Kingstone A. Covert and overt voluntary attention: linked or independent? Cogn Brain Res. 2003;18:102–105. doi: 10.1016/j.cogbrainres.2003.08.006. [DOI] [PubMed] [Google Scholar]
- Ignashchenkova A, Dicke PW, Haarmeier T, Thier P. Neuron-specific contribution of the superior colliculus to overt and covert shifts of attention. Nat Neurosci. 2004;7:56–64. doi: 10.1038/nn1169. [DOI] [PubMed] [Google Scholar]
- Koch C, Ullman S. Shifts in selective visual attention: towards the underlying neural circuitry. Hum Neurobiol. 1985;4:219–227. [PubMed] [Google Scholar]
- Kustov AA, Robinson DL. Shared neural control of attentional shifts and eye movements. Nature. 1996;384:74–77. doi: 10.1038/384074a0. [DOI] [PubMed] [Google Scholar]
- Liu Y, Yttri EA, Snyder LH. Intention and attention: different functional roles for LIPd and LIPv. Nat Neurosci. 2010 doi: 10.1038/nn.2496. [DOI] [PMC free article] [PubMed] [Google Scholar]
- Lovejoy LP, Krauzlis RJ. Inactivation of primate superior colliculus impairs covert selection of signals for perceptual judgments. Nat Neurosci. 2010;13:261–266. doi: 10.1038/nn.2470. [DOI] [PMC free article] [PubMed] [Google Scholar]
- Ludwig Ka, Miriani RM, Langhals NB, Joseph MD, Anderson DJ, Kipke DR. Using a Common Average Reference to Improve Cortical Neuron Recordings From Microelectrode Arrays. J Neurophysiol. 2009;101:1679–1689. doi: 10.1152/jn.90989.2008. [DOI] [PMC free article] [PubMed] [Google Scholar]
- McAdams CJ, Maunsell JHR. Effects of Attention on Orientation-Tuning Functions of Single Neurons in Macaque Cortical Area V4. J Neurosci. 1999;19:431–441. doi: 10.1523/JNEUROSCI.19-01-00431.1999. [DOI] [PMC free article] [PubMed] [Google Scholar]
- Mitchell JF, Sundberg KAA, Reynolds JH. Differential attention-dependent response modulation across cell classes in macaque visual area V4. Neuron. 2007;55:131–141. doi: 10.1016/j.neuron.2007.06.018. [DOI] [PubMed] [Google Scholar]
- Monosov IE, Sheinberg DL, Thompson KG. The effects of prefrontal cortex inactivation on object responses of single neurons in the inferotemporal cortex during visual search. J Neurosci. 2011;31:15956–15961. doi: 10.1523/JNEUROSCI.2995-11.2011. [DOI] [PMC free article] [PubMed] [Google Scholar]
- Moore T. Shape Representations and Visual Guidance of Saccadic Eye Movements. Science (80-) 1999;285:1914–1917. doi: 10.1126/science.285.5435.1914. [DOI] [PubMed] [Google Scholar]
- Moore T, Chang MH. Presaccadic discrimination of receptive field stimuli by area V4 neurons. Vision Res. 2009;49:1227–1232. doi: 10.1016/j.visres.2008.03.018. [DOI] [PMC free article] [PubMed] [Google Scholar]
- Moore T, Fallah M. Control of eye movements and spatial attention. Proc Natl Acad Sci. 2001;98:21549498. doi: 10.1073/pnas.021549498. [DOI] [PMC free article] [PubMed] [Google Scholar]
- Moore T, Fallah M. Microstimulation of the Frontal Eye Field and Its Effects on Covert Spatial Attention. J Neurophysiol. 2004;91:152–162. doi: 10.1152/jn.00741.2002. [DOI] [PubMed] [Google Scholar]
- Moore T, Tolias AS, Schiller PH. Visual representations during saccadic eye movements. Proc Natl Acad Sci. 1998;95:8981–8984. doi: 10.1073/pnas.95.15.8981. [DOI] [PMC free article] [PubMed] [Google Scholar]
- Moore T, Armstrong KM, Fallah M. Visuomotor Origins of Covert Spatial Attention. Neuron. 2003;40:671–683. doi: 10.1016/s0896-6273(03)00716-5. [DOI] [PubMed] [Google Scholar]
- Moran J, Desimone R. Selective attention gates visual processing in the extrastriate cortex. Science (80-) 1985;229:782. doi: 10.1126/science.4023713. [DOI] [PubMed] [Google Scholar]
- Noudoost B, Moore T. Control of visual cortical signals by prefrontal dopamine. Nature. 2011;474:372–375. doi: 10.1038/nature09995. [DOI] [PMC free article] [PubMed] [Google Scholar]
- Noudoost B, Chang MH, Steinmetz NA, Moore T. Top-down control of visual attention. Curr Opin Neurobiol. 2010;20:183–190. doi: 10.1016/j.conb.2010.02.003. [DOI] [PMC free article] [PubMed] [Google Scholar]
- Posner MI. Orienting of attention. Q J Exp Psychol. 1980;32:3–25. doi: 10.1080/00335558008248231. [DOI] [PubMed] [Google Scholar]
- Reynolds JH, Chelazzi L. Attentional modulation of visual processing. Annu Rev Neurosci. 2004;27:611–647. doi: 10.1146/annurev.neuro.26.041002.131039. [DOI] [PubMed] [Google Scholar]
- Reynolds JH, Pasternak T, Desimone R. Attention increases sensitivity of V4 neurons. Neuron. 2000;26:703–714. doi: 10.1016/s0896-6273(00)81206-4. [DOI] [PubMed] [Google Scholar]
- Schiller PH, Stryker M. Single-unit recording and stimulation in superior colliculus of the alert rhesus monkey. J Neurophysiol. 1972:915–924. doi: 10.1152/jn.1972.35.6.915. [DOI] [PubMed] [Google Scholar]
- Serences JT, Yantis S. Selective visual attention and perceptual coherence. Trends Cogn Sci. 2006;10:38–45. doi: 10.1016/j.tics.2005.11.008. [DOI] [PubMed] [Google Scholar]
- Sheinberg DL, Logothetis NK. Noticing Familiar Objects in Real World Scenes: The Role of Temporal Cortical Neurons in Natural Vision. J Neurosci. 2001;21:1340–1350. doi: 10.1523/JNEUROSCI.21-04-01340.2001. [DOI] [PMC free article] [PubMed] [Google Scholar]
- Steinmetz NA, Moore T. Changes in the response rate and response variability of area V4 neurons during the preparation of saccadic eye movements. J Neurophysiol. 2010;103:1171–1178. doi: 10.1152/jn.00689.2009. [DOI] [PMC free article] [PubMed] [Google Scholar]
- Thompson KG, Bichot NP. A visual salience map in the primate frontal eye field. Prog Brain Res. 2005;147:249–262. doi: 10.1016/S0079-6123(04)47019-8. [DOI] [PubMed] [Google Scholar]
- Thompson KG, Biscoe KL, Sato TR. Neuronal basis of covert spatial attention in the frontal eye field. J Neurosci. 2005;25:9479–9487. doi: 10.1523/JNEUROSCI.0741-05.2005. [DOI] [PMC free article] [PubMed] [Google Scholar]
- Wardak C, Olivier E, Duhamel JR. A deficit in covert attention after parietal cortex inactivation in the monkey. Neuron. 2004;42:501–508. doi: 10.1016/s0896-6273(04)00185-0. [DOI] [PubMed] [Google Scholar]
- Wardak C, Ibos G, Duhamel JR, Olivier E. Contribution of the monkey frontal eye field to covert visual attention. J Neurosci. 2006;26:4228–4235. doi: 10.1523/JNEUROSCI.3336-05.2006. [DOI] [PMC free article] [PubMed] [Google Scholar]
- Zénon A, Krauzlis RJ. Attention deficits without cortical neuronal deficits. Nature. 2012 doi: 10.1038/nature11497. [DOI] [PMC free article] [PubMed] [Google Scholar]
- Zirnsak M, Beuth F, Hamker FH. Split of spatial attention as predicted by a systems-level model of visual attention. Eur J Neurosci. 2011;33:2035–2045. doi: 10.1111/j.1460-9568.2011.07718.x. [DOI] [PubMed] [Google Scholar]
Associated Data
This section collects any data citations, data availability statements, or supplementary materials included in this article.