Abstract
SHR lines differ in their susceptibility to hypertensive end-organ disease and may provide an informative model of genetic risk of disease. Lines derived from the original SHR-B and SHR-C clades are highly resistant to hypertensive end-organ disease, while lines derived from the SHR-A clade were selected for stroke susceptibility and experience hypertensive renal disease. Here we characterize the temporal development of progressive renal injury in SHR-A3 animals consuming 0.3% sodium in the diet and drinking water. SHR-A3 rats demonstrate albuminuria, glomerular damage, tubulo-interstitial injury and renal fibrosis that emerge at 18 weeks of age and progress. Mortality of SHR-A3 animals was 50% at 40 weeks of age, and animals surviving to this age had reduced renal function. In contrast SHR-B2, which are 87% genetically identical to SHR-A3, are substantially protected from renal injury and demonstrate only moderate changes in albuminuria and renal histological injury over this time period. At 40 weeks of age, electron microscopy of the renal glomerulus revealed severe podocyte effacement in SHR-A3, but slit diaphragm architecture in SHR-B2 at this age was well preserved. Renal injury traits in the F1 and F2 progeny of an intercross between SHR-A3 and SHR-B2 were measured to determine heritability of renal injury in this model. Heritability of albuminuria, glomerular injury and tubulo-interstitial injury were estimated at 48.9, 66.5 and 58.6% respectively. We assessed the relationship between blood pressure and renal injury measures in the F2 animals and found some correlation between these variables that explain up to 26% of the trait variation. Quantitative trait locus (QTL) mapping was performed using over 200 SNP markers distributed across the 13% of the genome that differs between these two closely related lines. Mapping of albuminuria, tubulo-interstitial injury and renal fibrosis failed to identify loci linked with disease susceptibility, suggesting a complex inheritance of disease risk. We detected a single QTL conferring susceptibility to glomerular injury that was confined to a small haplotype block at chromosome 14:70–76Mb.
Introduction
The spontaneously hypertensive rat was produced in Japan by selective breeding on the trait of elevated blood pressure [1]. After fixation of the hypertensive trait, inbreeding was continued within distinct clades, SHR-A, -B and -C. In SHR-A animals, frequent stroke was observed and an effort was made to enrich this trait by selective breeding of SHR-A animals. Within three generations of selection, early stroke occurred in most animals consuming a typical high sodium and low potassium “Japanese” rodent diet [2, 3]. Proteinuria has been shown to be closely linked to stroke in this line [4]. The concurrence of stroke susceptibility with proteinuria in the absence of selection for proteinuria suggests that selection for stroke created genetic susceptibility for proteinuria, probably by a shared disease mechanism.
In humans, familial risk of hypertensive renal disease has motivated population genetic studies, culminating in recently completed genome-wide association studies (GWAS) [5–7]. However, in the general population, the amount of disease risk explained by GWAS is small [8–10]. The investigation of progressive renal disease in rodent models provides the possibility of excluding some of the complexities associated with genetic studies in human populations including interactions between genes and the environment. Furthermore, the existence of inbred strains reduces genetic heterogeneity that poses an analytical problem in large human populations. Resources for genetic investigation of rat models of chronic cardiovascular disease have increased and now include whole genome sequence and a rich panel of single nucleotide polymorphisms (SNP) [11, 12]. However, a critical requirement for these models is that they adequately reflect the features of human disease. This includes a full range of pathologic features and independence from experimental conditions (diet composition, salt intake, surgical modifications) that are atypical of the human population.
In the present study we have characterized proteinuria and renal injury in both injury-prone and injury-resistant lines of the spontaneously hypertensive rat (SHR). We have quantitated the emergence of renal injury longitudinally in the absence of dietary salt loading. We have assessed proteinuria by measuring creatinine-indexed rat specific albumin in the urine and we have used direct histological assessment of the glomerular and tubulo-interstitial compartments and the emergence of renal fibrosis to assess renal tissue damage. We observed emergence of renal injury at 18 weeks of age and its progression across the lifespan of SHR-A3 animals while only very limited injury occurred in SHR-B2 animals. Given the strong divergence of these traits across the lines we have estimated the heritability of injury traits to assess the role of genetic versus environmental factors in this difference. We then applied high throughput SNP mapping across the 13% of the genome by which these lines differ to map QTL linked to these renal injury traits.
Methods
Animals
Studies were performed on male rats of the stroke-prone spontaneously hypertensive-A3 (SHR-A3, SHRSP/Bbb) line and the SHR-B2 line that is resistant to stroke. Across the different parental ages examined we used a total of 83 SHR-A3 animals and 72 SHR-B2 animals. These lines have been maintained in our facility for several years and are housed under controlled conditions in an AAALAC-approved animal facility and provided a standard rodent chow diet (0.3% sodium, Purina, PicoLab Rodent Diet 20, #5053) and drinking water ad libitum. No stroke-inducing dietary manipulations were employed. Animals were studied at 18, 25 and 30 weeks of age. SHR-A3 animals were also studied at 40 weeks of age while older SHR-B2 animals were between 40 and 52 weeks of age. SHR-A3 (males) and SHR-B2 (females) parental lines were crossed to generate an F1 progeny. This progeny was further crossed to generate a freely segregating F2 progeny. All animal use was prospectively reviewed and approved by the University’s Animal Welfare Committee.
Blood pressure measurement
Blood pressure was measured in F2 animals by implanted telemetry (Data Sciences, St. Paul, MN) as previously reported [13]. All telemetry implants were calibrated before and after implantation by placing in a pressurized chamber at 37°C and measuring reported pressure with the chamber held at 120, 160 and 200 mmHg. Animals were implanted at 16–17 weeks of age and allowed to recover for 1–2 weeks before blood pressure recordings were made. Blood pressure was measured by continuous sampling for 30 seconds every 30 minutes for 5–7 days. In addition blood pressure was measured in 10 SHR-A3 and 8 SHR-B2 animals at 18 and 25 weeks of age.
Histological assessment of renal injury
Kidneys were harvested from isoflurane anesthetized rats by ventral laparotomy. Kidneys were cut into radial segments by hand, fixed in 4% buffered formalin and paraffin embedded using standard techniques. Five micron serial sections were stained with Periodic-Acid-Schiff’s stain (PAS) for assessment of renal injury, and Picro-sirius red to evaluate the extent of collagen accumulation. Injury scores were obtained by randomly sampling 20 glomeruli and 10 cortical tubular fields per animal. Scores were graded according to degree of injury on a scale from 1–5. Glomerular injury was graded as follows: (0) no histologic abnormality, (1) Mild mesangial thickening only, (2) Moderate mesangial expansion without thickened capillary loops, (3) severe mesangial expansion, thickened capillary loops, or segmental sclerosis, (4) global or >50% segmental sclerosis. Tubulo-interstitial disease was graded as (0) no injury, (1) mild patchy fibrosis, infiltrate <10 cells/high power field (hpf), (2) mild to moderate fibrosis, patchy tubular atrophy, infiltrate >10 cells/hpf, (3) diffuse tubular atrophy, moderate fibrosis, proteinaceous casts, diffuse interstitial infiltrate, (4) severe interstitial fibrosis with strong diffuse cellular infiltrates or tubular atrophy. For Picro-sirius stained samples, degree of fibrosis of individual stained sections viewed under low power was scored from 1 to 5 (negligible evidence of fibrosis, mild patchy fibrosis, moderate patchy fibrosis, patchy severe fibrosis and extensive severe fibrosis, respectively).
Albuminuria
We assessed albuminuria as urinary albumin:creatinine ratio (uACR). Urinary creatinine concentrations were determined by HPLC in spot urine samples collected from parental, F1 and F2 animals at 25 weeks of age by direct puncture of the urinary bladder [14]. Urine albumin was measured by an ELISA specific for rat serum albumin (Bethyl Labs, Montgomery, TX).
Assessment of renal function
We measured serum BUN and serum creatinine as an indicator of renal function in older animals. Blood was collected by aortic puncture in anesthetized laparotomized animals. Serum was separated by coagulation and centrifugation. Serum creatinine was measured by HPLC and BUN by clinical auto-analyzer (IDEXX VetTest® Chemistry Analyzer, IDEXX, Westbrook, ME).
Genotyping
SNP genotyping was performed using the Sequenom MassARRAY system [15]. PCR product was amplified in multiplex reactions as previously described [13]. PCR amplification was followed by an oligo extension reaction across the variable SNP nucleotide. Mass spectrometry analysis of the extension reactions generated spectra that were collected and SpectroCALLER software (Sequenom, Inc.) was used to automatically assign the genotype calls. The PCR and oligo extension systems targeted a total of 234 SNPs across 121 haplotype blocks that were not identical by descent (IBD) across SHR-A3 and SHR-B2 [13]. Each animal was fully genotyped using 7 high level multiplex PCR and extension reactions that yielded high quality genotype data for 203 of the 234 SNPs. Hardy-Weinberg equilibrium was verified for each SNP using Chi square test.
Genetic mapping
Mapping of renal injury traits was performed using R/qtl with Haley Knott regression with normalization of phenotypes by log transformation where appropriate [16, 17]. Physical map positions of the SNP markers were adjusted to approximate cM positions by dividing the physical position (in Mbp) by 2 [18]. Genome-wide significance was determined in R/qtl by permutation (n=1000) of the phenotypes with respect to the genotypes [19].
Statistical analysis
Comparison of data obtained from individual SHR lines was made by ANOVA followed by group difference testing using Scheffe’s test (two group) or Bonferroni’s correction (multiple group) as implemented in the package StatPlus (AnalystSoft, Inc, Vancouver, BC, Canada.) Assessment of the relationship in individual F2 animals between blood pressure and various measures of renal injury was made by regression analysis with a linear model.
Results
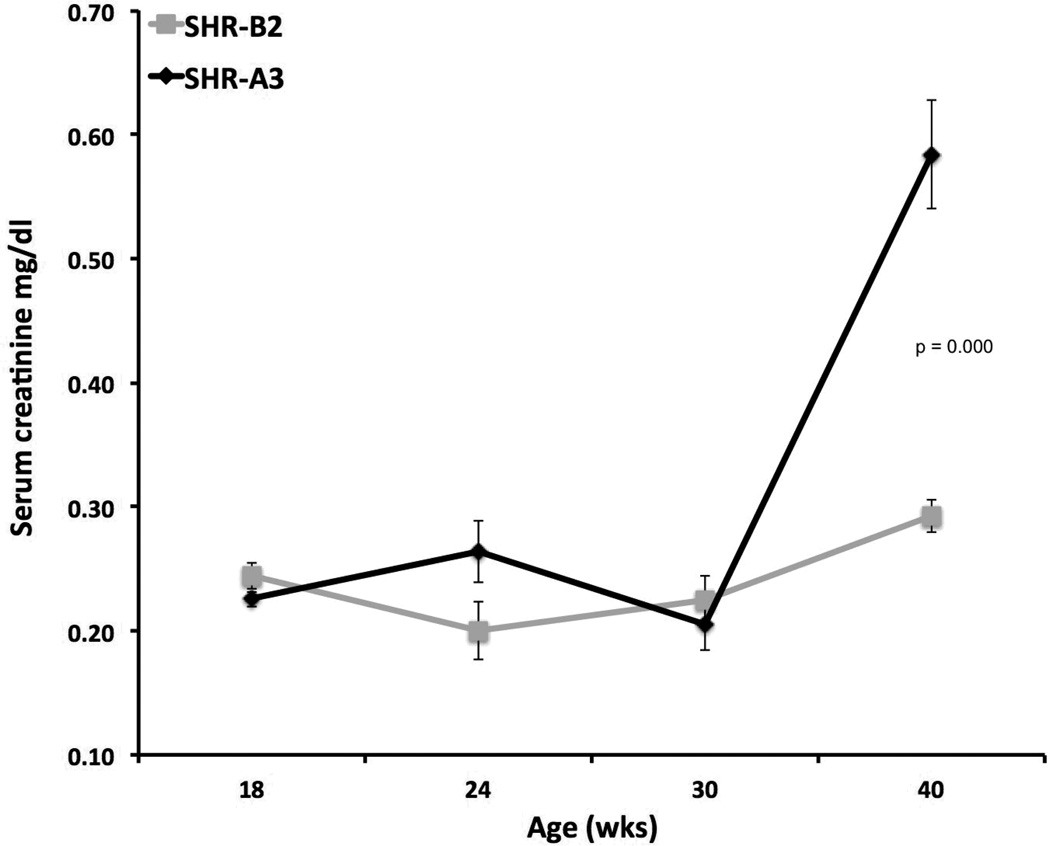
Male SHR-A3 animals in our colony rarely survive beyond 45 weeks of age when raised on a standard diet without stroke-inducing salt loading. Early mortality emerges before 40 weeks of age, occasionally as early as 25 weeks of age. We followed one cohort of 14 SHR-A3 males specifically to determine survival and observed that only 7 animals survived until 40 weeks of age. In contrast, early mortality was not observed in SHR-B2. The cause of early death in SHR-A3 on a normal sodium intake is not clear, but may include hypertensive end-organ injury in extra-renal organs (e.g., stroke and heart failure.) Affected animals showed much decreased mobility, reduced grooming, loss of body weight, dehydration and rapid decline. Loss of renal function was present in animals surviving to 40 weeks as reflected in significantly increased BUN and serum creatinine (Figure 1). Serum BUN at 40 wks was 27.1 ± 1.0 (mean ± SEM, n = 16) in SHR-A3 versus 21.0 ± 0.6 (n = 12, p=0.0001) in SHR-B2. Serum BUN did not increase as SHR-B2 aged further (21.8 ± 0.6 mg/dl, n =13, mean age 51 wks, range = 44–64 weeks). This renal function data is likely skewed by survival bias because SHR-A3 animals dying before 40 weeks may have experienced more rapid decline in renal function, but could not be included in the analysis.
Figure 1.
Decline of renal function in SHR-A3 compared with SHR-B2 animals. Progressive renal injury was reflected in significantly increased (p<0.001) serum creatinine levels at 40 weeks of age
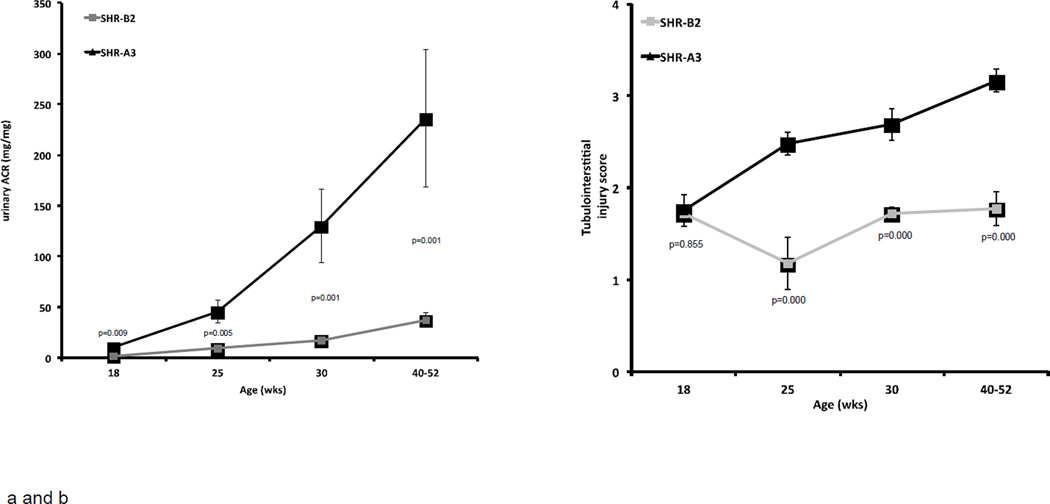
Assessment of albuminuria began at 18 weeks of age. Across the course of our measurements, SHR-A3 levels of uACR were, on average, 6.7 fold greater than those in SHR-B2 (range = 4.9 to 7.7 fold). At 18 weeks of age, SHR-A3 rats already demonstrate significantly elevated urine albumin excretion compared with SHR-B2 and this difference increases with age (Figure 2a).
Figure 2.
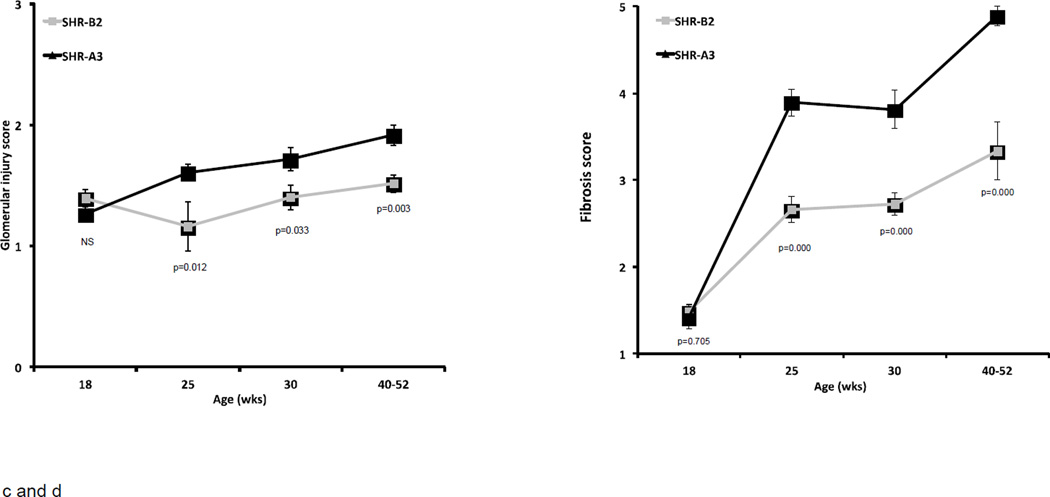
Progression of albuminuria, tubulo-interstitial injury, glomerular injury and renal fibrosis in SHR-A3 and SHR-B2 from 18 weeks of age.
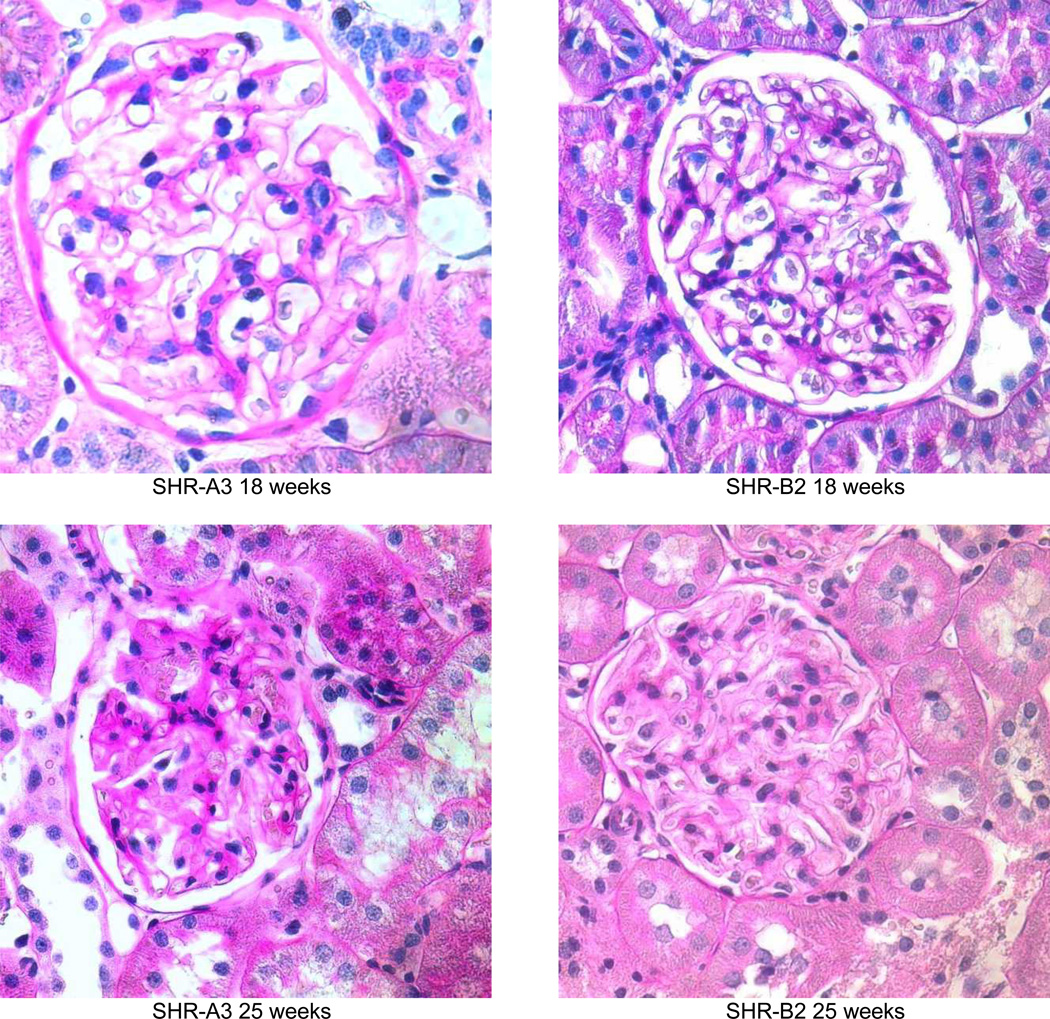
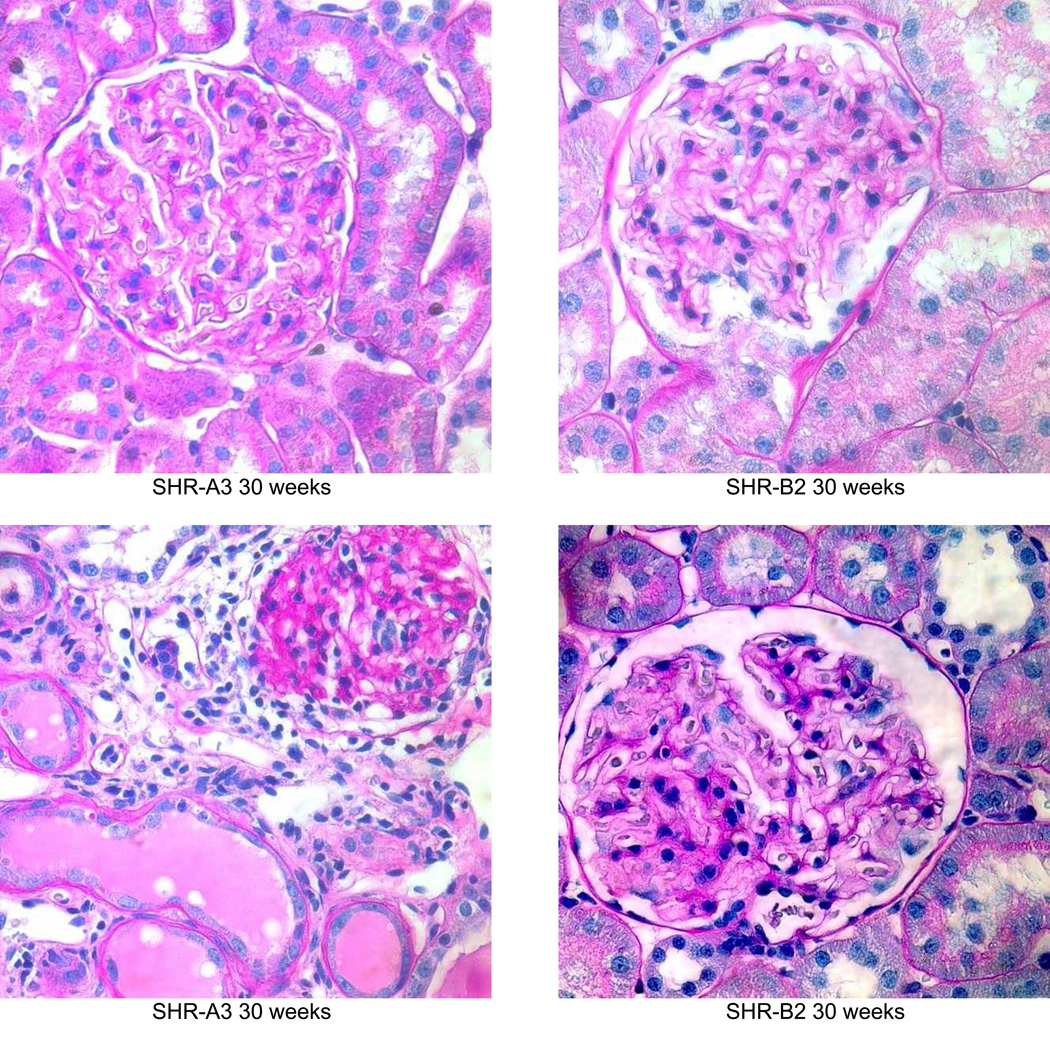
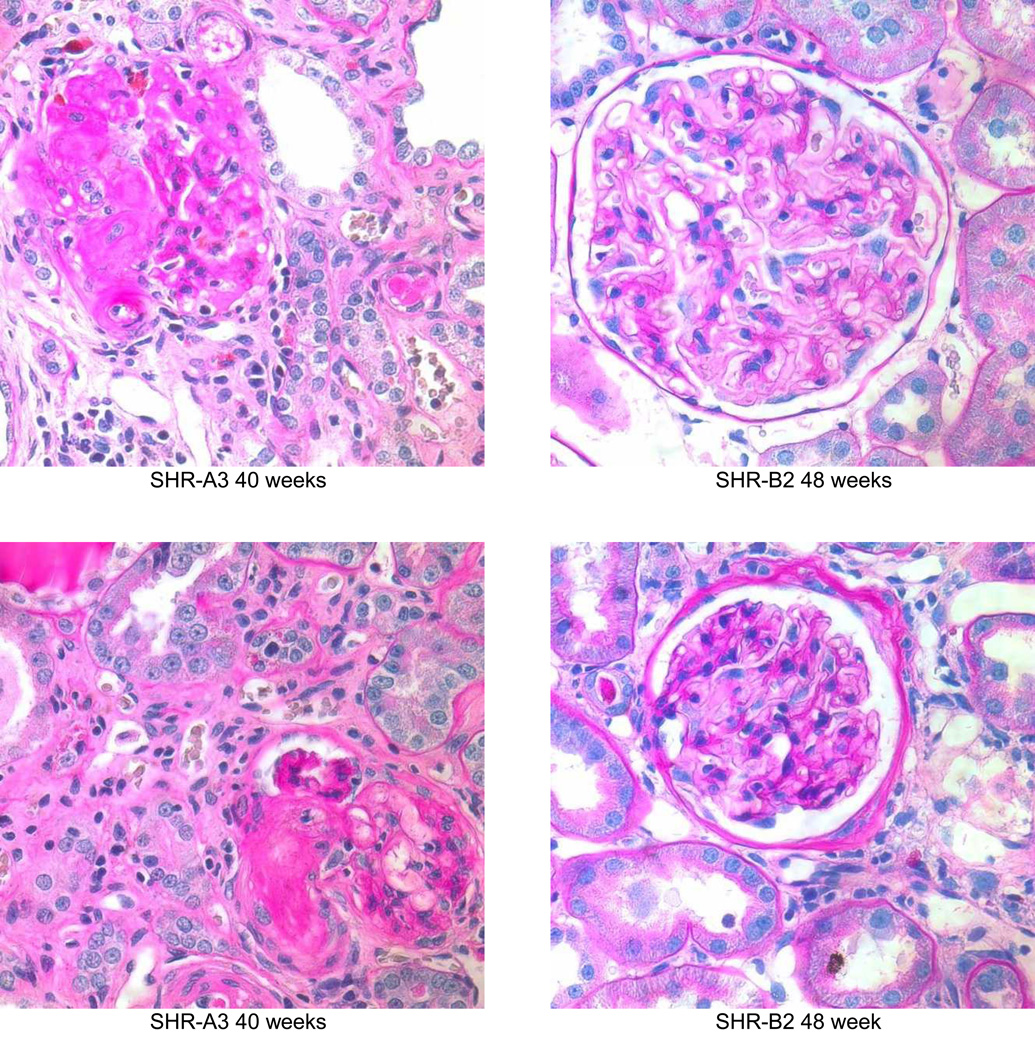
The emergence of injury observed in PAS stained kidney sections parallels the emergence of albuminuria in SHR-A3 (Figure 3). Initially, renal injury is focal within the cortex and many areas of the kidney demonstrate little histological evidence of damage. As animals age both the extent and severity of injury increases. After 18 weeks of age in SHR-A3 there is a progressive increase in glomerular damage and notable tubulo-interstitial injury with proteinaceous casts within tubules, diffuse tubular atrophy, and inflammatory cell infiltration (Figure 2b). At 18 weeks, no differences were observed in tubulo-interstitial injury scores between SHR-A3 and SHR-B2. Tubulo-interstitial injury scores increased as SHR-A3 animals aged, reflecting worsening in both the degree and extent of tissue injury. SHR-B2 animals appear protected from tubulo-interstitial injury, which did not increase as the animals aged.
Figure 3.
Periodic acid Schiff’s reagent stained sections from SHR-A3 and SHR-B2 kidneys showing the progression of renal injury from 18 weeks of age (magnification = ×400). At 19 weeks, both SHR-A3 and SHR-B2 showed normal glomerular and tubular architecture with open glomerular capillary loops, lack of mesangial matrix accumulation, no evidence of inflammatory cell infiltration and normal tubular structure. By 25 weeks, SHR-A3 showed occasional glomeruli with extensive matrix accumulation and loss of vascularity, with some atrophic tubules, while SHR-B2 showed mostly normal glomerular structure with occasional glomeruli showing evidence of matrix accumulation (as illustrated). More severe injury was observed from 30 weeks of age in SHR-A3 and 2 examples are shown to provide a broader representation. In the 30 week samples, SHR-A3 glomeruli with moderate matrix accumulation were frequently observed and more severe damage including globally sclerotic glomeruli with extensive leukocyte infiltration and tubular protein casts were found. In contrast, most glomeruli in SHR-B2 at this age retained glomerular integrity with only mild matrix accumulation. Rare examples (illustrated) of more severe glomerular matrix accumulation could be found. By 40 weeks of age, severe glomerular damage, extensive immune cell infiltration, interstitial fibrosis and tubular loss were common in SHR-A3 rats. We examined 48 week old SHR-B2 to provide more time for renal injury to progress, but once again found that glomeruli typically had only moderate matrix accumulation with more severely damaged glomeruli (illustrated) being rarely encountered.
Glomerular injury reflected a similar overall pattern to tubulo-interstitial injury with no difference apparent between SHR-A3 and SHR-B2 at 18 weeks of age (Figure 2c). Glomerular injury scores increased over time in SHR-A3 and diverged from SHR-B2 after 25 weeks of age with extensive and severe injury observed in SHR-A3 while most glomeruli reflected sparse injury with only rare examples of increased matrix accumulation and loss of capillary loops in SHR-B2 (Figure 3). Renal fibrosis, assessed in Picro-sirius red-stained sections of renal tissue, showed a similar pattern of age-related progression in SHR-A3 (Figure 2d). Fibrosis scores in 18 week old SHR-A3 and SHR-B2 were indistinguishable, but diverged at 25 weeks of age, with SHR-A3 rapidly attaining high levels of epithelial replacement.
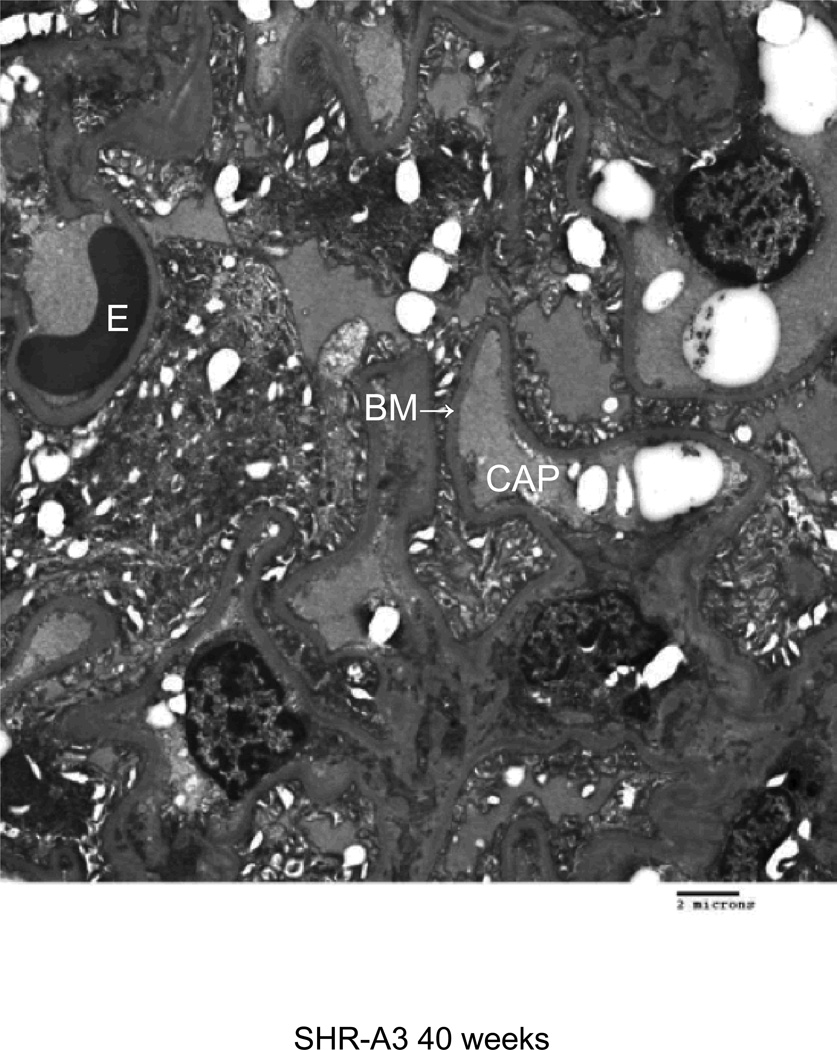
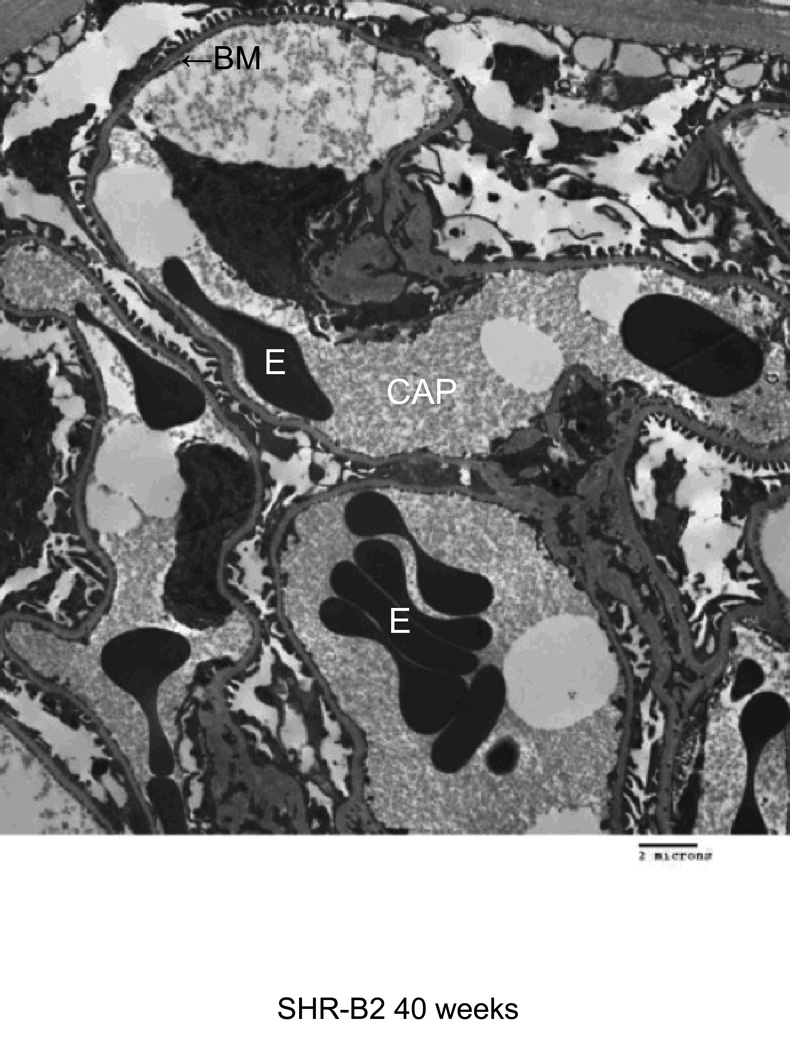
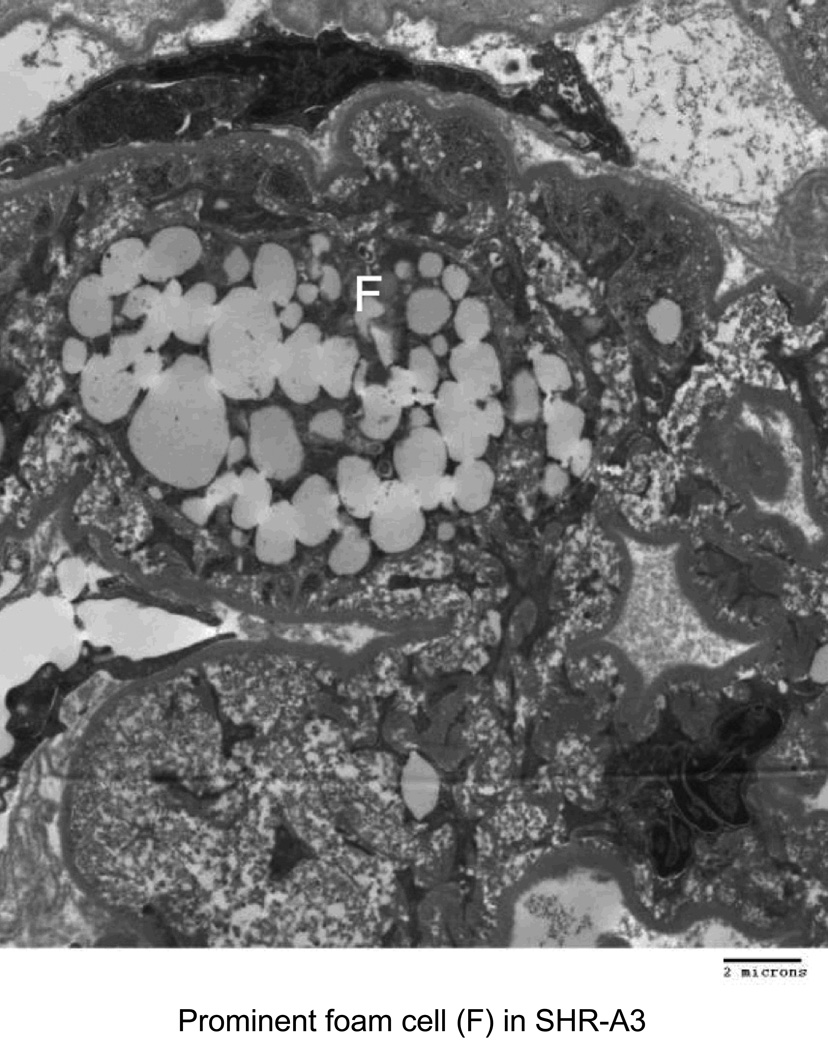
Electron microscopy was used to characterize injury to glomerular structures in 40 week old SHR-A3 and SHR-B2 (Figure 4). SHR-B2 revealed good preservation of glomerular integrity with intact foot processes and normal glomerular basement membranes. In contrast the capillary basement membranes of SHR-A3 showed thickening and wrinkling and nearly complete effacement of foot processes. Foam cells were prominent in SHR-A3 and absent in SHR-B2.
Figure 4.
Transmission electron microscope images from glomeruli of 40 week old SHR-A3 and SHR-B2 rats. The capillary lumen is labeled (CAP), as are erythrocytes (E) within the lumen. The capillary basement membrane (BM) is labeled at the arrow. Podocyte foot processes are indicated with the black arrowhead and are severely effaced in SHR-A3. Foam cells (F) were only noted in the SHR-A3 animals.
The strong divergence of renal injury traits in SHR-A3 and SHR-B2 suggested a genetic basis. This causation is supported by the reported genealogy of the lines in which selection for end-organ damage distinguishes SHR-A lines from SHR-B and SHR-C lines [2, 3]. To estimate the contributions of genes and environment to injury traits in SHR-A3 and SHR-B2 we measured renal injury in the male F1 (n=21) and F2 (n=205) progeny of an intercross between the parental lines. Since all F1 animals are genetically identical, trait variance in this progeny will reflect environmental, but not genetic effects on the trait. In contrast, the free segregation of alleles in the F2 progeny allows both genetic and environmental contributions to trait variance across individuals. Broad heritability is the portion of total phenotypic variance attributable to genetic variance and can be estimated from the F1 (environmental) and F2 (genetic plus environmental) trait variance. We found evidence of heritability of albuminuria, glomerular and tubulo-interstitial injury traits (Table 1).
Table 1.
Estimated heritability of renal injury traits.
| Trait | Heritability (%) |
|---|---|
| uACR | 48.9 |
| Glomerular injury | 66.5 |
| Tubulointerstital injury | 58.6 |
| Fibrosis | 0.0 |
Given this evidence of a role for genes in determining different susceptibility to renal injury in our lines, we performed quantitative trait locus (QTL) mapping in the F2 progeny using a panel of over 200 SNP markers tagging the 13% of the genome of the parental lines that does not arise from a common ancestor [13]. QTL mapping was performed independently for albuminuria, glomerular injury, tubulo-interstitial injury and fibrosis. No QTL’s were detected for albuminuria, tubulo-interstitial injury or fibrosis. This indicated that no single locus of large effect on these traits exists and suggests that traits may be determined by the effects of inheritance of multiple alleles at independent loci. We identified a statistically significant genome-wide LOD peak for glomerular injury on chromosome 14. The QTL maps to a narrow haplotype block in which the two lines are descended from different ancestors. This block extends from approximately chr14:70–76Mbases. The genes located in the chr 14 QTL comprise a discrete haplotype block of different descent. These genes are indicated in Table 2. The capacity of alleles at this glomerular injury locus to influence blood pressure was examined in an additive genetic model by regression analysis. No relationship between inheritance of SHR-A3 alleles at this locus and blood pressure was observed (R2 = 0.001, p = 0.992, n = 205).
Table 2.
Genes located in the Chromosome 14 glomerular injury haplotype block.
| Unique genes | Gene name | Gene code | Start location |
|---|---|---|---|
| 1 | Mediator of RNA polymerase II transcription subunit 28 | Med28 | 70,666,489 |
| 2 | Cytosol aminopeptidase | Lap3 | 70,680,078 |
| 3 | Clarin-2 | Clrn2 | 70,728,250 |
| 4 | Dihydropteridine reductase | Qdpr | 70,741,985 |
| 5 | LIM domain-binding protein 2 | Ldb2 | 71,374,736 |
| 6 | Prominin 1 isoform 2 | Prom1 | 72,122,986 |
| 7 | ADP-ribosyl cyclase 1 | Cd38 | 72,320,479 |
| 8 | F-box/LRR-repeat protein 5 | Fbxl5 | 72,471,049 |
| 9 | C1q tumor necrosis factor-related protein 7 | C1qtnf | 72,631,465 |
| 10 | Cytoplasmic polyadenylation element binding protein 2 | Cpeb2 | 72,955,778 |
| 11 | Ras-related protein Rab-28 | Rab28 | 74,401,417 |
| 12 | Fibroblast growth factor-binding protein 1 | Fgfbp1 | 72,242,271 |
| 13 | Heparan sulfate glucosamine 3-O-sulfotransferase 1 | Hs3st1 | 76,438,219 |
One potential driver of renal injury in this intercross is blood pressure. We have previously reported that at 18 weeks of age, prior to the emergence of histological evidence of renal injury, there is a significant difference in blood pressure between the parental strains [13]. We have confirmed this difference in a further group of 8 animals of each SHR line and extended this observation to 25 weeks of age at which time blood pressure levels in SHR-A3 increase further while SHR-B2 is not different from 18 weeks of age (Table 3). We previously mapped a locus with a major effect on blood pressure to chromosome 17 [13]. In the present study, we did not find a renal injury QTL in this BP locus. This raises the question of what is the relationship between blood pressure and renal injury in SHR. We examined this relationship by performing regression analysis on individual measures of blood pressure and injury in the F2 progeny. Table 4 shows that these relationships, although generally statistically significant, are not very strong. Coefficients of determination (R2) from 0.02 to 0.26 indicate that most of the variation in renal injury cannot be explained by it’s relationship to blood pressure.
Table 3.
Differences in blood pressure in SHR-A3 and SHR-B2 (n = 8–10 per group) at 18 and 25 weeks of age (P value for ANOVA testing differences at each age, post hoc testing by Tukey-Kramer test).
| Age | Line | Systolic BP (mmHg) | SEM | P value |
| 18weeks | SHR-A3 | 211.6 | 2.32 | 0.0001 |
| SHR-B2 | 169.9 | 1.65 | ||
| 25 weeks | SHR-A3 | 231.5 | 2.37 | 0.0001 |
| SHR-B2 | 176.9 | 2.18 | ||
| Age | Line | Mean BP (mmHg) | SEM | P value |
| 18weeks | SHR-A3 | 192.2 | 2.47 | 0.0001 |
| SHR-B2 | 155.1 | 1.60 | ||
| 25 weeks | SHR-A3 | 210.0 | 2.26 | 0.0001 |
| SHR-B2 | 160.2 | 2.09 | ||
| Age | Line | Diastolic BP (mmHg) | SEM | P value |
| 18weeks | SHR-A3 | 171.5 | 2.06 | 0.0001 |
| SHR-B2 | 138.4 | 1.60 | ||
| 25 weeks | SHR-A3 | 188.0 | 2.17 | 0.0001 |
| SHR-B2 | 142.8 | 2.05 | ||
Table 4.
Relationship determined by regression analysis between systolic blood pressure measured by telemetry and several measures of renal injury in male F2 progeny of an intercross between SHR-A3 and SHR-B2 rats.
| Trait | R2 | P value | n |
|---|---|---|---|
| uACR | 0.189 | 2.5 × 10⁻¹⁰ | 193 |
| Glomerular Injury | 0.018 | 0.06 | 207 |
| Tubulointerstitial Injury | 0.229 | 3.1 × 10⁻¹³ | 207 |
| Fibrosis | 0.263 | 7.6 × 10⁻¹⁵ | 201 |
Discussion
While it is clear that susceptibility to renal injury in hypertensive humans has a significant genetic component, progress in identifying the underlying genetic variation and defining the functional mechanisms that flow from such variation has been limited, with one notable exception in individuals with African ancestry [21]. Relevant animal models provide an opportunity to increase understanding of how natural allelic variation creates susceptibility to renal disease. Our previous work has shown the very close genetic relationship between injury-prone SHR-A3 and resistant SHR-B2 arising from inbreeding and shared ancestry. Our genetic analysis of the extent of identity by descent across these lines indicates that genetic variation contributing to renal injury susceptibility is likely determined in the 13% of the genome that is not shared identical by descent across these two SHR lines [13]. The involvement of genetic factors in hypertensive end-organ injury the SHR-A3 rat has been indicated in prior experiments in which salt loading was performed [22, 23]. In order to fully exploit this as a model for human disease it is necessary to understand its dependence on salt loading and how renal injury develops over time when salt intake more closely resembles that of the human diet. Our findings demonstrate that while consuming a diet containing 0.3% sodium, SHR-A3 shows a progressive course of renal injury beginning around 18 weeks of age and leading by age 40 weeks to severe renal injury and proteinuria. In contrast, SHR-B2 is highly resistant to these injuries. Thus, these two SHR lines provide a contrasting outcome of renal disease in hypertension that may provide insight into human genetic susceptibility to the same disease.
An important question is whether the renal injury experienced by the SHR-A3 line resembles injury in human hypertensives. Our first observation is that the time course is slowly progressing in relation to age, similar to that observed in humans with progressive hypertensive renal disease. The renal injury experienced by SHR-A3 manifests all of the features of progressive renal injury in hypertensive humans. Disease begins with focal lesions leaving much of the tissue unaffected. As it progresses, the extent of injury increases, however, there are areas of tissue in which normal architecture is well preserved in most animals, even at 40 wks of age. Glomerular damage initially resembles focal segmental glomerulosclerosis, but often proceeds to global sclerosis. Loss of glomerular integrity produces the common observation of proteinaceous casts in Bowman’s capsule and in the tubular lumens of SHR-A3, while luminal protein casts were uncommon in SHR-B2. Electron microscopy reveals extensive effacement of podocyte end foot processes in diseased SHR-A3 glomeruli, indicating loss of the glomerular slit diaphragm function that is consistent with the nephrotic levels of proteinuria observed in this line, and a common feature of focal segmental glomerulosclerosis in humans. Glomerular capillary basement membranes in SHR-A3 were thickened and wrinkled and there was extensive vacuolation of visceral epithelial cells. Lipid droplet-filled foam cells were also observed in SHR-A3 glomerulus, but not in SHR-B2. These cells have been previously described in glomerular injury, and have been linked to lipid-induced glomerular injury [24–27].
Extensive evidence of injury in the tubulo-interstitial compartment was observed in SHR-A3, but not in SHR-B2. This includes the presence of apoptotic tubular epithelial cells and infiltration of the interstitial compartment with inflammatory cells. Picrosirius red staining provides a simple assessment of replacement of functional renal tissue with fibrous scar. Here again, the injury-prone line revealed more rapid accumulation of fibrous material. The use of a non-linear nominal scale to assess fibrosis indicates that some fibrosis also occurs in SHR-B2. However, the two strains strongly contrast in this trait after 18 weeks of age.
Vascular injury was not observed in either SHR line, however, adaptive thickening of the arteriolar smooth muscle was observed as expected in hypertensive animals. This pattern is also typical of benign progressive nephrosclerosis in hypertensive humans. In contrast, malignant hypertensive nephrosclerosis in humans as well as renal injury in salt-loaded SHR-A3 rats [22] is associated with hyalinosis of the vascular wall, which was never observed in our animals.
Having established the features of renal injury in our SHR lines, we have examined whether it is possible to attribute these differences to genetic effects acting in these lines. Estimates of heritability (Table 1) indicate that a substantial portion of renal injury trait variation appears to arise from genetic factors. However, we did not find evidence that fibrosis was genetically determined. The genetic architecture of renal injury susceptibility in these lines is not clear. Although the trait of stroke susceptibility was rapidly fixed in three generations, it is not known if this involved selection for a single gene locus of large effect or whether selection led to the accumulation of multiple genetic variants to produce stroke susceptibility. It is likely, given the concurrence of loss of renal function and increased risk of stroke in human subjects [28, 29] and the fact that renal injury and stroke appear to be linked in SHR-A3 [4], that genetic susceptibility to stroke and renal disease may arise from an overlapping set of susceptibility alleles in this rat model. Earlier mapping efforts of renal and stroke traits in the presence of salt loading indicated polygenic inheritance in SHR-A3 [22, 30].
We used QTL mapping to determine whether we could map a major locus contributing to individual measures of renal injury. We mapped each injury measure independently because it is not clear whether, for example, susceptibility to tubulo-interstitial injury and albuminuria arise from the same genetic variation. Our mapping relied on a panel of SNP markers selected to tag the 13% of the genome that can segregate in crosses among the two lines. SNP markers offer important advantages over microsatellite genotyping including high-level automation of sample handling and automation of quality control in both genotype calling and allelic discrimination. Bar coding of DNA sample trays provides another opportunity to reduce human errors that can arise in handling large numbers of samples assayed across multiple genotyping assays. Using this method, with the same markers in this same cross, we have been able to identify loci accounting for most of the differences in blood pressure and serum immunoglobulin levels across the parental lines [13, 31]. However, our mapping studies of renal injury indicate that we could map only genetic variation affecting glomerular injury susceptibility. The failure to map QTL for other heritable injury traits indicates that genetic susceptibility may arise from more than one locus, a feature that is also shared with genetic susceptibility to hypertensive renal disease in the general population. Depending on the number of QTL and whether genetic effects at these loci are additive or interact in more complex ways, a much larger cohort of F2 animals than the >200 animals used here may be required to map genomic loci containing susceptibility alleles.
We used telemetry to assess blood pressure in the F2 animals from which renal injury scores were obtained. This allows the relationship between blood pressure and renal injury to be examined. Table 4 shows that there were robust correlations between blood pressure and several measures of renal injury, except glomerular injury. However, the coefficients of determination (R2) were small, indicating that other factors had a strong effect on renal injury. Table 2 provides a list of genes located in the chr 14 glomerular injury locus whose renal expression we have previously determined across our two lines. Among genes located within this narrowly defined QTL, fibroblast growth factor binding protein (Fgfbp1) has clear connections to glomerular damage and hypertension. Tomaszewki and colleagues have demonstrated expression of this gene in the human glomerulus and have reported that its glomerular expression is altered in the presence of hypertension [32]. Further work is required to evaluate the possible role of Fgfbp1 in glomerular injury in this rat model.
One prior effort has been reported to map renal injury loci between SHR-A3 and an injury-resistant SHR line [22]. In this report, renal injury was accelerated by providing a high sodium intake. In this report, tissue injury was scored as a single composite of vascular and renal parenchymal (glomerular and tubulo-interstitial) damage. Albumin excretion was not examined. Salt loading complicates the experimental model because it provides an opportunity to create gene by environment interactions that are not essential for emergence of disease, but which add further complexity to the underlying genetic susceptibility. Salt loading does create more rapid and extreme differences in trait expression across the lines that may assist mapping, but changes in blood pressure from salt loading also need to be fully considered. Of the three injury QTL’s mapped in this previously reported study, none were detected in the present study. Injury-resistant SHR animals have also been crossed with salt-loaded Dahl salt-sensitive rats to investigate the genetics of renal injury. This indicated that alleles from the injury-resistant SHR/N line contribute to both renal injury susceptibility and resistance, depending on the injury parameter under consideration [33, 34]. This underscores the complex genetics underlying progressive renal disease and places a premium on reduction of genetic complexity to aid in the resolution of key elements of renal injury.
In summary, we have characterized the development and progression of renal injury in the SHR-A3 line in the absence of salt loading and found that the course and histological features of renal injury are very similar to those in human hypertensives. While much of the susceptibility to renal injury is genetic, the difficulty in mapping loci containing genetic variation affecting susceptibility to injury may reflect a disease susceptibility that involves multiple independent loci in the genome.
Acknowledgments
This project was funded in part by grants from NIH R01 DK069632 (to PAD) R01 DK081866 (to PAD) and AHA 09GRNT2240045 (to PAD)
Footnotes
Competing Financial Interests.
None
Contributor Information
Michael C. Braun, Dept. Pediatrics, Baylor College of Medicine and Texas Children’s Hospital, Houston, TX, 77030
Stacy M. Herring, Institute of Molecular Medicine, University of Texas HSC at Houston, Houston, Texas 77030
Nisha Gokul, Institute of Molecular Medicine, University of Texas HSC at Houston, Houston, Texas 77030.
Monique Monita, Institute of Molecular Medicine, University of Texas HSC at Houston, Houston, Texas 77030.
Rebecca Bell, Institute of Molecular Medicine, University of Texas HSC at Houston, Houston, Texas 77030.
M. John Hicks, Dept. of Pathology and Immunology, Baylor College of Medicine and Texas Children’s Hospital, Houston, TX 77030.
Scott E. Wenderfer, Dept. Pediatrics, Baylor College of Medicine and Texas Children’s Hospital, Houston, TX, 77030
Peter A. Doris, Institute of Molecular Medicine, University of Texas HSC at Houston, Houston, Texas 77030
References
- 1.Okamoto K, Yamori Y, Nosaka S, Ooshima A, Hazama F. Studies on hypertension in spontaneously hypertensive rats. Clin Sci Mol Med Suppl. 1973;45(Suppl 1):11s–14s. doi: 10.1042/cs045011s. [DOI] [PubMed] [Google Scholar]
- 2.Nagaoka A, Iwatsuka H, Suzuoki Z, Okamoto K. Genetic predisposition to stroke in spontaneously hypertensive rats. Am J Physiol. 1976;230(5):1354–1359. doi: 10.1152/ajplegacy.1976.230.5.1354. [DOI] [PubMed] [Google Scholar]
- 3.Okamoto K, Yamori Y, Nagaoka A. Establishment of the stroke-prone spontaneously hypertensive rat. Circ Res. 1974;34/35(Suppl. 1):I-143–I-153. [Google Scholar]
- 4.Blezer EL, Schurink M, Nicolay K, Bar PR, Jansen GH, Koomans HA, et al. Proteinuria precedes cerebral edema in stroke-prone rats: a magnetic resonance imaging study. Stroke. 1998;29(1):167–174. doi: 10.1161/01.str.29.1.167. [DOI] [PubMed] [Google Scholar]
- 5.Kottgen A. Genome-wide association studies in nephrology research. American journal of kidney diseases : the official journal of the National Kidney Foundation. 2010;56(4):743–758. doi: 10.1053/j.ajkd.2010.05.018. [DOI] [PubMed] [Google Scholar]
- 6.Kottgen A, Glazer NL, Dehghan A, Hwang SJ, Katz R, Li M, et al. Multiple loci associated with indices of renal function and chronic kidney disease. Nat Genet. 2009;41(6):712–717. doi: 10.1038/ng.377. [DOI] [PMC free article] [PubMed] [Google Scholar]
- 7.Kottgen A, Pattaro C, Boger CA, Fuchsberger C, Olden M, Glazer NL, et al. New loci associated with kidney function and chronic kidney disease. Nat Genet. 2010;42(5):376–384. doi: 10.1038/ng.568. [DOI] [PMC free article] [PubMed] [Google Scholar]
- 8.Eichler EE, Flint J, Gibson G, Kong A, Leal SM, Moore JH, et al. Missing heritability and strategies for finding the underlying causes of complex disease. Nat Rev Genet. 2010;11(6):446–450. doi: 10.1038/nrg2809. [DOI] [PMC free article] [PubMed] [Google Scholar]
- 9.Hemminki K, Forsti A, Houlston R, Bermejo JL. Searching for the missing heritability of complex diseases. Human mutation. 2011;32(2):259–262. doi: 10.1002/humu.21392. [DOI] [PubMed] [Google Scholar]
- 10.Manolio TA, Collins FS, Cox NJ, Goldstein DB, Hindorff LA, Hunter DJ, et al. Finding the missing heritability of complex diseases. Nature. 2009;461(7265):747–753. doi: 10.1038/nature08494. [DOI] [PMC free article] [PubMed] [Google Scholar]
- 11.Gibbs RA, Weinstock GM, Metzker ML, Muzny DM, Sodergren EJ, Scherer S, et al. Genome sequence of the Brown Norway rat yields insights into mammalian evolution. Nature. 2004;428(6982):493–521. doi: 10.1038/nature02426. [DOI] [PubMed] [Google Scholar]
- 12.Saar K, Beck A, Bihoreau MT, Birney E, Brocklebank D, Chen Y, et al. SNP and haplotype mapping for genetic analysis in the rat. Nat Genet. 2008;40(5):560–566. doi: 10.1038/ng.124. [DOI] [PMC free article] [PubMed] [Google Scholar]
- 13.Bell R, Herring SM, Gokul N, Monita M, Grove ML, Boerwinkle E, et al. High Resolution Identity by Descent Mapping Uncovers the Genetic Basis for Blood Pressure Differences Between SHR Lines. Circulation Cardiovascular genetics. 2011;4(3):223–231. doi: 10.1161/CIRCGENETICS.110.958934. [DOI] [PMC free article] [PubMed] [Google Scholar]
- 14.Yuen PS, Dunn SR, Miyaji T, Yasuda H, Sharma K, Star RA. A simplified method for HPLC determination of creatinine in mouse serum. Am J Physiol Renal Physiol. 2004;286(6):F1116–F1119. doi: 10.1152/ajprenal.00366.2003. [DOI] [PubMed] [Google Scholar]
- 15.Gabriel S, Ziaugra L, Tabbaa D. SNP genotyping using the Sequenom MassARRAY iPLEX platform. Curr Protoc Hum Genet. 2009;Chapter 2(Unit 2):12. doi: 10.1002/0471142905.hg0212s60. [DOI] [PubMed] [Google Scholar]
- 16.Broman KW, Wu H, Sen S, Churchill GA. R/qtl: QTL mapping in experimental crosses. Bioinformatics. 2003;19(7):889–890. doi: 10.1093/bioinformatics/btg112. [DOI] [PubMed] [Google Scholar]
- 17.Haley CS, Knott SA. A simple regression method for mapping quantitative trait loci in line crosses using flanking markers. Heredity. 1992;69(4):315–324. doi: 10.1038/hdy.1992.131. [DOI] [PubMed] [Google Scholar]
- 18.Jensen-Seaman MI, Furey TS, Payseur BA, Lu Y, Roskin KM, Chen CF, et al. Comparative recombination rates in the rat, mouse, and human genomes. Genome Res. 2004;14(4):528–538. doi: 10.1101/gr.1970304. [DOI] [PMC free article] [PubMed] [Google Scholar]
- 19.Broman KW, Sen S. A Guide to QTL mapping with R/qtl. New York: Springer; 2009. [Google Scholar]
- 20.Dmitrieva RI, Hinojos CA, Grove ML, Bell RJ, Boerwinkle E, Fornage M, et al. Genome-wide identification of allelic expression in hypertensive rats. Circulation Cardiovascular genetics. 2009;2(2):106–115. doi: 10.1161/CIRCGENETICS.108.809509. [DOI] [PMC free article] [PubMed] [Google Scholar]
- 21.Genovese G, Friedman DJ, Ross MD, Lecordier L, Uzureau P, Freedman BI, et al. Association of trypanolytic ApoL1 variants with kidney disease in African Americans. Science. 2010;329(5993):841–845. doi: 10.1126/science.1193032. [DOI] [PMC free article] [PubMed] [Google Scholar]
- 22.Gigante B, Rubattu S, Stanzione R, Lombardi A, Baldi A, Baldi F, et al. Contribution of genetic factors to renal lesions in the stroke-prone spontaneously hypertensive rat. Hypertension. 2003;42(4):702–706. doi: 10.1161/01.HYP.0000084635.01667.8A. [DOI] [PubMed] [Google Scholar]
- 23.Griffin KA, Churchill PC, Picken M, Webb RC, Kurtz TW, Bidani AK. Differential salt-sensitivity in the pathogenesis of renal damage in SHR and stroke prone SHR. Am J Hypertens. 2001;14(4 Pt 1):311–320. doi: 10.1016/s0895-7061(00)01282-6. [DOI] [PubMed] [Google Scholar]
- 24.Schonholzer KW, Waldron M, Magil AB. Intraglomerular foam cells and human focal glomerulosclerosis. Nephron. 1992;62(2):130–136. doi: 10.1159/000187020. [DOI] [PubMed] [Google Scholar]
- 25.Faraj AH, Morley AR. Remnant kidney pathology after five-sixth nephrectomy in rat. II. Electron microscopy study. Apmis. 1993;101(1):83–90. doi: 10.1111/j.1699-0463.1993.tb00085.x. [DOI] [PubMed] [Google Scholar]
- 26.Magil AB. Interstitial foam cells and oxidized lipoprotein in human glomerular disease. Mod Pathol. 1999;12(1):33–40. [PubMed] [Google Scholar]
- 27.Hattori M, Nikolic-Paterson DJ, Miyazaki K, Isbel NM, Lan HY, Atkins RC, et al. Mechanisms of glomerular macrophage infiltration in lipid-induced renal injury. Kidney Int Suppl. 1999;71:S47–S50. doi: 10.1046/j.1523-1755.1999.07112.x. [DOI] [PubMed] [Google Scholar]
- 28.Seliger SL, Longstreth WT, Jr, Katz R, Manolio T, Fried LF, Shlipak M, et al. Cystatin C and subclinical brain infarction. J Am Soc Nephrol. 2005;16(12):3721–3727. doi: 10.1681/ASN.2005010006. [DOI] [PubMed] [Google Scholar]
- 29.Abramson JL, Jurkovitz CT, Vaccarino V, Weintraub WS, McClellan W. Chronic kidney disease, anemia, and incident stroke in a middle-aged, community-based population: the ARIC Study. Kidney Int. 2003;64(2):610–615. doi: 10.1046/j.1523-1755.2003.00109.x. [DOI] [PubMed] [Google Scholar]
- 30.Rubattu S, Volpe M, Kreutz R, Ganten U, Ganten D, Lindpaintner K. Chromosomal mapping of quantitative trait loci contributing to stroke in a rat model of complex human disease. Nat Genet. 1996;13(4):429–434. doi: 10.1038/ng0896-429. [DOI] [PubMed] [Google Scholar]
- 31.Herring SM, Gokul N, Monita M, Bell R, Boerwinkle E, Wenderfer SE, et al. Immunoglobulin Locus Associates with Serum IgG Levels and Albuminuria. J Am Soc Nephrol. 2011 doi: 10.1681/ASN.2010111148. [DOI] [PMC free article] [PubMed] [Google Scholar]
- 32.Tomaszewski M, Charchar FJ, Nelson CP, Barnes T, Denniff M, Kaiser M, et al. Pathway analysis shows association between FGFBP1 and hypertension. Journal of the American Society of Nephrology : JASN. 2011;22(5):947–955. doi: 10.1681/ASN.2010080829. [DOI] [PMC free article] [PubMed] [Google Scholar]
- 33.Garrett MR, Dene H, Rapp JP. Time-course genetic analysis of albuminuria in Dahl salt-sensitive rats on low-salt diet. J Am Soc Nephrol. 2003;14(5):1175–1187. doi: 10.1097/01.asn.0000060572.13794.58. [DOI] [PubMed] [Google Scholar]
- 34.Siegel AK, Kossmehl P, Planert M, Schulz A, Wehland M, Stoll M, et al. Genetic linkage of albuminuria and renal injury in Dahl salt-sensitive rats on a high-salt diet: comparison with spontaneously hypertensive rats. Physiological genomics. 2004;18(2):218–225. doi: 10.1152/physiolgenomics.00068.2004. [DOI] [PubMed] [Google Scholar]


