

Abstract
Introduction
Long chain omega-3 polyunsaturated fatty acids (LC n-3 PUFA) such as EPA and DHA have been shown to possess beneficial health effects, and it is believed that many of their effects are mediated by their oxygenated products (oxylipins). Recently, we have shown that serum levels of several hydroxy, epoxy, and dihydroxy FAs are dependent on the individual status of the parent FAs in a cohort of normo- and hyperlipidemic subjects. So far, the effect of an increased dietary LC n-3 PUFA intake on hydroxy, epoxy, and dihydroxy FA levels has not been investigated in subjects with mild combined hyperlipidemia.
Subjects and Methods
In the present study, we compared oxylipin patterns of 10 hyperlipidemic (cholesterol >200 mg/dl; triglyceride >150 mg/ml) and 10 normolipidemic men in response to twelve weeks of LC n-3 PUFA intake (1.14 g DHA and 1.56 g EPA). Levels of 44 free hydroxy, epoxy and dihydroxy FAs were analyzed in serum by LC-MS. Additionally, oxylipin levels were compared with their parent PUFA levels in erythrocyte membranes; a biomarker for the individual PUFA status.
Results
Differences in the oxylipin pattern between normo- and hyperlipidemic subjects were minor before and after treatment. In all subjects, levels of EPA-derived oxylipins (170–4,800 pM) were considerably elevated after LC n-3 PUFA intake (150–1,400 %), the increase of DHA-derived oxylipins (360–3,900 pM) was less pronounced (30–130 %). The relative change of EPA in erythrocyte membranes is strongly correlated (r ≥ 0.5; p<0.05) with the relative change of corresponding epoxy and dihydroxy FA serum levels. The effect on arachidonic acid (AA)-derived oxylipin levels (140–27,100 pM) was inconsistent.
Discussion and Conclusions
The dietary LC PUFA composition has a direct influence on the endogenous oxylipin profile, including several highly biological active EPA- and DHA-derived lipid mediators. The shift in oxylipin pattern appears to be dependent on the initial LC PUFA status particularly for EPA. The finding that also levels of other oxylipins derived from ALA, LA or AA are modified by LC n-3 PUFA intake might suggest that at least some of the effects of EPA and DHA could be mediated by a shift in the entire oxylipin profile.
Keywords: eicosanoids, epoxides, diols, EPA, DHA, PUFA, arachidonic acid, hyperlipidemia, omega-3 fatty acids
INTRODUCTION
Long chain omega-3 polyunsaturated fatty acids (LC n-3 PUFA) such as eicosapentaenoic acid (EPA, 20:5 n-3) and docosahexaenoic acid (DHA, 22:6 n-3) have been shown to possess health beneficial effects such as triglyceride-lowering, anti-inflammatory and anti-arrhythmic effects conferring cardiovascular protective qualities [1]. Accordingly, many national heart and nutrition associations recommend increased consumption of fatty fish or LC n-3 PUFA supplements to prevent cardiovascular disease (CVD). However, the molecular mediators of these effects are not well characterized. It is believed that many actions of LC n-3 PUFAs are mediated by their oxidative products – the oxylipins. Oxylipins function as potent lipid mediators regulating various biological processes such as cell proliferation, apoptosis, tissue repair, blood clotting, blood vessel permeability, inflammation, immune cell behavior and other biological functions [2,3]. Oxylipins are formed via enzymatic conversion by cyclooxygenases (e.g. COX-2), lipoxygenases (e.g. 12-LOX, 15-LOX and 5-LOX) and cytochrome P450s (CYPs, e.g. CYP2J2) [2,4,5] and are further converted by the soluble epoxide hydrolase (sEH) [6–8] and other enzymes. Many conversions are multistep reactions requiring several enzymes. In addition, oxylipins can be also formed by non-enzymatic autoxidation of LC PUFAs.
LC PUFAs such as arachidonic acid (AA, 20:4 n-6), EPA and DHA are incorporated into membrane phospholipids, where they modulate membrane fluidity, microdomain assembly and lipid raft signaling as well as the activity of ion channels and other membrane proteins [9]. Increasing the dietary intake of LC n-3 PUFAs, e.g. via fish oil supplementation, results in increasing EPA and DHA percentage as well as decreasing AA percentage in erythrocyte membranes, while it is unlikely that the total amount of fatty acids in the erythrocytes is altered by the treatment [10–12]. Therefore the relative percentage of LC PUFAs on total fatty acids in erythrocyte membranes was used to assess the long term nutrition status of LC PUFAs [13]. After release by phospholipase A2 (PLA2) and other enzymes, AA, EPA and DHA become accessible to oxylipin biosynthesis by COX, LOX, and CYP enzymes [9]. The competition between AA, EPA and DHA for the production of classical COX- and LOX-derived oxylipins has been described earlier [14]. However, these LC PUFAs are also the precursors of oxylipins such as hydroxy, epoxy and dihydroxy FAs, of which some metabolites are highly potent lipid mediators [2,15,16]. While LOX form regio- and stereo-selective hydroperoxides, which serve as precursors for leukotrienes and hepoxylins and can be reduced to hydroxy FA (HETE, HODE, HOTRrE, HEPE, HDoHE) [17], some CYPs dominantly form epoxy FA (EpOME, EpETrE, EpODE, EpETE, and EpDoPE) [2,4,5], which can be hydrolyzed to the corresponding dihydroxy FA (DiHOME, DiHETrE, DiHODE, DiHETE, and DiHDPE,) by sEH [6–8]. The effect of LC n-3 PUFA supplementation and an elevated LC n-3 PUFA status on concentrations of many n-3- as well as n-6-derived hydroxy, epoxy and dihydroxy FAs in humans is unclear. For example, in vitro studies have shown that CYP epoxygenases not only accept AA as substrate but also EPA and DHA [2,15,18]. Hence, AA, EPA and DHA compete for the same enzymes to form epoxides. There is increasing evidence that EPA- and DHA-derived epoxides are active lipid mediators similarly to anti-inflammatory and analgesic epoxides of AA [19]. In vitro and in vivo studies disclosed anti-hypertensive, anti-thrombotic, anti-atherosclerotic and anti-angiogenic properties of LC n-3 PUFA-derived epoxides [16,20]. A recent study showed that 17(18)-EpETE and 19(20)-EpDPE act as anti-arrhythmic agents, suppressing the Ca2+-induced rate of spontaneous beating of neo-natal rat cardiomyocytes, at low nanomolar concentrations [2]. Moreover, DHA-derived epoxides can inhibit angiogenesis, tumor growth and metastasis [20].
Apart from COX or LOX metabolites, the endogenous levels of LC n-3 PUFA-derived oxylipins, especially epoxy and dihydroxy FAs in human blood, are poorly examined. Human studies examining comprehensive oxylipin profiles are rare [21–25]. Only two studies investigated the effects of LC n-3 PUFA supplementation on endogenous hydroxy, epoxy and dihydroxy FA profiles and showed that LC n-3 PUFA treatment is able to affect oxylipin profiles [21,24]. However, both pilot studies focused on healthy subjects and the analysis of the sum of bound (esterified) and free oxylipins in plasma. In order to understand the role of oxylipins in health and disease, it is necessary to investigate oxylipin profiles and their variability by LC n-3 PUFA treatment, in different health states. The intention of this work is to compare free (non-esterified) oxylipin profiles of healthy subjects and subjects with mild combined hyperlipidemia after dietary LC n-3 PUFA supplementation. In a recent publication we showed that free hydroxy, epoxy and dihydroxy FA levels in serum of subjects with combined hyperlipidemia were not different from healthy subjects [26]. By contrast, serum levels of several hydroxy, epoxy, and dihydroxy FA are dependent on the individual status of the parent FA (as measured by the relative FA level in erythrocyte membranes) suggesting that free oxylipin levels can be directly influenced by the diet. The correlation was apparent for EPA in erythrocyte membranes and the serum concentration of EPA metabolites. In the present paper, we show the effect of a 12 week LC n-3 PUFA supplementation on free oxylipin levels in normo- and hyperlipidemic subjects of the same cohort from our first study. In addition, oxylipin levels were correlated with parent FA levels in erythrocyte membranes. The aim was to elucidate if and how responding oxylipin levels depend on the lipidemic state of the subjects or their baseline FA status.
MATERIALS AND METHODS
This investigator initiated study was designed and conducted according to the principles of the Good Clinical Practice Guidelines laid down in the Declaration of Helsinki and was approved by the Freiburger ethic committee.
Subjects
Subjects participated in another study aiming to compare baseline serum oxylipins concentrations of 20 normolipidemic with 20 hyperlipidemic subjects. For description of recruitment and screening procedure please see [26]. Only men were selected to compile a comparable study collective and to prevent the possible influence of hormonal changes on expression of genes coding for LC PUFA metabolizing enzymes which could hamper the attribution of observed effects to treatment. The following exclusion criteria for study participation were applied: Female; body-mass-index > 35; smoker; intake of any corticosteroids, lipid-lowering or anti-inflammatory drugs; diagnosed chronic, cardiovascular or liver diseases; gastrointestinal disorders; blood coagulation disorders and intake of coagulation-inhibiting drugs; renal failure; periodic intake of laxatives; ingestion of supplements enriched with LC n-3 PUFAs, phytosterols, polyglucosamines, other lipid-binding ingredients or daily eating of fatty fish; allergy to fish or fish oil; participation in another clinical study < 30 days before the start of the study or at the same time. 10 normolipidemic and 10 hyperlipidemic men aged between 24 and 48 years were randomly selected to take part in the intervention period with fish oil capsules. The serum lipid levels of the hyperlipidemic group (HG; total cholesterol [TC] > 200 mg/dl; LDL > 130 mg/dl; TG > 150 mg/dl) were significantly higher compared to the normolipidemic group (NG; < 200 mg/dl; LDL < 130 mg/dl; TG < 150 mg/dl)), while HDL levels were lower, respectively (Table S1). Likewise, the HG had a higher mean weight and BMI, while differences in age were not significant. All included subjects gave their written informed consent to take part in the study.
Study design
To realize a comparable mean age between both groups, the group formation was performed by stratified allocation according to subject’s age. Subjects ingested six fish oil capsules per day for a period of twelve weeks. Each soft gelatin capsule contained fish oil concentrate (840 mg/ capsule) containing 252 mg EPA and 168 mg DHA as re-esterified triglycerides. The total amount of LC PUFAs (C20:5, C22:6, C18:3, C18:4; C20:4, C21:5, C22:5) was 504 mg. Additionally, each soft gelatin capsule contained 6 mg α-tocopherole. The daily LC n-3 PUFA intake was 3.0 g with 1.14 g DHA and 1.56 g EPA. The subjects were instructed to take three capsules in the morning and three in the evening together with food and a glass of water. Usual exercise and dietary habits should be maintained throughout the intervention time. Moreover, subjects were requested to abstain from eating fatty fish during the intervention period. During the two visits, fasting blood was collected from subjects. Additionally, subjects completed a questionnaire to obtain information about changes in medication, diet (e.g. changes in weekly fish intake, preferred fish dishes or species, respectively) and lifestyle habits (e.g. physical activity), as well as the tolerability of the capsules. The subjects’ compliance was assessed by capsule-intake diaries and a count of left-over capsules at the end of the intervention period.
Sample collection and analysis
Blood samples were collected in the morning between 6:00 and 9:30 a.m. after overnight fasting. The samples were obtained by venipuncture of an arm vein into 10 ml BD Vacutainer Blood Collection Tubes (article no.: 367896, Becton Dickinson, Heidelberg, Germany) containing silicate particles as clot activators. After 30 min incubation at room temperature, tubes were centrifuged for 10 min at 2000 x g and serum was transferred into 15 mL falcon tubes (Becton Dickinson) and immediately frozen and stored at −80°C upon extraction and LC-MS analysis. Other sets of blood samples collected simultaneously were sent to external laboratories for the measurement of clinical parameters. Serum lipid levels were determined by the LADR laboratory, Hannover, Germany. Erythrocyte membrane FA composition was determined in EDTA-stabilized whole blood at Omegametrix, Martinsried, Germany as previously described [13]. Results are presented as a percentage of the total identified FAs. Analysis of free (non- esterified) oxylipin levels in serum was carried out by liquid chromatography-electrospray ionization tandem mass spectrometry (LC-ESI-MS) based on a method already described in [19,27,28] and modified as previously described [26]. Only oxylipins which exceeded the limit of quantification in ≥ 95 % of the serum samples were used for data analysis. Based on this criterion 8(9)-EpETE, 8,9-DiHETE, and 7,8-DiHDPE were excluded.
Data analysis and statistics
Results for anthropometrical measures and lipid levels are presented as mean ± SD (Table S1), while erythrocyte membrane FA levels and serum free oxylipin levels are presented as mean ± SE. The sample sets were analyzed for their distribution by the Kolmogorov–Smirnov test. An independent sample t-test for normal distributed variables was used to reveal significant differences between groups. In cases of skewed distribution, the Mann–Whitney U test was used. Differences between baseline (t0) and 12 weeks of intervention (t12) within groups were analysed by t-tests for paired samples and the Wilcoxon test for skewed distributed variables. All ratios were calculated on individual level and results are shown as mean ± SE. The influence of the EPA status on the variation of the EPA-derived eicosanoid levels was investigated by subdividing study participants into two groups with low and high EPA status. For this purpose, the total study population was divided into tertiles based on EPA levels in erythrocyte membranes and in the following analysis, groups with low and high EPA status were compared. Correlation analysis of the normally distributed variables was carried out by the Pearson method. Statistical significance was generally accepted at p ≤ 0.05. All statistical analyses were carried out with SPSS software (Version 20, SPSS Inc., Chicago, IL, USA).
RESULTS
The LC n-3 PUFA capsules were well tolerated. The compliance was high (>90 %) and all subjects completed the study. The percentage of total fatty acids for LA, AA, ALA, EPA and DHA in erythrocyte membranes (Table 1) as well as concentration of free oxylipins (hydroxy, epoxy, dihydroxy FA) in serum (Table 2) were quantified in blood samples of 20 study participants before and after 12 weeks of LC n-3 PUFA treatment.
Table 1.
Ratio of unsaturated FA in erythrocyte membranes in the total study population and the normo- and hyperlipidemic subgroups at baseline and after 12 weeks of LC n-3 PUFA treatment. Significant differences between the two time points were determined by dependent sample t-test for normal distributed variables and the Wilcoxon test for skewed distributed variables. Significant differences between normo- and hyperlipidemic groups were observed by independent sample t-test for normal distributed variables and the Mann–Whitney U test for skewed distributed variables.
| Total study population (n=20) | fold change ±SE (t0→t12) | P (t0 vs. t12) | Normolipidemic group (n=10) | fold change ± SE (t0→t12) | P (t0 vs. t12) | Hyperlipidemic group (n=10) | fold change±SE (t0→t12) | P (t0 vs. t12) | P (no. vs. hy.) | ||
|---|---|---|---|---|---|---|---|---|---|---|---|
| mean ± SE | mean ± SE | mean ± SE | |||||||||
| LA [% of total FA] | t0 | 16.0±0.47 | 15.6 ± 0.58 | 16.4 ± 0.75 | |||||||
| t12 | 11.7 ± 0.36 | 0.7±0.0 | <0.001 | 11.3 ± 0.50 | 0.7±0.1 | <0.001 | 12.2 ± 0.51 | 0.8±0.1 | 0.002 | ||
|
| |||||||||||
| AA [% of total FA] | t0 | 14.4 ± 0.49 | 16.0 ± 0.26 | 12.9 ± 0.66 | <0.001 | ||||||
| t12 | 12.5 ± 0.28 | 0.9±0.0 | <0.001 | 13.0 ± 0.21 | 0.8±0.0 | <0.001 | 12.0 ± 0.48 | 0.9±0.0 | |||
|
| |||||||||||
| ALA [% of total FA] | t0 | 0.33 ± 0.05 | 0.25 ± 0.04 | 0.41 ± 0.08 | |||||||
| t12 | 0.21 ± 0.03 | 0.7±0.1 | 0.004 | 0.14 ± 0.01 | 0.7±0.1 | 0.008 | 0.28 ± 0.04 | 0.8±0.2 | 0.01 | ||
|
| |||||||||||
| EPA [% of total FA] | t0 | 0.92 ± 0.07 | 0.85 ± 0.06 | 0.98 ± 0.13 | |||||||
| t12 | 3.64 ± 0.18 | 4.3±0.4 | <0.001 | 3.82 ± 0.19 | 4.7±0.5 | <0.001 | 3.47 ± 0.32 | 3.9±0.5 | <0.001 | ||
|
| |||||||||||
| DHA [% of total FA] | t0 | 4.14 ± 0.24 | 4.39 ± 0.21 | 3.89 ± 0.42 | |||||||
| t12 | 6.75 ± 0.16 | 1.7±0.1 | <0.001 | 6.87 ± 0.25 | 1.6±0.1 | <0.001 | 6.62 ± 0.23 | 1.8±0.1 | <0.001 | ||
no. = normolipidemic, hy. = hyperlipidemic.
Table 2.
Concentration of free oxylipins (hydroxy, epoxy, dihydroxy FA) in serum in the total study population and the normo- and hyperlipidemic subgroups at baseline and after 12 weeks of LC n-3 PUFA treatment. Significant differences between the two time points were determined by dependent sample t-test for normal distributed variables and the Wilcoxon test for skewed distributed variables. Significant differences between normo- and hyperlipidemic groups were observed by independent sample t-test for normal distributed variables and the Mann–Whitney U test for skewed distributed variables. It should be noted that the analytical method did not cover all possibly formed hydroxy FAs.
| Total study population (n=20) |
fold change ±SE (t0→t12) |
P (t0 vs. t12) |
Normolipidemic group (n=10) |
fold change ±SE (t0→t12) |
P (t0 vs. t12) |
Hyperlipidemic group (n=10) |
fold change ±SE (t0→t12) |
P (t0 vs. t12) |
P (no. vs. hy.) |
|||||
|---|---|---|---|---|---|---|---|---|---|---|---|---|---|---|
| mean ± SE | mean ± SE | mean ± SE | ||||||||||||
| LA-derived oxylipins | Hydroxy FA | 9-HODE [pM] | t0 | 5,700 ± 610 | 5,100 ± 880 | 6,200 ± 870 | ||||||||
| t12 | 6,500 ± 920 | 1.2±0.1 | 7,500 ±1,500 | 1.5±0.2 | 0.032 | 5,500 ± 1,100 | 0.9±0.1 | |||||||
| 13-HODE [pM] | t0 | 7,400±820 | 6,800±1,100 | 7,900 ± 1,300 | ||||||||||
| t12 | 6,300±630 | 1.0±0.1 | 7,400±960 | 1.2±0.2 | 5,300 ± 740 | 0.8±0.1 | ||||||||
|
| ||||||||||||||
| Epoxy FA | 9(10)-EpOME[pM] | t0 | 6,300±1,100 | 6,700±1,700 | 6,000 ± 1,600 | |||||||||
| t12 | 2,600±680 | 0.6±0.2 | 0.007 | 3,500±1,200 | 0.8±0.3 | 1,800 ± 590 | 0.4±0.1 | 0.02 | ||||||
| 12(13)-EpOME[pM] | t0 | 7,200±1,100 | 7,300±1,700 | 7,000 ± 1,500 | ||||||||||
| t12 | 3,200±670 | 0.6±0.1 | 0.004 | 3,900±1,200 | 0.8±0.3 | 2,500 ± 540 | 0.5±0.1 | 0.007 | ||||||
|
| ||||||||||||||
| Dihydroxy FA | 9,10-DiHOME [pM] | t0 | 3,700±930 | 3,000±670 | 4,300 ± 1,800 | |||||||||
| t12 | 2,600±330 | 1.1±0.2 | 2,900±530 | 1.3±0.3 | 2,200 ± 380 | 1.0±0.2 | ||||||||
| 12,13-DiHOME [pM] | t0 | 5,900±620 | 6,500±900 | 5,300 ± 840 | ||||||||||
| t12 | 5,200±630 | 1.0±0.1 | 5,900±1,000 | 1.0±0.2 | 4,400 ± 700 | 0.9±0.1 | ||||||||
|
| ||||||||||||||
| AA-derived oxylipins | Hydroxy FA | 5-HETE [pM] | t0 | 1,400±90 | 1,400±110 | 1,400 ± 120 | ||||||||
| t12 | 1,400±380 | 1.1±0.1 | 1,500±130 | 1.1±0.2 | 1,200 ± 95 | 1.0±0.1 | ||||||||
| 8-HETE [pM] | t0 | 340±20 | 380±31 | 310 ± 21 | ||||||||||
| t12 | 350±27 | 1.0±0.1 | 410±42 | 1.1±0.1 | 280 ± 15 | 0.9±0.1 | 0.012 | |||||||
| 9-HETE [pM] | t0 | 180±11 | 200±11 | 150 ± 14 | 0.007 | |||||||||
| t12 | 140±12 | 0.8±0.1 | 0.011 | 160±12 | 0.8±0.1 | 0.032 | 110 ± 17 | 0.9±0.2 | 0.031 | |||||
| 11-HETE [pM] | t0 | 570±120 | 730±210 | 400 ± 76 | ||||||||||
| t12 | 750±200 | 1.3±0.1 | 1,100±370 | 1.5±0.2 | 390 ± 82 | 1.1±0.1 | ||||||||
| 12-HETE [pM] | t0 | 13,800±3,900 | 19,800±7,000 | 7,800 ± 2,900 | ||||||||||
| t12 | 27,100±7,500 | 2.8±0.6 | 0.013 | 43,200±13,000 | 2.7±0.7 | 0.019 | 11,000 ± 2,900 | 3.0±1.0 | 0.037 | |||||
| 15-HETE[pM] | t0 | 1,100±160 | 1,400±290 | 900 ± 110 | ||||||||||
| t12 | 1,400±320 | 1.2±0.1 | 2,000±590 | 1.5±0.2 | 840 ± 120 | 1.0±0.1 | ||||||||
|
| ||||||||||||||
| Epoxy FA | 8(9)-EpETrE[pM] | t0 | 600±89 | 650±150 | 540 ± 110 | |||||||||
| t12 | 310±58 | 0.7±0.2 | 0.012 | 390±110 | 1.0±0.3 | 220 ± 36 | 0.5±0.1 | 0.007 | ||||||
| 11(12)-EpETrE [pM] | t0 | 1,300±200 | 1,400±320 | 1,200 ± 250 | ||||||||||
| t12 | 640±150 | 0.6±0.2 | 0.007 | 860±270 | 0.8±0.3 | 410 ± 120 | 0.4±0.1 | 0.005 | ||||||
| 14(15)-EpETrE[pM] | t0 | 1,200±170 | 1,300±260 | 1,100 ± 220 | ||||||||||
| t12 | 580±130 | 0.6±0.1 | 0.003 | 750±220 | 0.7±0.2 | 420 ± 120 | 0.4±0.1 | 0.005 | ||||||
|
| ||||||||||||||
| Dihydroxy FA | 8,9-DiHETrE [pM] | t0 | 330±40 | 260±23 | 400 ± 71 | |||||||||
| t12 | 250±32 | 0.8±0.1 | 0.001 | 200±15 | 0.8±0.1 | 0.046 | 290 ± 60 | 0.8±0.1 | 0.013 | |||||
| 11,12-DiHETrE [pM] | t0 | 540±33 | 530±45 | 550 ± 51 | ||||||||||
| t12 | 420±31 | 0.8±0.1 | 0.005 | 430±44 | 0.8±0.1 | 420 ± 47 | 0.8±0.1 | 0.021 | ||||||
| 14,15-DiHETrE [pM] | t0 | 700±27 | 670±33 | 720 ± 44 | ||||||||||
| t12 | 570±27 | 0.8±0.0 | 0.001 | 560±25 | 0.9±0.1 | 0.043 | 590 ± 49 | 0.8±0.0 | 0.004 | |||||
|
| ||||||||||||||
| ALA-derived oxylipins | Hydroxy FA | 9-HOTrE [pM] | t0 | 400±63 | 380±99 | 410 ± 84 | ||||||||
| t12 | 500±100 | 1.2±0.1 | 570±190 | 1.4±0.2 | 440 ± 110 | 1.1±0.2 | ||||||||
| 13-HOTrE [pM] | t0 | 370±42 | 380±74 | 350 ± 50 | ||||||||||
| t12 | 340±55 | 0.9±0.1 | 350±70 | 1.0±0.1 | 330 ± 86 | 0.9±0.1 | ||||||||
|
| ||||||||||||||
| Epoxy FA | 9(10)-EpODE [pM] | t0 | 1,200±270 | 1,300±430 | 1,000 ± 350 | |||||||||
| t12 | 400±120 | 0.6±0.2 | 0.013 | 570±220 | 0.8±0.3 | 230 ± 70 | 0.4±0.1 | |||||||
| 12(13)-EpODE [pM] | t0 | 570±130 | 620±200 | 530 ± 180 | ||||||||||
| t12 | 250±64 | 0.7±0.1 | 0.017 | 330±120 | 0.8±0.3 | 180 ± 33 | 0.5±0.1 | |||||||
| 15(16)-EpODE [pM] | t0 | 4,000±680 | 3,900±930 | 4,100 ± 1,100 | ||||||||||
| t12 | 2,500±400 | 0.7±0.1 | 0.008 | 2,700±710 | 0.8±0.2 | 2,200 ± 380 | 0.7±0.1 | 0.047 | ||||||
|
| ||||||||||||||
| Dihydroxy FA | 9,10-DiHODE [pM] | t0 | 110±18 | 120±28 | 96 ± 22 | |||||||||
| t12 | 110±19 | 1.2±0.2 | 130±31 | 1.3±0.3 | 97 ± 23 | 1.1±0.2 | ||||||||
| 12,13-DiHODE [pM] | t0 | 150±20 | 180±33 | 110 ± 19 | ||||||||||
| t12 | 160±21 | 1.3±0.2 | 180±32 | 1.1±0.2 | 150 ± 29 | 1.5±0.3 | ||||||||
| 15,16-DiHODE [pM] | t0 | 11,100±1,700 | 10,700±1,500 | 11,500 ± 3,100 | ||||||||||
| t12 | 9,100±830 | 1.0±0.1 | 9,500±1,300 | 0.9±0.1 | 8,700 ± 1,000 | 1.0±0.2 | ||||||||
|
| ||||||||||||||
| EPA-derived oxylipins | Hydroxy FA | 5-HEPE [pM] | t0 | 310±37 | 260±41 | 360 ± 61 | ||||||||
| t12 | 1,200±120 | 4.8±0.6 | <0.001 | 1,300±140 | 5.9±0.9 | <0.001 | 1,100 ± 190 | 3.7±0.6 | 0.005 | |||||
| 8-HEPE [pM] | t0 | <70a | <70a | <70a | ||||||||||
| t12 | 430±92 | 430±100 | 430 ± 160 | |||||||||||
| 12-HEPE [pM] | t0 | 370±90 | 490±160 | 250 ± 70 | ||||||||||
| t12 | 4,800± 1,400 | 15.4±3.1 | 0.004 | 7,900 ± 2,500 | 19.6±4.7 | 0.012 | 1,700 ± 410 | 11.3±3.8 | 0.006 | 0.035 | ||||
| 15-HEPE [pM] | t0 | 120 ± 12 | 110 ± 13 | 130 ± 20 | ||||||||||
| t12 | 380 ± 43 | 3.8±0.5 | <0.001 | 470 ± 70 | 4.8±0.8 | <0.001 | 290 ± 36 | 2.7±0.5 | 0.004 | 0.031 | ||||
|
| ||||||||||||||
| Epoxy FA | 11(12)-EpETE [pM] | t0 | 180 ± 35 | 180 ± 49 | 190 ± 53 | |||||||||
| t12 | 320 ± 88 | 2.8±0.8 | 450 ± 160 | 4.3±1.4 | 180 ± 60 | 1.4±0.4 | ||||||||
| 14(15)-EpETE [pM] | t0 | 210 ± 42 | 210 ± 58 | 210 ± 64 | ||||||||||
| t12 | 430 ± 100 | 3.9±1.2 | 0.035 | 570 ± 190 | 4.3±1.8 | 300 ± 84 | 3.5±1.8 | |||||||
| 17(18)-EpETE [pM] | t0 | 320 ± 46 | 310 ± 62 | 340 ± 70 | ||||||||||
| t12 | 620 ± 120 | 2.5±0.6 | 0.023 | 780 ± 220 | 3.3±1.1 | 460 ± 97 | 1.6±0.3 | |||||||
|
| ||||||||||||||
| Dihydroxy FA | 11,12-DiHETE [pM] | t0 | 46 ± 4 | 41 ± 4 | 51 ± 6 | |||||||||
| t12 | 170 ± 19 | 4.1±0.5 | <0.001 | 170 ± 14 | 4.4±0.5 | <0.001 | 180 ± 37 | 3.8±0.8 | 0.007 | |||||
| 14,15-DiHETE [pM] | t0 | 79 ± 5 | 70 ± 6 | 88 ± 8 | ||||||||||
| t12 | 260 ± 24 | 3.4±0.3 | <0.001 | 260 ± 26 | 3.9±0.5 | <0.001 | 270 ± 41 | 3.0±0.3 | 0.001 | |||||
| 17,18-DiHETE [pM] | t0 | 500 ± 37 | 440 ± 38 | 560 ± 59 | ||||||||||
| t12 | 1,600 ± 150 | 3.4±0.3 | <0.001 | 1,500 ± 140 | 3.6±0.4 | <0.001 | 1,700 ± 270 | 3.2±0.4 | 0.001 | |||||
|
| ||||||||||||||
| DHA-derived oxylipins | Epoxy FA | 10(11)-EpDPE [pM] | t0 | 690 ± 110 | 750 ± 170 | 620 ± 150 | ||||||||
| t12 | 750 ± 180 | 1.5±0.3 | 1,000 ± 320 | 1.9±0.6 | 470 ± 110 | 1.0±0.2 | ||||||||
| 13(14)-EpDPE [pM] | t0 | 460 ± 76 | 510 ± 110 | 410 ± 100 | ||||||||||
| t12 | 470 ± 130 | 1.3±0.4 | 670 ± 230 | 1.8±0.7 | 270 ± 84 | 0.8±0.1 | ||||||||
| 16(17)-EpDPE [pM] | t0 | 470 ± 77 | 520 ± 120 | 420 ± 110 | ||||||||||
| t12 | 500 ± 130 | 1.4±0.3 | 710 ± 230 | 1.9±0.7 | 290 ± 89 | 0.8±0.1 | ||||||||
| 19(20)-EpDPE [pM] | t0 | 970 ± 150 | 1,000 ± 220 | 900 ± 220 | ||||||||||
| t12 | 1,200 ± 290 | 1.6±0.4 | 1,600 ± 520 | 2.0±0.7 | 760 ± 180 | 1.1±0.2 | ||||||||
|
| ||||||||||||||
| Dihydroxy FA | 10,11-DiHDPE [pM] | t0 | 160 ± 21 | 130 ± 11 | 190 ± 40 | |||||||||
| t12 | 360 ± 64 | 2.3±0.2 | <0.001 | 320 ± 31 | 2.7±0.3 | <0.001 | 390 ± 130 | 1.9±0.2 | 0.044 | |||||
| 13,14-DiHDPE [pM] | t0 | 180 ± 15 | 170 ± 14 | 200 ± 27 | ||||||||||
| t12 | 370 ± 34 | 2.0±0.1 | <0.001 | 370 ± 31 | 2.2±0.2 | <0.001 | 360 ± 62 | 1.8±0.1 | 0.002 | |||||
| 16,17-DiHDPE [pM] | t0 | 250 ± 20 | 230 ± 17 | 280 ± 37 | ||||||||||
| t12 | 500 ± 42 | 2.0±0.1 | <0.001 | 490 ± 33 | 2.2±0.2 | <0.001 | 510 ± 79 | 1.9±0.1 | 0.001 | |||||
| 19,20-DiHDPE [pM] | t0 | 2,100 ± 160 | 2,100 ± 200 | 2,000 ± 250 | ||||||||||
| t12 | 3,900 ± 310 | 2.0±0.1 | <0.001 | 3,900 ± 310 | 2.0±0.2 | <0.001 | 3,900 ± 550 | 2.0±0.2 | 0.001 | |||||
c≤LOQ, 70 pM in serum.
no. = normolipidemic, hy. = hyperlipidemic.
Fatty acid composition of erythrocyte membranes
At baseline linoleic acid (LA, 18:2) and AA were present in highest concentrations (16.0 and 14.4 % of total FAs) among the LC-PUFA measured, followed by DHA (4.14 % of total FAs), EPA (0.92 % of total FAs), and alpha-linolenic acid (ALA, 18:3; 0.33 % of total FAs; Table 1). Normolipidemic subjects showed significantly higher AA levels at baseline compared to hyperlipidemic subjects, while for LA, ALA, EPA and DHA levels were similar in both groups. After twelve weeks of LC n-3 PUFA supplementation, levels of LA, AA, and ALA were lowered (LA: −26 %, p<0.001 in the NG; −24 %, p=0.002 in the HG; AA: −18 %, p<0.001 in the NG; −6 %, p=0.114 in the HG; ALA: −35 %, p=0.008 in the NG; −17 %, p=0.089 in the HG) in both groups (Table 1, pFigure 1). In contrast, EPA and DHA levels were significantly elevated after LC n-3 PUFA treatment. However, there was a great difference in the increase of EPA compared to DHA. EPA levels increased massively (375 %, <0.001 in the NG; 292 %, p<0.001 in the HG), while the increase in DHA levels was moderate (58 %, p<0.001 in the NG; 82 %, p<0.001 in the HG).
Figure 1.

Mean percentage change of unsaturated FAs (LA, C18:2 n-6; AA, C20:4 n-6; ALA, C18:3 n-3; EPA, C20:5 n-3; DHA, C22:6 n-3) ratios in erythrocyte membranes (first bar in dashed box) and corresponding oxylipin concentrations in serum after 12 weeks of LC n-3 PUFA treatment. All results are shown for the total study population (n=20) as the mean ± SE. Significant differences were determined by dependent sample t-test for normal distributed variables and the Wilcoxon test for skewed distributed variables. * p<0.05, ** p<0.005, *** p<0.001. It should be noted that the analytical method did not cover all hydroxy FA, particularly data on hydroxy-DHA and several of hydroxy-EPA (e.g. 18-HEPE) are lacking. Thus, changes in the levels of these mediators by the LC n-3 PUFA treatment are not reflected in the figure.
Serum oxylipin levels at baseline
44 hydroxy, epoxy and dihydroxy FA could be detected and quantified in more than 95 % of the human serum samples (Table 2). The concentration range of the different oxylipin concentrations was large, ranging from 50 pM to 20 nM. Among the 44 oxylipins quantified, LA metabolites were present in highest concentrations ranging from 3 nM (9,10-DiHOME) to 8 nM (13-HODE) at baseline, whereas AA and ALA metabolites were found in wide range of concentrations. For example, 15,16-DiHODE and 12-HETE were found in concentrations of 11 and 20 nM in the NG, respectively. In contrast, levels of AA-derived 9-HETE (150–200 pM) or ALA-derived 9,10-DiHODE (~ 100 pM) and 12,13-DiHODE (110–180 pM) were a hundred times lower. Compared to oxylipins from LA and AA, baseline concentration of EPA and DHA metabolites were low, ranging from 50 pM (11,12-DiHETE) to 2 nM (19,20-DiHDPE). Highest EPA-metabolite concentrations were observed for 12-HEPE (370 pM) and 17,18-DiHETE (500 pM), while the majority of other EPA-derived hydroxy, epoxy and dihydroxy FA were detected in concentration ranges from 100 to 500 pM. Especially, the levels of 11,12-DiHETE and 14,15-DiHETE were lower than 100 nM, while 8-HEPE was detected, however, in levels below the limit of quantification. Similarly, DHA-derived dihydroxy FA levels were very low (100–300 pM), except for 19,20-DiHDPE with 6- to 20-fold higher levels (~2,000 pM). In contrast, levels of DHA-derived epoxy FA were higher, ranging from 500 to 1,000 pM. At baseline, no differences in concentrations of EPA- and DHA-derived oxylipins were observed between the NG and HG. Likewise, there were no differences between the NG and HG, except for 9-HETE, where slightly higher levels were observed in the NG.
Changes in serum oxylipin levels following LC n-3 PUFA treatment
After LC n-3 PUFA treatment, all EPA- and DHA-derived oxylipins were increased (Table 2, Figure 1). Especially EPA-derived oxylipins increased vastly in response to LC n-3 PUFA treatment (150–1400 %), while the increase of DHA metabolites was moderate (30–130 %). The largest increase was observed for the EPA-derived hydroxy FA 5-HEPE (~380 %) and 12-HEPE (~1400 %). In contrast, AA-derived epoxy and dihydroxy FA were significantly reduced after LC n-3 PUFA treatment. The observed alteration of AA-derived hydroxy FA levels was different. While 5-, 8-, 11- and 15-HETE levels were unchanged, 9-HETE was slightly reduced (−15 %). In contrast, 12-HETE was highly elevated (~180 %). As discussed previously [26], the major portion of 12-HETE and 12-HEPE are probably formed during serum preparation by platelet 12-LOX activation as part of blood coagulation. The pattern of LA and ALA metabolites after LC n-3 PUFA supplementation was similar. LA- and ALA-derived epoxy FAs levels were significantly reduced (30–40 %), while dihydroxy FA levels were slightly elevated (10–30 %) or rather unchanged. No differences in oxylipin patterns could be observed between NG and HG in response to LC n-3 PUFA supplementation (Table 2). Only a few oxylipins (8-, 9-, 12-HETE, 12-, 15-HEPE) showed significant higher concentrations in the NG compared to the HG after LC n-3 PUFA treatment. Noticeable, the reduction of AA-derived epoxy FA and dihydroxy FA was more pronounced in HG compared to NG, although no significant differences between the two groups were observed.
In order to compare the inter-individual differences in response to the LC n-3 PUFA treatment, the changes in the oxylipin concentration are shown individually for each compound and subject in Figure S1. Dihydroxy FAs of both EPA and DHA metabolites (Figure S1B & C) increased in all subjects, whereas the change in epoxy FA levels is different from person to person. In several subjects epoxy FA concentrations rose after LC n-3 PUFA treatment, while others showed steady or decreasing concentrations. A similar inconsistency in the trends was found for AA metabolites (Figure S1D). The individual variation of different oxylipins was also compared between NG and HG and no specific pattern was observed (data not shown).
The increase of both EPA- and DHA-derived dihydroxy FAs was considerably stronger compared to epoxy FAs, except for 14(15)-EpETE (Table 2). This finding is also reflected by decreasing epoxy FA: dihydroxy FA ratios following LC n-3 PUFA supplementation (Table 3). Similar to EPA and DHA metabolites, the ratios of all LA-, AA- and ALA-derived epoxy FA: dihydroxy FA were slightly reduced after LC n-3 PUFA treatment. Significant differences compared to ratios at baseline were observed in the HG with one exception (ratio of 14(15)-EpETE: 14,15-DiHETE). Nevertheless, no significant differences in epoxy FA: dihydroxy FA ratios were observed between NG and HG before and after LC n-3 PUFA treatment.
Table 3.
Comparison of epoxy FA: dihydroxy FA ratios in normo- and hyperlipidemic groups before and after 12 weeks of LC n-3 PUFA treatment. All results are shown as the mean ± SE. Significant differences between the two time points were determined by dependent sample t-test. No significant differences were observed between normo- and hyperlipidemic groups using independent sample t-test.
| Parent FA | Epoxy FA:dihydroxy FA | Total study population (n=20) | Normolipidemic group (n=10) | Hyperlipidemic group (n=10) | ||||
|---|---|---|---|---|---|---|---|---|
| mean ± SE | P (t0 vs. t12) | mean ± SE | P (t0 vs. t12) | mean ± SE | P (t0 vs. t12) | |||
|
LA C18:2 n-6 |
9(10)-EpOME: 9,10-DiHOME | t0 | 2.4 ± 0.6 | 2.7 ± 0.9 | 2.1 ± 0.7 | |||
| t12 | 1.1 ± 0.3 | 0.031 | 1.3 ± 0.5 | 1.0 ± 0.4 | 0.014 | |||
|
| ||||||||
| 12(13)-EpOME: 12,13-DiHOME | t0 | 1.3 ± 0.2 | 1.2 ± 0.3 | 1.4 ± 0.3 | ||||
| t12 | 0.7 ± 0.2 | 0.013 | 0.6 ± 0.2 | 0.8 ± 0.3 | 0.012 | |||
|
| ||||||||
|
AA C20:4 n-6 |
8(9)-EpETrE: 8,9-DiHETrE | t0 | 2.0 ± 0.3 | 2.5 ± 2.7 | 1.6 ± 1.4 | |||
| t12 | 1.4 ± 0.3 | 1.9 ± 3.2 | 0.9 ± 1.4 | 0.015 | ||||
|
| ||||||||
| 11(12)-EpETrE: 11,12-DiHETrE | t0 | 2.4 ± 0.4 | 2.6 ± 0.5 | 2.3 ± 0.4 | ||||
| t12 | 1.4 ± 0.3 | 0.011 | 1.7 ± 0.5 | 1.1 ± 0.2 | 0.005 | |||
|
| ||||||||
| 14(15)-EpETrE: 14,15-DiHETrE | t0 | 1.7 ± 0.2 | 2.0 ± 0.5 | 1.5 ± 0.5 | ||||
| t12 | 1.0 ± 0.2 | 0.014 | 1.3 ± 0.4 | 0.8 ± 0.3 | 0.006 | |||
|
| ||||||||
|
ALA C18:3 n-3 |
9(10)-EpODE: 9,10-DiHODE | t0 | 11.8 ± 2.5 | 11.5 ± 0.4 | 12.2 ± 0.3 | |||
| t12 | 5.2 ± 1.8 | 0.01 | 4.3 ± 0.4 | 6.2 ± 0.3 | 0.01 | |||
|
| ||||||||
| 12(13)-EpODE: 12,13-DiHODE | t0 | 4.2 ± 0.8 | 3.7 ± 3.8 | 4.8 ± 3.3 | ||||
| t12 | 1.9 ± 0.5 | 0.005 | 1.9 ± 1.9 | 1.8 ± 3.1 | 0.008 | |||
|
| ||||||||
| 15(16)-EpODE: 15,16-DiHODE | t0 | 0.4 ± 0.0 | 0.4 ± 0.9 | 0.4 ± 1.2 | ||||
| t12 | 0.3 ± 0.0 | 0.012 | 0.3 ± 0.9 | 0.3 ± 0.7 | 0.027 | |||
|
| ||||||||
|
EPA C20:4 n-3 |
11(12)-EpETE: 11,12-DiHETE | t0 | 3.7 ± 0.6 | 4.0 ± 0.1 | 3.3 ± 0.1 | |||
| t12 | 2.1 ± 0.5 | 0.018 | 2.6 ± 0.1 | 1.6 ± 0.1 | <0.001 | |||
|
| ||||||||
| 14(15)-EpETE: 14,15-DiHETE | t0 | 2.6 ± 0.5 | 2.8 ± 1.0 | 2.3 ± 0.9 | ||||
| t12 | 1.9 ± 0.4 | 2.2 ± 0.8 | 1.6 ± 0.7 | |||||
|
| ||||||||
| 17(18)-EpETE: 17,18-DiHETE | t0 | 0.6 ± 0.1 | 0.7 ± 0.6 | 0.6 ± 0.7 | ||||
| t12 | 0.4 ± 0.1 | 0.5 ± 0.7 | 0.3 ± 0.6 | 0.01 | ||||
|
| ||||||||
|
DHA C22:6 n-3 |
10(11)-EpDPE: 10,11-DiHDPE | t0 | 4.9 ± 0.8 | 6.0 ± 0.1 | 3.7 ± 0.1 | |||
| t12 | 2.6 ± 0.6 | 0.005 | 3.1 ± 0.1 | 2.1 ± 0.1 | 0.006 | |||
|
| ||||||||
| 13(14)-EpDPE: 13,14-DiHDPE | t0 | 2.5 ± 0.4 | 2.9 ± 1.3 | 2.1 ± 1.0 | ||||
| t12 | 1.3 ± 0.3 | 0.004 | 1.7 ± 0.9 | 0.9 ± 0.7 | 0.009 | |||
|
| ||||||||
| 16(17)-EpDPE: 16,17-DiHDPE | t0 | 1.9 ± 0.3 | 2.3 ± 0.6 | 1.5 ± 0.5 | ||||
| t12 | 1.1 ± 0.3 | 0.007 | 1.4 ± 0.5 | 0.7 ± 0.3 | 0.006 | |||
|
| ||||||||
| 19(20)-EpDPE: 19,20-DiHDPE | t0 | 0.5 ± 0.1 | 0.5 ± 0.5 | 0.4 ± 0.3 | ||||
| t12 | 0.3 ± 0.1 | 0.029 | 0.4 ± 0.4 | 0.2 ± 0.3 | 0.013 | |||
All variables were normally distributed.
Correlation between relative change in EPA oxylipins and EPA levels in erythrocyte membranes
The EPA-derived oxylipins show a close dependency on their precursor FA following the intervention. For nearly all EPA-eicosanoids, a significant correlation in the relative change between EPA-metabolite levels in serum and EPA levels in erythrocyte membranes was observed (Figure 2). With minor differences, the same correlations and trends were observed in the NG and HG (data not shown). The DHA-derived oxylipins 13,14-DiHDPE, 16,17-DiHDPE, and 19,20-DiHDPE also increased with the DHA status, however, no significant correlation in the relative change following treatment was observed.
Figure 2.

Correlation between the relative change of EPA (C20:5 n-3) in erythrocyte membranes and serum oxylipins derived from EPA after 12 weeks of LC n-3 PUFA treatment. A) Only FA/oxylipin pairs are presented, where a significant correlation (correlation coefficient ≥ 0.5 and p ≤0.05) could be observed. Correlation between relative change of EPA in erythrocyte membranes and increase of EPA-derived epoxy (B) and dihydroxy (C) fatty acids levels in serum. Analyses were carried out in the total study population (n=20).
With lower baseline EPA status the increase of EPA in erythrocyte membranes after LC n-3 PUFA supplementation was higher (Figure 3A). By separating the total study population in two groups with low EPA baseline status (<0.7 % of total FA) and high EPA baseline status (> 1 % of total FA) it can be ascertained that the increase of EPA metabolites is stronger with lower baseline EPA status compared to higher EPA status, being significant for 5-HEPE, 14,15- and 17,18-DiHETE (Figure 3B).
Figure 3.
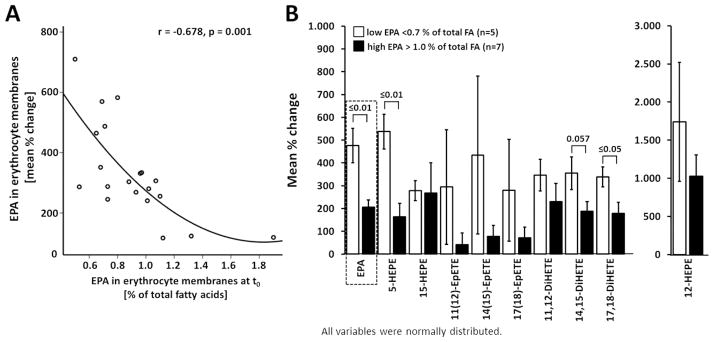
Dependence of EPA-derived eicosanoid levels in serum after 12 weeks of LC n-3 PUFA treatment dependent on EPA status. A) The increase of EPA uptake into erythrocyte membranes was considerably stronger with lower baseline EPA levels. Analyses were carried out in the total study population (n=20). B) Increase of EPA-derived eicosanoid levels in serum after 12 weeks of LC n-3 PUFA treatment dependent on initial baseline EPA status. EPA-derived oxylipin levels were compared in tertiles of the whole study population with low and high EPA percentage in erythrocyte membranes. All results are shown as the mean ± SE. Significant differences were determined by independent sample t-test for normal distributed variables.
DISCUSSION
In a recent publication, we showed that serum levels of several hydroxy, epoxy, and dihydroxy FA are dependent on the individual status of the parent FAs in a cohort of 20 normo- and 20 hyperlipidemic subjects [26]. In particular, a strong correlation between relative EPA levels in erythrocyte membranes and serum concentrations of EPA metabolites was observed. Assuming that the endogenous conversion of ALA to EPA and further to DHA is negligible low [29–31], these results suggest that increasing EPA and DHA levels in erythrocyte membranes as a consequence of dietary EPA and DHA intake would directly result in increased EPA- and DHA-derived oxylipin levels in blood. However, the effect of increasing the dietary LC n-3 PUFA intake on hydroxy, epoxy, and dihydroxy FA levels has not been investigated in normo- vs. hyperlipidemic subjects in a controlled intervention study. In order to examine the influence of LC n-3 PUFA intake on oxylipin levels, we extended our earlier study and 10 normo- and 10 hyperlipidemic subjects of the same cohort were randomly selected for a twelve week supplementation study with LC n-3 PUFAs. More precisely, in the present study we examined the relationship between LC n-3 PUFA induced changes in the parent FA status and corresponding oxylipin levels in serum to elucidate if resulting oxylipin patterns differ between normo- and hyperlipidemic subjects or depend on the individual parent FA status. Therefore, relative levels of LA, AA, ALA, EPA and DHA in erythrocyte membranes as well as levels of 44 free non-esterified hydroxy, epoxy, and dihydroxy FA in serum were analyzed after twelve weeks of LC n-3 PUFA supplementation.
Compared to studies that monitored the effects of LC n-3 PUFA supplementation on endogenous oxylipin profiles in healthy subjects [21,24], we similarly observed increased n-3 oxylipin and decreased n-6 oxylipin levels. Although, our study differed in several aspects from the two other studies (Shearer et al. and Keenan et al. measured plasma levels of esterified oxylipins in healthy subjects before and after four weeks supplementation with prescription n-3 PUFAs as ethyl-esters in concentrations of 4 g/day), the relative alterations were remarkably similar. While absolute levels for most free oxylipins in serum were considerably lower compared to esterified oxylipin levels in plasma [21,24], already discussed in [26], the relative change of oxylipin concentrations after LC n-3 PUFA treatment were similar between the studies. For example, EpETEs were increased by factor 2.5–3.9 in our study compared to 4.7 in the study of Shearer et al., while vicinal DiHETEs were increased by factor 3.4–4.1 vs. 4.1, respectively. Similar trends and fold changes were obvious for several EpDPEs, DiHDPEs or 5-HEPE, but also reductions for DiHETrEs.
Inter-individual differences
The comparison of oxylipin patterns between normo- and hyperlipidemic subjects unveiled no apparent differences after LC n-3 PUFA supplementation (Table 2, 3). Although the levels of individual oxylipins differed significantly after LC n-3 PUFA ingestion, the trends of hydroxy, epoxy and dihydroxy FA are similar, suggesting that no biological relevant differences are likely between normo- and hyperlipidemic subjects. This result is in accordance with our previous finding that subjects with mild hyperlipidemia do not simultaneously exhibit disturbed oxylipin levels [26]. However, in this study we also observed strong inter-individual variations in oxylipin patterns in response to LC n-3 PUFA supplementation. Although the trends of relative parent PUFA levels in erythrocyte membranes were similar in nearly all subjects (increase of EPA and DHA, decrease of AA; Figure S1A), the trends in serum oxylipin levels were dissimilar from person to person (Figure S1B–D). The reasons for the inter-individual variability in oxylipins levels and their response to LC n-3 PUFA treatment, despite uniform trends for parent FAs in membranes, remain unclear and warrant further investigation.
Modulation of epoxy FA: dihydroxy FA ratios
As surprising finding of the study were the observed changes in the epoxy FA: dihydroxy FA ratios of all LC PUFAs in response to LC n-3 PUFA treatment. The underlying mechanisms remain unknown. In pharmacological studies a changed epoxy FA: dihydroxy FA ratio of free oxylipins in blood is used as simplistic marker for systemic sEH activity [19,32]. However, it seems unlikely that the observed changes are caused by a modulation of the activity of sEH. There is no evidence that sEH levels in human tissues are inducible by LC n-3 PUFA. Possibly, the changes in the epoxy FA: dihydroxy FA ratios of DHA and EPA metabolites are caused by a higher incorporation of n-3 epoxides into lipids compared to the corresponding n-3 diols. The mechanisms of the esterification of oxylipins in general and in response to LC n-3 PUFA treatment warrants further investigation. This should include the parallel determination of free and unbound oxylipins in blood as well as quantification urinary oxylipins. Current research carried out at the Leibniz University Hannover in collaboration with the University of Veterinary Medicine Hannover aims to address these questions.
Modulation of CYP metabolites by LC n-3 PUFAs
Increased EPA/DHA and decreased AA levels in erythrocyte membranes suggest a displacement of AA by EPA and DHA. Likewise, serum levels of several EPA- and DHA-derived oxylipins and the corresponding AA metabolites were significantly changed. Especially the patterns of CYP-eicosanoids showed that AA-derived epoxides and vicinal diols were partially replaced by EPA- and DHA-derived epoxides and diols. Concentrations of the AA metabolites 8(9)-EpETrE, 11(12)-EpETrE and 14(15)-EpETrE were decreased by half to levels of 310 to 640 nM. In contrast, concentrations of the EPA metabolites 11(12)-EpETE, 14(15)-EpETE and 17(18)-EpETE were doubled to similar ranges (320 to 620 nM). Likewise, DHA-derived epoxy metabolite levels were increased. Although the increase was not significant, the final EpDPE levels (470–1,200 pM) were dominant among all AA-, EPA- and DHA-epoxy FA levels after LC n-3 PUFA supplementation.
The ratio between CYP-dependent LC n-3 PUFA metabolites with AA metabolites shows a linear correlation to the ratio of their parent FA ratio prior and after intervention (Figure 4). The slope of 3–5 for EPA and 4–7 for DHA indicates a preference of the CYP enzymes for the LC n-3 PUFA as substrate. Comparing the conversion rates of PUFA converting CYP isoforms described by Fer et al., only CYP2J2 shows such a strong substrate preference for DHA and EPA [18]. Thus, it can be assumed that a significant portion of the free epoxy and dihydroxy FA in blood have been formed by CYP2J2, e.g. in the endothelia and kidney, substantiating the well-established importance of this CYP isoenzyme in the formation of human oxylipins [2,15]. Recent studies have shown that EPA- and DHA-derived CYP epoxides 17(18)-EpETE and 19(20)-EpDPE possess highly potent anti-arrhythmic [16], vasodilatory [33] and anti-thrombotic effects [34]. Taken together, our findings of the strong elevation of the CYP-dependent LC n-3 PUFA metabolites, therefore, suggest that part of the cardio-protective effects of LC n-3 PUFA [16] might be mediated by the strong formation of highly active EPA- and DHA-epoxy oxylipins.
Figure 4.

Correlation between the ratio of EPA/AA and DHA/AA in erythrocyte membranes with the ratio of the concentration of their CYP products (sum of all epoxy and dihydroxy FA) in serum quantified (Table 1). The correlation was carried out independently before (t0, filled circles) and after LC n-3 PUFA supplementation (t12, open triangles). For all subjects at all time points the ratio of the CYP products is higher than that of its substrates indicating a preference of the converting enzymes for the LC n-3 PUFA over AA.
Influence of initial EPA status on EPA-oxylipin modulation
The increase of EPA-metabolite levels in serum is highly correlated with the increase of relative EPA levels in erythrocyte membranes (Figure 2) while the relative increase of EPA depends on the individual EPA status (Figure 3A). Consequently the increase of EPA epoxy and dihydroxy FA levels caused by LC n-3 PUFA supplementation is depending on the initial EPA status. The effect on these oxylipin levels in subjects with a low EPA levels at baseline is much stronger than in subjects with a high baseline EPA status (Figure 3B). Thus, our assumption that the diet directly influences EPA-oxylipin levels is confirmed.
Limitation of the study
With the 47 hydroxy, epoxy and dihydroxy FA analyzed in the study, the utilized analytical method covered – as all targeted metabolomics approaches – only a selection of the possibly formed oxylipins. With respect to the observed modulation of n-3 hydroxy FA, it should be noted that our study did not cover any hydroxy-DHA metabolites which have been detected in human plasma samples [22]. Moreover, several hydroxy-EPA metabolites, such as 18-HEPE – a pathway marker for the formation of the e-resolvins [35] – were not quantified this study. Significant changes in these metabolites might also occur in response to LC n-3 PUFA treatment.
Conclusion
Our results demonstrate that LC n-3 PUFA supplementation directly modulates free oxylipins in serum with increased EPA- and DHA-derived metabolite levels. Hence, the dietary LC PUFA composition has a direct influence on the oxylipin profile. We found no relevant differences between normo- and hyperlipidemic subjects in the response to LC n-3 PUFA intake. However, our data clearly show that the initial LC PUFA status is highly predictive for the expected variation of oxylipin levels. Especially the increase of EPA metabolites along the CYP/sEH pathway is highly correlated with the increase of relative EPA levels in erythrocyte membranes. Considering the high biological activity on LC n-3 PUFA epoxides on the cardiovascular system, it can be assumed that at least part of the well-established cardio-protective action of LC n-3 PUFA are mediated by these oxylipins.
Supplementary Material
Acknowledgments
This study was supported by a Grant of the German Federal Ministry of Education and Research (BMBF) to AH, a Marie Curie Career Integration Grant to NHS, a Kekulé Ph.D. fellowship of the Fonds der Chemischen Industry to IW and a grants from US National Institutes of Health (NIH), Enviromental Health (NIEHS, P42 ES004699 and R01 ES002710) and Diabetes and Digestive and Kidney Diseases (NIDDK, U24 DK097154) and the West Coast Central Comprehensive Metabolomics Resource Core (WC3MRC) to BDH. BDH is a George and Judy Marcus Senior Fellow of the American Asthma Association. The provision of the fish oil supplement by Dr. Loges + Co. GmbH (Winsen, Germany) is kindly acknowledged. The authors are solely responsible for the design and conduct of the study, collection, management, analysis, and interpretation of the data, as well as preparation of the manuscript. We would like to thank the participants of the study who contributed their time to this project.
References
- 1.Jump DB, Depner CM, Tripathy S. Omega-3 fatty acid supplementation and cardiovascular disease. J Lipid Res. 2012;53:2525–2545. doi: 10.1194/jlr.R027904. [DOI] [PMC free article] [PubMed] [Google Scholar]
- 2.Arnold C, Konkel A, Fischer R, Schunck WH. Cytochrome P450-dependent metabolism of omega-6 and omega-3 long-chain polyunsaturated fatty acids. Pharmacol Rep. 2010;62:536–547. doi: 10.1016/s1734-1140(10)70311-x. [DOI] [PubMed] [Google Scholar]
- 3.Buczynski MW, Dumlao DS, Dennis EA. Thematic Review Series: Proteomics. An integrated omics analysis of eicosanoid biology. J Lipid Res. 2009;50:1015–1038. doi: 10.1194/jlr.R900004-JLR200. [DOI] [PMC free article] [PubMed] [Google Scholar]
- 4.Bylund J, Kunz T, Valmsen K, Oliw EH. Cytochromes P450 with bisallylic hydroxylation activity on arachidonic and linoleic acids studied with human recombinant enzymes and with human and rat liver microsomes. J Pharmacol Exp Ther. 1998;284:51–60. [PubMed] [Google Scholar]
- 5.Kroetz DL, Zeldin DC. Cytochrome P450 pathways of arachidonic acid metabolism. Curr Opin Lipidol. 2002;13:273–283. doi: 10.1097/00041433-200206000-00007. [DOI] [PubMed] [Google Scholar]
- 6.Morisseau C, Inceoglu B, Schmelzer K, Tsai HJ, Jinks SL, Hegedus CM, Hammock BD. Naturally occurring monoepoxides of eicosapentaenoic acid and docosahexaenoic acid are bioactive antihyperalgesic lipids. J Lipid Res. 2010;51:3481–3490. doi: 10.1194/jlr.M006007. [DOI] [PMC free article] [PubMed] [Google Scholar]
- 7.Morisseau C, Hammock BD. Epoxide hydrolases: mechanisms, inhibitor designs, and biological roles. Annu Rev Pharmacol Toxicol. 2005;45:311–333. doi: 10.1146/annurev.pharmtox.45.120403.095920. [DOI] [PubMed] [Google Scholar]
- 8.Morisseau C, Hammock BD. Impact of soluble epoxide hydrolase and epoxyeicosanoids on human health. Annu Rev Pharmacol Toxicol. 2013;53:37–58. doi: 10.1146/annurev-pharmtox-011112-140244. [DOI] [PMC free article] [PubMed] [Google Scholar]
- 9.Mozaffarian D, Wu JHY. Omega-3 fatty acids and cardiovascular disease: effects on risk factors, molecular pathways, and clinical events. J Am Coll Cardiol. 2011;58:2047–2067. doi: 10.1016/j.jacc.2011.06.063. [DOI] [PubMed] [Google Scholar]
- 10.Vidgren HM, Agren JJ, Schwab U, Rissanen T, Hänninen O, Uusitupa MI. Incorporation of n-3 fatty acids into plasma lipid fractions, and erythrocyte membranes and platelets during dietary supplementation with fish, fish oil, and docosahexaenoic acid-rich oil among healthy young men. Lipids. 1997;32:697–705. doi: 10.1007/s11745-997-0089-x. [DOI] [PubMed] [Google Scholar]
- 11.Cao J, Schwichtenberg KA, Hanson NQ, Tsai MY. Incorporation and clearance of omega-3 fatty acids in erythrocyte membranes and plasma phospholipids. Clin Chem. 2006;52:2265–2272. doi: 10.1373/clinchem.2006.072322. [DOI] [PubMed] [Google Scholar]
- 12.Neubronner J, Schuchardt JP, Kressel G, Merkel M, von Schacky C, Hahn A. Enhanced increase of omega-3 index in response to long-term n-3 fatty acid supplementation from triacylglycerides versus ethyl esters. Eur J Clin Nutr. 2011;65:247–254. doi: 10.1038/ejcn.2010.239. [DOI] [PubMed] [Google Scholar]
- 13.Harris WS, von Schacky C. The Omega-3 Index: a new risk factor for death from coronary heart disease? Prev Med. 2004;39:212–220. doi: 10.1016/j.ypmed.2004.02.030. [DOI] [PubMed] [Google Scholar]
- 14.Schmitz G, Ecker J. The opposing effects of n-3 and n-6 fatty acids. Prog Lipid Res. 2008;47:147–155. doi: 10.1016/j.plipres.2007.12.004. [DOI] [PubMed] [Google Scholar]
- 15.Arnold C, Markovic M, Blossey K, Wallukat G, Fischer R, Dechend R, Konkel A, von Schacky C, Luft FC, Muller DN, Rothe M, Schunck WH. Arachidonic acid-metabolizing cytochrome P450 enzymes are targets of {omega}-3 fatty acids. J Biol Chem. 2010;285:32720–32733. doi: 10.1074/jbc.M110.118406. [DOI] [PMC free article] [PubMed] [Google Scholar]
- 16.Westphal C, Konkel A, Schunck WH. CYP-eicosanoids--a new link between omega-3 fatty acids and cardiac disease? Prostaglandins Other Lipid Mediat. 2011;96:99–108. doi: 10.1016/j.prostaglandins.2011.09.001. [DOI] [PubMed] [Google Scholar]
- 17.Brash AR. Lipoxygenases: occurrence, functions, catalysis, and acquisition of substrate. J Biol Chem. 1999;274:23679–23682. doi: 10.1074/jbc.274.34.23679. [DOI] [PubMed] [Google Scholar]
- 18.Fer M, Dréano Y, Lucas D, Corcos L, Salaün JP, Berthou F, Amet Y. Metabolism of eicosapentaenoic and docosahexaenoic acids by recombinant human cytochromes P450. Arch Biochem Biophys. 2008;471:116–125. doi: 10.1016/j.abb.2008.01.002. [DOI] [PubMed] [Google Scholar]
- 19.Inceoglu B, Wagner KM, Yang J, Bettaieb A, Schebb NH, Hwang SH, Morisseau C, Haj FG, Hammock BD. Acute augmentation of epoxygenated fatty acid levels rapidly reduces pain-related behavior in a rat model of type I diabetes. Proc Natl Acad Sci USA. 2012;109:11390–11395. doi: 10.1073/pnas.1208708109. [DOI] [PMC free article] [PubMed] [Google Scholar]
- 20.Zhang G, Panigrahy D, Mahakian LM, Yang J, Liu J-Y, Stephen Lee KS, Wettersten HI, Ulu A, Hu X, Tam S, Hwang SH, Ingham ES, Kieran MW, Weiss RH, Ferrara KW, Hammock BD. Epoxy metabolites of docosahexaenoic acid (DHA) inhibit angiogenesis, tumor growth, and metastasis. Proc Natl Acad Sci USA. 2013;110:6530–6535. doi: 10.1073/pnas.1304321110. [DOI] [PMC free article] [PubMed] [Google Scholar]
- 21.Shearer GC, Harris WS, Pedersen TL, Newman JW. Detection of omega-3 oxylipins in human plasma and response to treatment with omega-3 acid ethyl esters. J Lipid Res. 2010;51:2074–2081. doi: 10.1194/jlr.M900193-JLR200. [DOI] [PMC free article] [PubMed] [Google Scholar]
- 22.Gomolka B, Siegert E, Blossey K, Schunck WH, Rothe M, Weylandt KH. Analysis of omega-3 and omega-6 fatty acid-derived lipid metabolite formation in human and mouse blood samples. Prostaglandins Other Lipid Mediat. 2011;94:81–87. doi: 10.1016/j.prostaglandins.2010.12.006. [DOI] [PubMed] [Google Scholar]
- 23.Psychogios N, Hau DD, Peng J, Guo AC, Mandal R, Bouatra S, Sinelnikov I, Krishnamurthy R, Eisner R, Gautam B, Young N, Xia J, Knox C, Dong E, Huang P, Hollander Z, Pedersen TL, Smith SR, Bamforth F, Greiner R, McManus B, Newman JW, Goodfriend T, Wishart DS. The human serum metabolome. PLoS ONE. 2011;6:e16957. doi: 10.1371/journal.pone.0016957. [DOI] [PMC free article] [PubMed] [Google Scholar]
- 24.Keenan AH, Pedersen TL, Fillaus K, Larson MK, Shearer GC, Newman JW. Basal omega-3 fatty acid status affects fatty acid and oxylipin responses to high-dose n3-HUFA in healthy volunteers. J Lipid Res. 2012;53:1662–1669. doi: 10.1194/jlr.P025577. [DOI] [PMC free article] [PubMed] [Google Scholar]
- 25.Strassburg K, Huijbrechts AML, Kortekaas KA, Lindeman JH, Pedersen TL, Dane A, Berger R, Brenkman A, Hankemeier T, van Duynhoven J, Kalkhoven E, Newman JW, Vreeken RJ. Quantitative profiling of oxylipins through comprehensive LC-MS/MS analysis: application in cardiac surgery. Anal Bioanal Chem. 2012;404:1413–1426. doi: 10.1007/s00216-012-6226-x. [DOI] [PMC free article] [PubMed] [Google Scholar]
- 26.Schuchardt JP, Schmidt S, Kressel G, Dong H, Willenberg I, Hammock BD, Hahn A, Schebb NH. Comparison of free serum oxylipin concentrations in hyper- vs. normolipidemic men. Prostaglandins Leukot Essent Fatty Acids. 2013;89:19–29. doi: 10.1016/j.plefa.2013.04.001. [DOI] [PMC free article] [PubMed] [Google Scholar]
- 27.Yang J, Schmelzer K, Georgi K, Hammock BD. Quantitative profiling method for oxylipin metabolome by liquid chromatography electrospray ionization tandem mass spectrometry. Anal Chem. 2009;81:8085–8093. doi: 10.1021/ac901282n. [DOI] [PMC free article] [PubMed] [Google Scholar]
- 28.Schebb NH, Inceoglu B, Ahn KC, Morisseau C, Gee SJ, Hammock BD. Investigation of human exposure to triclocarban after showering and preliminary evaluation of its biological effects. Environ Sci Technol. 2011;45:3109–3115. doi: 10.1021/es103650m. [DOI] [PMC free article] [PubMed] [Google Scholar]
- 29.Burdge GC, Calder PC. Conversion of alpha-linolenic acid to longer-chain polyunsaturated fatty acids in human adults. Reprod Nutr Dev. 2005;45:581–597. doi: 10.1051/rnd:2005047. [DOI] [PubMed] [Google Scholar]
- 30.Brenna JT, Salem N, Sinclair AJ, Cunnane SC. alpha-Linolenic acid supplementation and conversion to n-3 long-chain polyunsaturated fatty acids in humans. Prostaglandins Leukot Essent Fatty Acids. 2009;80:85–91. doi: 10.1016/j.plefa.2009.01.004. [DOI] [PubMed] [Google Scholar]
- 31.Plourde M, Cunnane SC. Extremely limited synthesis of long chain polyunsaturates in adults: implications for their dietary essentiality and use as supplements. Appl Physiol Nutr Metab. 2007;32:619–634. doi: 10.1139/H07-034. [DOI] [PubMed] [Google Scholar]
- 32.Schmelzer KR, Kubala L, Newman JW, Kim IH, Eiserich JP, Hammock BD. Soluble epoxide hydrolase is a therapeutic target for acute inflammation. Proc Natl Acad Sci USA. 2005;102:9772–9777. doi: 10.1073/pnas.0503279102. [DOI] [PMC free article] [PubMed] [Google Scholar]
- 33.Agbor LN, Walsh MT, Boberg JR, Walker MK. Elevated blood pressure in cytochrome P4501A1 knockout mice is associated with reduced vasodilation to omega-3 polyunsaturated fatty acids. Toxicol Appl Pharmacol. 2012;264:351–360. doi: 10.1016/j.taap.2012.09.007. [DOI] [PMC free article] [PubMed] [Google Scholar]
- 34.Jung F, Schulz C, Blaschke F, Muller DN, Mrowietz C, Franke RP, Lendlein A, Schunck WH. Effect of cytochrome P450-dependent epoxyeicosanoids on Ristocetin-induced thrombocyte aggregation. Clin Hemorheol Microcirc. 2012;52:403–416. doi: 10.3233/CH-2012-1614. [DOI] [PubMed] [Google Scholar]
- 35.Weylandt KH, Chiu CY, Gomolka B, Waechter SF, Wiedenmann B. Omega-3 fatty acids and their lipid mediators: towards an understanding of resolvin and protectin formation. Prostaglandins Other Lipid Mediat. 2012;97:73–82. doi: 10.1016/j.prostaglandins.2012.01.005. [DOI] [PubMed] [Google Scholar]
Associated Data
This section collects any data citations, data availability statements, or supplementary materials included in this article.