Abstract
MicroRNAs (miRNAs) dysregulation is critically involved in lung cancer. Regulating miRNAs by natural agents may be a new strategy for cancer treatment. We previously found that a novel small-molecule compound diaporine A (D261), a natural product of endophytic fungus 3lp-10, had potential anti-cancer activites. In the present study, the inhibitory effect of D261 on non-small cell lung cancer (NSCLC) growth and its possible mechanisms involving miRNA regulation were investigated. By cell viability assay, cell proliferation analysis, and clonal growth assay, we proved that D261 effectively inhibited the proliferation of NSCLC cells (NCI-H460 and A549) in vitro. Administration of D261 (5 mg/kg) to NCI-H460 xenografts bearing mice also inhibited tumor growth and decreased the expression of cell proliferation regulator, midkine. Moreover, D261 induced cell cycle arrest with a reduced expression of various G1/S transition-related molecules including cyclin D1, cyclin E1, CDK4, and CDK2, but without influencing apoptosis in NSCLC cells. Intriguingly, D261 modified expressions of some miRNAs and especially upregulated miR-99a, whose direct target was mammalian target of rapamycin (mTOR). Furthermore, overexpression of miR-99a antagonized the anti-tumor actions of D261 including the suppression of mTOR pathway activation, cell cycle-related proteins and cell growth. In addition, blocking of miR-99a expression by transfection of miR-99a inhibitors before D261 treatment counteracted the anti-tumor effects of D261. These data suggest that miR-99a/mTOR pathway was involved in D261-induced tumor suppression in NSCLC cells. D261 might be a potent anti-cancer agent by upregulating miR-99a expression.
Keywords: diaporine A, natural agent, NSCLC, cell cycle, G1/S transition, miR-99a, mTOR
Introduction
Lung cancer is the leading cause of cancer-related deaths globally, and its overall 5-y survival rate is approximately 15%. Non-small cell lung cancer (NSCLC) is the most common type, observed in approximately 85% of lung cancers, making it a major global public health concern.1 Of note, microRNAs (miRNAs) have been proved to be correlated with various human cancers and function as oncogenes or tumor suppressors.2,3 Growing evidence indicates that miRNAs could control cancer initiation and progression by regulating multiple cellular processes, including cell differentiation, cell cycle, apoptosis, and metastasis.4-7 Indeed, miRNA dysregulation is critically involved in lung cancer. For instance, miR-15a, miR-16, and miR-34a are frequently deleted or downregulated in NSCLC,8,9 and these miRNAs control cell cycle progression by inducing cell cycle arrest in G0/G1.10 The miR-195 also functions as tumor suppressor in NSCLC, and the miR-195/MYB axis is a potential therapeutic target for NSCLC intervention.11 In addition, miR-99a is downregulated in various human lung cancer cells/tissues, which associated with mTOR/FGFR3 pathway that is crucial for controlling tumor growth.12 In contrast, miR-21 is overexpressed in human squamous cell lung carcinoma and associated with poor patient prognosis.13 These studies suggest that the deregulated miRNAs could be potential therapeutic targets for lung cancer.
Natural agents have shown a wide variety of anti-tumor effects by different apoptosis inducing mechanisms. Importantly, several natural agents were found to inhibit cancer progression by regulating expressions of miRNAs.14-16 For example, curcumin, derived from turmeric, was reported to induce human pancreatic cell apoptosis partly by upregulation of miR-22 and downregulation of miR-199a.17 Epigallocatechin gallate (EGCG), a major type of green tea polyphenols, upregulated miR-16 expression and mediated apoptosis in HepG2 cells.18 Additionally, resveratrol was convinced to reduce prostate cancer growth and metastasis by inhibiting the Akt/miR-21 pathway.19 All these support that regulating miRNA by natural compounds should be a new strategy for cancer treatment.
Metabolites of endophytes support a rich resource for discovering novel lead compounds for treating human diseases. Since 2009, we have screened hundreds of newly identified endophyte-derived products, and excitingly found some functional biomolecules with the activities of immunomodulation,20-22 anti-inflammation,23,24 or anti-cancer. Recently, we identified a novel fungal metabolic product diaporine A (D261) from the culture broth of endophytic fungus Diaporthe sp. 3lp-10, which is characterized by a semiquinone tetragonal structure with epoxide rings (structure was shown in Fig. 1). To our knowledge, only two analogs, floccosin and xanthoepocin, were reported since 1980s.25-27 They were confirmed to have inhibitory effect on mitochondrial reactions or antibiotic activity and with no genotoxicity. To our surprise, D261 displayed a potent anti-cancer effect by regulating miR-99a. In the present study, we found that D261 efficiently inhibited the viability, proliferation, and colony forming of NSCLC cell lines in a concentration- and time-dependent manner. D261 caused cell cycle arrest at the G1 phase and downregulated the expression of CCND1, CCNE1, CDK4, and CDK2. Moreover, D261 also suppressed the growth of cancer in vivo. Interestingly, D261 upregulated the expression of miR-99a, which was downregulated in various human lung cancer cells/tissues. Furthermore, miR-99a/mTOR axis was involved in D261-induced cell cycle arrest. Therefore, our findings demonstrate that D261 could be a novel lead compound for NSCLC treatment, whose activity could be explained, at least in part, through regulating miR-99a/mTOR signaling pathway.
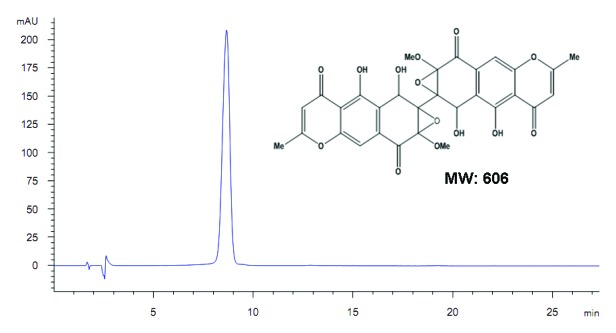
Figure 1. Chemical structure of diaporine A (D261, molecular weight = 606). The purity was confirmed to be >98% by HPLC.
Results
D261 inhibits NSCLC cell growth in vitro
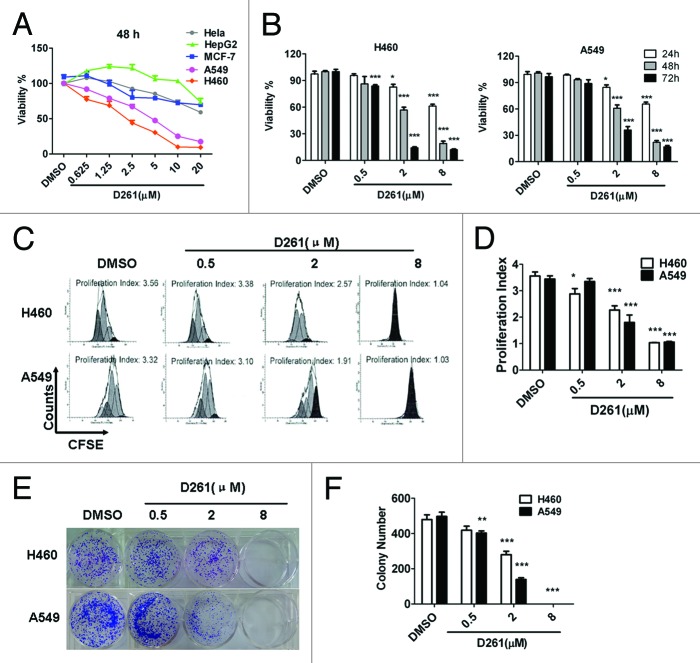
The anti-tumor activities of D261 were determined on some human tumor cell lines from a diverse set of target organs, including cervix (HeLa), liver (HepG2), lung (A549 and NCI-H460), and breast (MCF-7) cancer cell lines. The cells were treated with D261 (0.625~20 μM) for 48 h and their viabilities were tested using the CCK-8 assay. As shown in Figure 2A, D261 showed different cytotoxicity on different cells. Among these five tested cell lines, NCI-H460 (IC50 values, 2.087 μM) and A549 (IC50 values, 4.514 μM) exhibited more sensitivity to D261 than other cells (IC50 values, > 20 μM). These results suggested that D261 had promising antitumor activity against NSCLC. So we chose human NSCLC cells for further study.
Figure 2. Growth inhibition of human NSCLC cells NCI-H460 and A549 induced by D261. (A and B) Cancer cells were treated with increasing concentrations of D261 for the indicated times. Cell viabilities were evaluated by the CCK-8 assay and denoted as a percentage of vehicle control at the concurrent time point. The bars indicate mean ± SEM (n = 5). (C and D) Cells were stained with CFSE, treated with D261 for 72 h and detected by FACS. Proliferation index was analyzed by modfit software. (E and F) Cells were treated with increasing concentrations of D261 for 24 h and allowed to grow at very low cell density. Colonies were photographed by light microscopy 7 d later and counted as shown. Data are shown as mean ± SEM (n = 3) of one representative experiment. Similar results were obtained in at least three independent experiments. *P < 0.05, **P < 0.01, ***P < 0.001, compared with DMSO control.
Subsequently, we found that D261 had dose- and time-dependent inhibitory effects on both NCI-H460 and A549 cells in the concentration of 0.5, 2, and 8 μM for 24, 48, and 72 h of exposure by cell viability assay (Fig. 2B). The maximum inhibition rate with use of 8 μM for 72 h exposure was 89.2% (NCI-H460) and 84.9% (A549), respectively.
To confirm the anti-proliferative activity of D261 on NSCLC cells, we performed cell proliferation analysis using CFSE staining and analyzed the proliferation index of each group. Results showed that D261 decreased the generations and the proliferation index of cells in a dose-dependent manner (Fig. 2C and D).
We further investigated the effect of D261 on clonogenicity of NCI-H460 and A549 cells. Compared with DMSO-treated control cells, D261-treated cells displayed notably fewer clonies, and the cells incubated with 8 μM of D261 even could not form any clonies (Fig. 2E and F).
D261 suppresses growth of NCI-H460 xenografts in vivo
In order to prove whether D261 had an inhibitory effect on NSCLC in vivo, we employed a NCI-H460 xenografts nude mouse model. Body weight (Fig. 3A) and tumor volume (Fig. 3B) was measured every 3 d, and tumor weights were determined at autopsy (Fig. 3C). D261 (5 mg/kg) did not alter the body weight but markedly suppressed the growth and weights of NCI-H460 tumors. As shown in Figure 3B, the mean volume of NCI-H460 tumors at day 21 in the mice who received D261 (3971 ± 609.6 mm3) was significantly decreased compared with control mice (1792 ± 185.4 mm3) (P < 0.05). In addition, the difference of mean tumor weights between these two groups (1.859 ± 0.147 g D261-treated, 1.340 ± 0.086 g control diluent DMSO) was significant (P < 0.05) (Fig. 3B). No mouse showed signs of wasting or other signs of organ toxicity (data not shown).
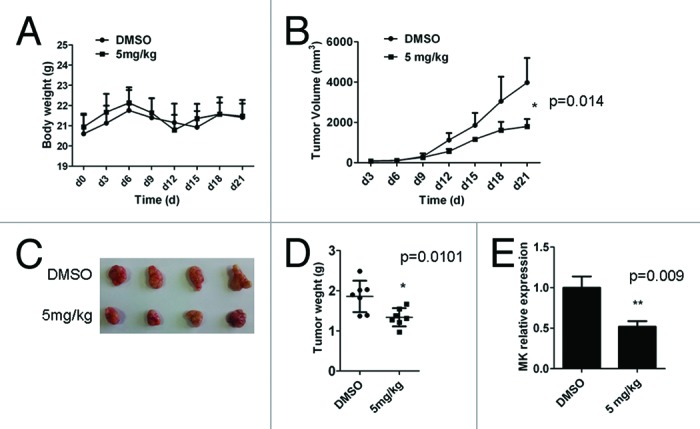
Figure 3. D261 suppresses NSCLC growth in vivo. Female BALB/c nude mice with NCI-H460 xenografts were injected intravenously with D261 or DMSO daily for 3 wk. Body weight of mice (A) and tumor volume (B) were recorded every 3 d. (C and D) Tumor measurement was made after mice were sacrificed. (E) Midkine (MK) expression of the tumor tissue was determined by qRT-PCR. Data are shown as mean ± SEM (n = 7). *P < 0.05, **P < 0.01, compared with DMSO control.
Midkine (MK), a heparin-binding growth factor, is overexpressed in a wide range of human carcinomas including NSCLC.28 It is a promising prognostic/diagnostic marker of cancer,29 and its blockade is found to contribute to tumor cell proliferation.30,31 Thus we explored the effect of D261 on MK expression, as assessing its anti-proliferation activity in vivo. After three weeks of therapy with or without D261, tumors were removed from nude mice and the mRNA level of MK was assessed by qRT-PCR assay. As shown in Figure 3E, MK was significantly reduced in tumors from mice who received D261. MK was also decreased in D261 treated NCI-H460 and A549 cells both in the RNA and protein levels (Fig. S1).
Taken together, we identified D261 as a potential suppressor of NSCLC both in vitro and in vivo.
D261 induces cell cycle arrest without influencing apoptosis
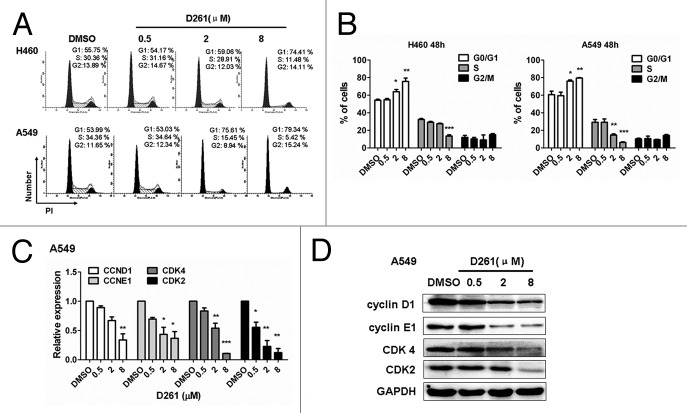
To reveal mechanisms underlying the growth inhibitory effect of D261, subsequent investigations on apoptosis and cell cycle progression were performed. NCI-H460 or A549 cells were seeded into 12-well plates and incubated with different concentrations (0.5, 2, and 8 μM) of D261 for 48 h. To our surprise, D261 almost had no influence on apoptosis in these cells. Even up to 8 μM, D261 induced only 5.21 ± 0.49% and 5.17 ± 0.29% of the NCI-H460 and A549 cells to become apoptotic, respectively (Fig. S2). However, D261 caused evident cell cycle arrest at G phase. As shown in Figure 4A and B, proportions of S phase were decreased, while G1 populations were marked accumulated with D261 treatment in these cells. To further confirm the effect of D261 on cell cycle, we detected the expressions of several G1/S transition-related molecules, and found that both RNA levels and protein levels of cyclin D1, cyclin E1, CDK4 and CDK2 were attenuated by D261 in a dose-dependent manner (Fig. 4C-D). Therefore, we concluded that D261 repressed NSCLC growth through blocking G1/S transition.
Figure 4. D261 arrests NSCLC cell cycle progression. (A and B) NCI-H460 or A549 cells were treated with various concentrations of D261 for 48 h. Cell cycle was determined by FACS and analyzed by modfit software. (C–E) Effects of D261 on G1/S transition-related molecules were determined by qRT-PCR (C) and western blot (D). Images were representative of three independent experiments. Data are shown as mean ± SEM (n = 3) of one representative experiment. Similar results were obtained in at least three independent experiments. *P < 0.05, **P < 0.01, ***P < 0.001.
D261 upregulates miR-99a expression in NSCLC cells
As accumulating evidence suggests that miRNAs are critically involved in the pathogenesis, evolution and progression of cancer, we tried to find out whether miRNAs could be involved in the response of cells to the treatment with D261. We first screened among several famous tumor-suppressive or oncogenic microRNAs, including miR-15, miR-16, miR-34a, miR-99a, miR-195, miR-9, miR-124, and miR-21. Real-time PCR was performed to examined the expression of these miRNAs in NCI-H460 and A549 cells after treatment with D261 (4 μM) for 48 h. Interestingly, out of the 8 miRNAs screened, 4 miRNAs were found to be upregulated by D261 in NCI-H460 (Fig. 5A) and 2 miRNAs were upregulated in A549 (Fig. 5B). Of note, expression of miR-99a was the most strongly increased in both of the cell lines. Further, we observed that D261 could upregulate miR-99a expression in a dose-dependent way but not irregularly (Fig. 5C and D), which suggested that D261 could indeed regulate miR-99a expression in NSCLC cells.
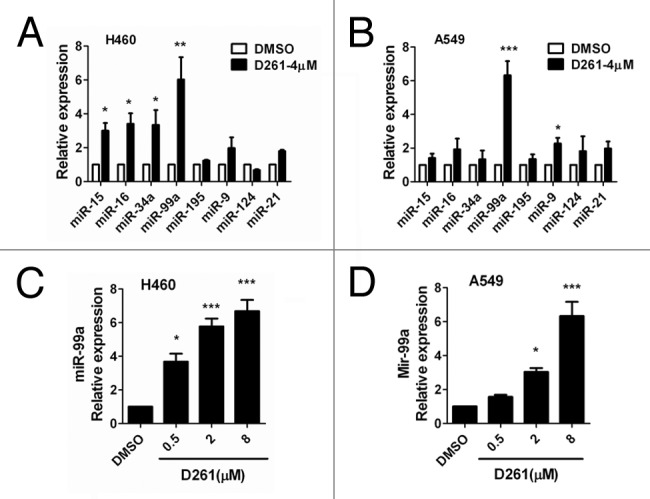
Figure 5. D261 upregulates miR-99a expression in NSCLC cells. NCI-H460 (A) or A549 (B) cells were treated with or without D261 (4 μM) for 48 h, qRT-PCR was performed to determine the relative expression of the indicated micrRNAs. (C and D) MiR-99a fold changes were detected in cells treated with increasing doses of D261 for 48 h. Data are shown as mean ± SEM of three independent experiments. *P < 0.05, **P < 0.01, ***P < 0.001 compared with DMSO control.
MiR-99a/mTOR axis is involved in D261-regulated cell growth and G1/S transition
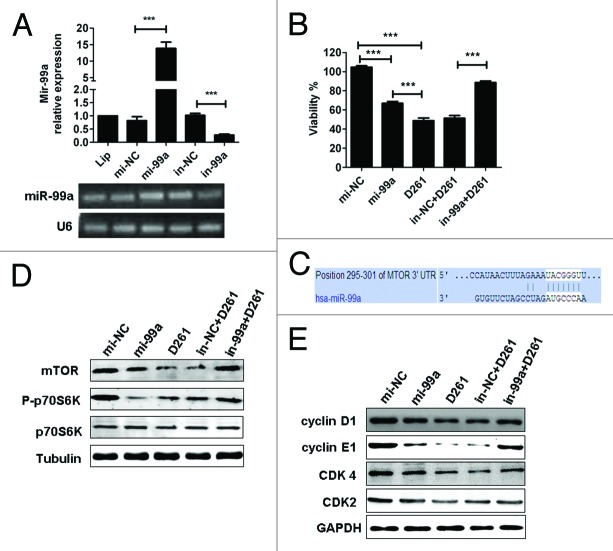
To elucidate the function of miR-99a in D261-induced cell arrest, A549 cells were transfected with miR-99a mimics (mi-99a) or inhibitors (in-99a) before D261 incubation. Transfection of mi-99a for 48 h caused significant upregulation of miR-99a expression, while transfection of in-99a caused significant downregulation of miR-99a expression, as compared with negative controls (Fig. 6A). As expected, overexpression of miR-99a inhibited A549 cell viability, but the inhibition rate (about 33%) was lower than that treated with D261 alone (about 51%) (Fig. 6B). When the cells were transfected with in-99a before D261 incubation, their viability (88.67 ± 3.87%) was higher than those treated with in-NC and D261 (51.38 ± 6.15%) but still lower than the DMSO control cells (100 ± 3.12%) (Fig. 6B).
Figure 6. MiR-99a/mTOR is involved in D261-regulated G1/S transition and cell growth in A549. (A) A549 cells were transfected with miR-99a mimics or inhibitors or their negative control oligonucleotides. MiR-99a expression was determined by qRT-PCR analysis. (B) A549 cells were transfected with miR-99a mimics or inhibitors or their negative control oligonucleotides 24 h before treated with or without D261 (4 μM) for another 48 h. Cell viability was assessed using CCK-8. (C) Predicted consequential pairing of target region of mTOR and miR-99a with Targetscan database. (D) Effects of miR-99a and D261 on the activations of mTOR signaling pathways. A549 cells were treated as in (B), protein levels of mTOR and phosphorylation of p70S6K were analyzed by western blot. (E) Expression of cell cycle molecules influenced by miR-99a and D261 were assayed by western blot. Tubulin or GAPDH was performed as a loading control. Images are representative of three independent experiments. Error bars are mean ± SEM of three independent experiments. *P < 0.05, **P < 0.01, ***P < 0.001. Lip, Lipofectamine RNAiMAX; mi-99a, miR-99a mimics; mi-NC, negative control mimics; in-99a, miR-99a inhibitors; in-NC, negative control inhibitors.
Given previous reports showed that mTOR was a direct target of miR-99a in various cancers,12,32,33 we tended to evaluate whether mTOR signaling was involved in D261-induced G1 arrest. The predicted consequential pairing of target region of mTOR and miR-99a was shown in Figure 6C. As supposed, overexpression of miR-99a in A549 cells induced a significant downregulation of mTOR protein and the downstream phosphorylation of ribosomal protein S6 kinase 1 (S6K1, also known as p70S6K). D261 alone could inhibit mTOR and phosphorylation of p70S6K, while blocked miR-99a by duplex inhibitors attenuated the inhibition effect of D261 (Fig. 6D and E). The similar results were shown in the expression of G1/S transition-related molecules, including cyclin D1, cyclin E1, CDK4, and CDK2 (Fig. 6F and G), which may be due to the alteration of mTOR pathway. In addition, we determined that expression of activated mTOR by transfection of pcDNA3-Flag mTOR plasmid partially rescued D261-induced inhibition of cell growth (Fig. S3). All these data suggested that miR-99a/mTOR axis contributed an important part in the anti-cancer effects of D261. The mechanism of D261 on the inhibition of NSCLC cell growth was depicted in Figure 7.
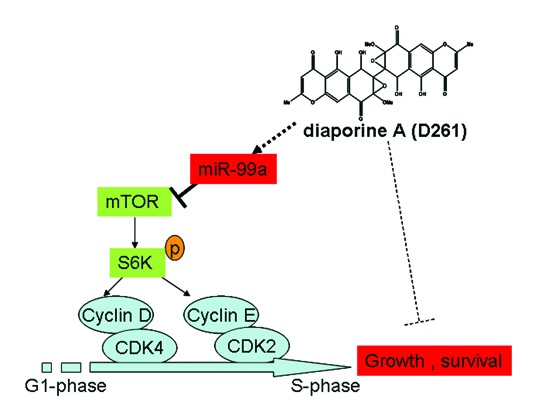
Figure 7. Mechanism of D261 on NSCLC cell growth inhibition. D261 upregulates miR-99a which directly targets mTOR, thus inhibits phosphorylation of S6K (70KD), then induces down-expression of G1/S transition molecules cyclin D/CDK4 and cycline E/CDK2, and results in cell growth inhibition.
Discussion
Dysregulation of cell cycle progression and aberrant activation of CDKs is a hallmark of many human cancers. Thus, manipulation of cell cycle progression by means of small-molecule inhibitors has long been suggested as a potential treatment option for cancers. The current data demonstrated that diaporine A (D261) efficiently caused cell cycle arrest at the G1 phase in NSCLC cells without influencing apoptosis. Moreover, we showed that D261 inhibited several G1/S transition-related molecules including cyclin D1, cyclin E1, CDK4, and CDK2, in a dose-dependent manner. These suggested that D261 could be a new candidate cell cycle inhibitor.
MiR-99a is downregulated in several cancer cell lines and solid tumors including acute lymphoblastic leukemia,34 hepatocellular carcinoma,33 prostate cancer,35 endometrioid endometrial cancer,32 and lung cancer,12 but the mechanisms responsible for its downregulation in tumors are still unknown. By overexpression or inhibition, researchers found that miR-99a could suppress cell proliferation,35 induce G1-phase cell cycle arrest,36 and promote apoptosis.34 The biological targets of miR-99a have been partially identified as FGFR3,37 FKBP51, and IGF1R/mTOR signaling pathways.34,38 However, little is known about the upstream of miR-99a or what can regulate miR-99a expression. To our knowledge, D261 is the first natural agent that can alter miR-99a expression in NSCLC cells. As such, we showed that overexpression of miR-99a antagonized the anti-tumor actions of D261, while inhibition of miR-99a counteracted the anti-tumor activity.
The signaling pathway of mTOR is frequently activated in human cancers. mTOR is a serine/threonine protein kinase that regulates cell proliferation, cell motility, cell survival, protein synthesis, and transcription.39 There is strong evidence that mTOR is required for cell cycle progression and inhibition of mTOR activity by rapamycin arrests cells in the G1 phase of the cell cycle.40 This effect of mTOR on cell cycle progression is mediated, at least in part, by the increased translation of mRNAs encoding positive regulators of cell cycle progression, such as cyclin D1.41 It is, therefore, a potent target for cancer therapy.42 Various natural anti-tumor compounds including EGCG, curcumin, and resveratrol have been reported to inhibit mTOR.43,44 In this study, we demonstrated that D261 treatment inhibited mTOR protein expression and impaired phosphorylation of its downstream p70S6K, which we believe occurred through miRNA-99a upregulation.
However, regulation of miR-99a/mTOR contributed only a part in D261’s anti-tumor actions in NSCLC. As shown in Figure 6, miR-99a mimics inhibited A549 cell viability, but the inhibition rate was lower than that treated with D261 alone; miR-99a inhibitors counteracted D261’s inhibition rate, but not to 100%. These data suggested that there might be other mechanisms involved in the anti-cancer activity of D261. Further investigation is needed to explain the regulation of D261 on miR-99a expression.
In conclusion, we had identified a novel small molecule, D261, for mediating inhibition of NSCLC growth in vitro and in vivo. The anti-cancer actions could be explained, in part, by regulating miR-99a/mTOR signaling.
Materials and Methods
Cells and reagents
The human cancer cell lines NCI-H460, A549, HeLa, HepG2, and MCF-7 were all purchased from Cell Bank, China Academy of Sciences. Cells were maintained in RPMI-1640 (for NCI-H460 and A549) or DMEM (for the others) medium supplemented with 10% (v/v) heat-inactivated fetal bovine serum (FBS) and 100 U/mL of penicillin, 100 mg/mL of streptomycin at 37 °C under 5% humidified CO2. Antibodies specific to β-Tubulin (AP0064), cyclin D1 (BS1741), cyclin E1 (BS1086), CDK2 (BS1049), CDK4 (MB0027), phospho-p70S6K (BS4769), p70S6K (BS1566), and mTOR (BS1555) were purchased from Bioworld Technology. Antibodies specific to GAPDH (G9545), anti-rabbit IgG (A9169), and anti-mouse IgG (A9044) were from Sigma. Cell Counting Kit (CCK-8, CK-04) was purchased from DojinDo Molecular Technologies.
D261 was first isolated from the culture broth of symbiotic fungus named 3lp-10. The purity of D261 was >98% as determined by high performance liquid chromatography (HPLC). It was dissolved in DMSO as a stock solution, stored at −20 °C, and diluted with medium or saline before each experiment.
Cell viability analysis
Different tumor cells were plated in 96-well plates at a density of 2 × 10³ cells/well in media with 10% FBS. After 6 h, the media were changed to serum-free media and cultured for 24 h. Then cells were incubated with various concentrations of D261 or DMSO (as control) for indicated times. Cell viability was assessed using CCK-8 according to the manufacturer’s protocol. The average optical density formed in control cells was taken as 100% viability, and the results of treatments were expressed as a percentage of the control.
Proliferation analysis
A549 or NCI-H460 cells were suspended in PBS containing 0.1% bovine serum albumin and labeled with the vital dye carboxyfluorescein diacetate succinimidyl ester (C34554, Invitrogen) at a final concentration of 2.5 μM for 10 min at 37 °C. After labeling, the cells were washed three times with cold RPMI-1640 medium containing 10% FBS and plated in 24-well plates. Cells were than incubated with different concentrations of D261 for another 72 h. Mean fluorescence intensity was detected by FACS Calibur using CellQuest software (BD Biosciences) and proliferation index was analyzed using ModFit Software.
Clonal growth assay
Clonal growth assay was performed using 1 × 10³ cells/well for 6-well plate. After the incubation with different concentrations of D261 for 24 h, the cells were changed for fresh medium every 3 d. Seven to ten days later, visible colonies were fixed with 4% paraformaldehyde and stained with 0.1% crystal violet staining solution. Colonies of >50 cells were counted and analyzed.
Xenograft mouse model
Female BALB/c nude mice with 4~5 wk were purchased from Model Animal Genetics Research Center of Nanjing University (Nanjing, China) and treated in accordance with the Guide for the Care and Use of Laboratory Animals (National Institutes of Health, USA) and the related ethical regulations of Nanjing University. For the xenografts experiment of NCI-H460, approximately 2 × 10⁶ cells were implanted subcutaneously into mice. After tumors became palpable, the mice bearing NCI-H460 tumors were randomized into two groups (7 mice per group): group 1, vehicle control (treated with saline with DMSO); group 2, 5 mg/kg D261 via intraperitoneal injection every day for 3 wk. The body weight of mice and tumor volume were recorded every 3 d. Tumor volume was measured using a vernier caliper and calculated using the following formula: volume (mm3) = length × width × width / 2.
Apoptosis and cell cycle analysis
Cells (2 × 10⁵ cells/well) were cultured in 12-well plates, synchronized by serum deprivation for 24 h then treated with DMSO or D261 (0.5, 2, or 8 μM) for 48 h. For apoptosis analysis, cells were harvested and washed twice with PBS, and the Annexin V/PI Kit (BMF500FI, eBioscience) was used according to the manufacturer’s guidelines. For cell cycle analysis, cells were harvested, washed twice in PBS, and then fixed in 70% ethanol for 24 h. After the removal of ethanol by centrifugation, cells were washed twice with PBS, and then incubated with 50 μg/mL propidium iodide containing 100 μg/mL RNase and 0.2% TritonX-100 for 30 min at room temperature in the dark. The detection was performed by FACS and analyzed by modfit software.
RNA isolation and real-time quantitative PCR
Total RNA was extracted using the Trizol reagent (Invitrogen) according to the manufacturer’s instructions. RNA concentration was measured with the SmartSpec Plus spectrophotometer (Bio-Rad). RNA integrity was determined using formaldehyde denaturalization agarose gel electrophoresis. Real-time quantitative PCR was performed as described previously.24 The primers used are shown in Table 1.
Table 1. MicroRNA and mRNA primer information.
| Gene | Forward primer (5′-3′) | Reverse primer (5′-3′) |
|---|---|---|
| β-actin | TCTGGCACCA CACCTTCTA | AGGCATACAG GGACAGCAC |
| CCND1 | GCTGCGAAGT GGAAACCATC | CCTCCTTCTG CACACATTTG AA |
| CCNE1 | ACTCAACGTG CAAGCCTCG | GCTCAAGAAA GTGCTGATCC C |
| CDK2 | CCAGGAGTTA CTTCTATGCC TA | TTCATCCAGG GGAGGTACAA C |
| CDK4 | CATGTAGACC AGGACCTAAG G | AACTGGCGCA TCAGATCCTA G |
| CDK6 | GCCTTGCCCG CATCTATAGT | AGCCAACACT CCAGAGATCC |
| URP | TGGTGTCGTG GAGTCG | |
| U6 | CTCGCTTCGG CAGCACA | AACGCTTCAC GAATTTGCGT |
| has-mir-15a | ACACTCCAGC TGGGTAGCAG CACATAATG | CTCAACTGGT GTCGTGGAGT CGGCAATTCA GTTGAGCACA AACC |
| has-mir-16 | ACACTCCAGC TGGGTAGCAG CACGTAAAT | CTCAACTGGT GTCGTGGAGT CGGCAATTCA GTTGAGCGCC AATA |
| has-mir-99a | ACACTCCAGC TGGGAACCCG TAGATCCGA | CTCAACTGGT GTCGTGGAGT CGGCAATTCA GTTGAGCACA AGAT |
| has-mir-124 | ACACTCCAGC TGGGCGTGTT CACAGCGGA | CTCAACTGGT GTCGTGGAGT CGGCAATTCA GTTGAGATCA AGGT |
| hsa-mir-195 | ACACTCCAGC TGGGTAGCAG CACAGAAAT | CTCAACTGGT GTCGTGGAGT CGGCAATTCA GTTGAGGCCA ATAT |
| hsa-miR-34a | ACACTCCAGC TGGGTGGCAG TGTCTTAGCT | CTCAACTGGT GTCGTGGAGT CGGCAATTCA GTTGAGACAA CCAG |
| hsa-miR-9 | ACACTCCAGC TGGGTCTTTG GTTATCTAGC T | CTCAACTGGT GTCGTGGAGT CGGCAATTCA GTTGAGTCAT ACAG |
| hsa-miR-21 | ACACTCCAGC TGGGTAGCTT ATCAGACTGA | CTCAACTGGT GTCGTGGAGT CGGCAATTCA GTTGAGTCAA CATC |
Western blot
Cells were treated with or without D261 for 48 h, harvested, lysed, and blotted as described previously.45 For detecting mTOR, electrophoresis was performed with 8% gel and for others with 10% gel. Protein bands were scanned and quantified using Image J software.
Transfection of miR-99a mimics or inhibitors
MiR-99a mimics (mi-99a), miR-99a inhibitors (in-99a) and their negative controls (mi-NC or in-NC) were obtained from Genepharma. MiR-99a mimics (50 nM) and inhibitors (100 nM), as well as the negative controls, were transfected using Lipofectamine RNAiMAX according to the manufacturer’s instructions (13778075, Invitrogen). MiR-99a expression was determined 48 h after transfection by real-time PCR. For miR-99a functional examination, cells were transfected with miR-99a mimics or inhibitors for 24 h and then incubated with D261 for another 48 h.
Statistical analysis
All data are expressed as the mean ± SEM unless otherwise indicated. Differences between groups were compared by analysis of variance followed by the post hoc Tukey test to correct for multiple comparisons. P < 0.05 was taken to indicate statistical significance. All calculations were performed using the Prism 5 software (GraphPad).
Supplementary Material
Disclosure of Potential Conflicts of Interest
No potential conflicts of interest were disclosed.
Acknowledgments
This work was supported by the Natural Science Foundation for Young Scholars of Jiangsu Province (BK20140615), the National Natural Science Foundation of China (81121062), the Medical Science and Technology Development Foundation of Nanjing (201308002, JQX13004, YKK12076, and QRX11243), the Scientific Research Foundation of Graduate School of Nanjing University (2012CL03), and the Nature Science Foundation of Colleges and Universities of Jiangsu Province (12KJD180004).
Glossary
Abbreviations:
- NSCLC
non-small cell lung cancer
- CDK
cyclin-dependent kinase
- mTOR
mammalian target of rapamycin
- p70S6K
ribosomal protein S6 kinase (70KD)
- CFSE
carboxyfluorescein diacetate succinimidyl ester
- MK
midkine
- miRNAs
microRNAs
References
- 1.American Cancer Society. Cancer Facts and Figures. Atlanta, GA, American Cancer Society. 2012. [Google Scholar]
- 2.Iorio MV, Croce CM. MicroRNAs in cancer: small molecules with a huge impact. J Clin Oncol. 2009;27:5848–56. doi: 10.1200/JCO.2009.24.0317. [DOI] [PMC free article] [PubMed] [Google Scholar]
- 3.Garzon R, Calin GA, Croce CM. MicroRNAs in Cancer. Annu Rev Med. 2009;60:167–79. doi: 10.1146/annurev.med.59.053006.104707. [DOI] [PubMed] [Google Scholar]
- 4.Miska EA. How microRNAs control cell division, differentiation and death. Curr Opin Genet Dev. 2005;15:563–8. doi: 10.1016/j.gde.2005.08.005. [DOI] [PubMed] [Google Scholar]
- 5.Palma CA, Al Sheikha D, Lim TK, Bryant A, Vu TT, Jayaswal V, Ma DD. MicroRNA-155 as an inducer of apoptosis and cell differentiation in Acute Myeloid Leukaemia. Mol Cancer. 2014;13:79. doi: 10.1186/1476-4598-13-79. [DOI] [PMC free article] [PubMed] [Google Scholar]
- 6.Bertero T, Gastaldi C, Bourget-Ponzio I, Mari B, Meneguzzi G, Barbry P, Ponzio G, Rezzonico R. CDC25A targeting by miR-483-3p decreases CCND-CDK4/6 assembly and contributes to cell cycle arrest. Cell Death Differ. 2013;20:800–11. doi: 10.1038/cdd.2013.5. [DOI] [PMC free article] [PubMed] [Google Scholar]
- 7.Song Q, Xu Y, Yang C, Chen Z, Jia C, Chen J, Zhang Y, Lai P, Fan X, Zhou X, et al. miR-483-5p promotes invasion and metastasis of lung adenocarcinoma by targeting RhoGDI1 and ALCAM. Cancer Res. 2014;74:3031–42. doi: 10.1158/0008-5472.CAN-13-2193. [DOI] [PubMed] [Google Scholar]
- 8.Bandi N, Zbinden S, Gugger M, Arnold M, Kocher V, Hasan L, Kappeler A, Brunner T, Vassella E. miR-15a and miR-16 are implicated in cell cycle regulation in a Rb-dependent manner and are frequently deleted or down-regulated in non-small cell lung cancer. Cancer Res. 2009;69:5553–9. doi: 10.1158/0008-5472.CAN-08-4277. [DOI] [PubMed] [Google Scholar]
- 9.Wang Y, Gu J, Roth JA, Hildebrandt MA, Lippman SM, Ye Y, Minna JD, Wu X. Pathway-based serum microRNA profiling and survival in patients with advanced stage non-small cell lung cancer. Cancer Res. 2013;73:4801–9. doi: 10.1158/0008-5472.CAN-12-3273. [DOI] [PMC free article] [PubMed] [Google Scholar]
- 10.Bandi N, Vassella E. miR-34a and miR-15a/16 are co-regulated in non-small cell lung cancer and control cell cycle progression in a synergistic and Rb-dependent manner. Mol Cancer. 2011;10:55. doi: 10.1186/1476-4598-10-55. [DOI] [PMC free article] [PubMed] [Google Scholar]
- 11.Yongchun Z, Linwei T, Xicai W, Lianhua Y, Guangqiang Z, Ming Y, Guanjian L, Yujie L, Yunchao H. MicroRNA-195 inhibits non-small cell lung cancer cell proliferation, migration and invasion by targeting MYB. Cancer Lett. 2014;347:65–74. doi: 10.1016/j.canlet.2014.01.019. [DOI] [PubMed] [Google Scholar]
- 12.Oneyama C, Ikeda J, Okuzaki D, Suzuki K, Kanou T, Shintani Y, Morii E, Okumura M, Aozasa K, Okada M. MicroRNA-mediated downregulation of mTOR/FGFR3 controls tumor growth induced by Src-related oncogenic pathways. Oncogene. 2011;30:3489–501. doi: 10.1038/onc.2011.63. [DOI] [PubMed] [Google Scholar]
- 13.Gao W, Shen H, Liu L, Xu J, Xu J, Shu Y. MiR-21 overexpression in human primary squamous cell lung carcinoma is associated with poor patient prognosis. J Cancer Res Clin Oncol. 2011;137:557–66. doi: 10.1007/s00432-010-0918-4. [DOI] [PMC free article] [PubMed] [Google Scholar]
- 14.Li Y, Kong D, Wang Z, Sarkar FH. Regulation of microRNAs by natural agents: an emerging field in chemoprevention and chemotherapy research. Pharm Res. 2010;27:1027–41. doi: 10.1007/s11095-010-0105-y. [DOI] [PMC free article] [PubMed] [Google Scholar]
- 15.Sethi S, Li Y, Sarkar FH. Regulating miRNA by natural agents as a new strategy for cancer treatment. Curr Drug Targets. 2013;14:1167–74. doi: 10.2174/13894501113149990189. [DOI] [PMC free article] [PubMed] [Google Scholar]
- 16.Li Y, VandenBoom TG, 2nd, Kong D, Wang Z, Ali S, Philip PA, Sarkar FH. Up-regulation of miR-200 and let-7 by natural agents leads to the reversal of epithelial-to-mesenchymal transition in gemcitabine-resistant pancreatic cancer cells. Cancer Res. 2009;69:6704–12. doi: 10.1158/0008-5472.CAN-09-1298. [DOI] [PMC free article] [PubMed] [Google Scholar]
- 17.Sun M, Estrov Z, Ji Y, Coombes KR, Harris DH, Kurzrock R. Curcumin (diferuloylmethane) alters the expression profiles of microRNAs in human pancreatic cancer cells. Mol Cancer Ther. 2008;7:464–73. doi: 10.1158/1535-7163.MCT-07-2272. [DOI] [PubMed] [Google Scholar]
- 18.Tsang WP, Kwok TT. Epigallocatechin gallate up-regulation of miR-16 and induction of apoptosis in human cancer cells. J Nutr Biochem. 2010;21:140–6. doi: 10.1016/j.jnutbio.2008.12.003. [DOI] [PubMed] [Google Scholar]
- 19.Sheth S, Jajoo S, Kaur T, Mukherjea D, Sheehan K, Rybak LP, Ramkumar V. Resveratrol reduces prostate cancer growth and metastasis by inhibiting the Akt/MicroRNA-21 pathway. PLoS One. 2012;7:e51655. doi: 10.1371/journal.pone.0051655. [DOI] [PMC free article] [PubMed] [Google Scholar]
- 20.Sun L, Hua C, Yang Y, Dou H, Li E, Tan R, Hou Y. Chaeoglobosin Fex inhibits poly(I:C)-induced activation of bone marrow-derived dendritic cells. Mol Immunol. 2012;51:150–8. doi: 10.1016/j.molimm.2012.02.125. [DOI] [PubMed] [Google Scholar]
- 21.Yang Y, Dou H, Li X, Song Y, Gong W, Tan R, Hou Y. FC-98 regulates TLR9-mediated of CXCL-10 expression in dendritic cells via MAPK and STAT1 signaling pathway. Biomed Res Int. 2014;2014:926130. doi: 10.1155/2014/926130. [DOI] [PMC free article] [PubMed] [Google Scholar]
- 22.Hua C, Yang Y, Sun L, Dou H, Tan R, Hou Y. Chaetoglobosin F, a small molecule compound, possesses immunomodulatory properties on bone marrow-derived dendritic cells via TLR9 signaling pathway. Immunobiology. 2013;218:292–302. doi: 10.1016/j.imbio.2012.05.015. [DOI] [PubMed] [Google Scholar]
- 23.Song Y, Dou H, Gong W, Liu X, Yu Z, Li E, Tan R, Hou Y. Bis-N-norgliovictin, a small-molecule compound from marine fungus, inhibits LPS-induced inflammation in macrophages and improves survival in sepsis. Eur J Pharmacol. 2013;705:49–60. doi: 10.1016/j.ejphar.2013.02.008. [DOI] [PubMed] [Google Scholar]
- 24.Dou H, Song Y, Liu X, Yang L, Jiang N, Chen D, Li E, Tan R, Hou Y. A Novel Benzenediamine Derivate Rescued Mice from Experimental Sepsis by Attenuating Pro-inflammatory Mediators via IRAK4. Am J Respir Cell Mol Biol. 2014:In press. doi: 10.1165/rcmb.2013-0411OC. [DOI] [PubMed] [Google Scholar]
- 25.Mori H, Kawai K, Ohbayashi F, Kuniyasu T, Yamazaki M, Hamasaki T, Williams GM. Genotoxicity of a variety of mycotoxins in the hepatocyte primary culture/DNA repair test using rat and mouse hepatocytes. Cancer Res. 1984;44:2918–23. [PubMed] [Google Scholar]
- 26.Igarashi Y, Kuwamori Y, Takagi K, Ando T, Fudou R, Furumai T, Oki T. Xanthoepocin, a new antibiotic from Penicillium simplicissimum IFO5762. J Antibiot (Tokyo) 2000;53:928–33. doi: 10.7164/antibiotics.53.928. [DOI] [PubMed] [Google Scholar]
- 27.Kawai KN. T.; Nozawa, Y. The biological activity of floccosin from Epidermophyton floccosum. The effects on mitochondrial reactions. Jpn J Assoc Mycotoxicol. 1982;16:1–3. [Google Scholar]
- 28.Tsutsui J, Kadomatsu K, Matsubara S, Nakagawara A, Hamanoue M, Takao S, Shimazu H, Ohi Y, Muramatsu T. A new family of heparin-binding growth/differentiation factors: increased midkine expression in Wilms’ tumor and other human carcinomas. Cancer Res. 1993;53:1281–5. [PubMed] [Google Scholar]
- 29.Kerzerho J, Adotevi O, Castelli FA, Dosset M, Bernardeau K, Szely N, Lang F, Tartour E, Maillere B. The angiogenic growth factor and biomarker midkine is a tumor-shared antigen. J Immunol. 2010;185:418–23. doi: 10.4049/jimmunol.0901014. [DOI] [PubMed] [Google Scholar]
- 30.Takei Y, Kadomatsu K, Matsuo S, Itoh H, Nakazawa K, Kubota S, Muramatsu T. Antisense oligodeoxynucleotide targeted to Midkine, a heparin-binding growth factor, suppresses tumorigenicity of mouse rectal carcinoma cells. Cancer Res. 2001;61:8486–91. [PubMed] [Google Scholar]
- 31.Zhao S, Zhao G, Xie H, Huang Y, Hou Y. A conjugate of an anti-midkine single-chain variable fragment to doxorubicin inhibits tumor growth. Braz J Med Biol Res. 2012;45:230–7. doi: 10.1590/S0100-879X2012007500009. [DOI] [PMC free article] [PubMed] [Google Scholar]
- 32.Torres A, Torres K, Pesci A, Ceccaroni M, Paszkowski T, Cassandrini P, Zamboni G, Maciejewski R. Deregulation of miR-100, miR-99a and miR-199b in tissues and plasma coexists with increased expression of mTOR kinase in endometrioid endometrial carcinoma. BMC Cancer. 2012;12:369. doi: 10.1186/1471-2407-12-369. [DOI] [PMC free article] [PubMed] [Google Scholar]
- 33.Li D, Liu X, Lin L, Hou J, Li N, Wang C, Wang P, Zhang Q, Zhang P, Zhou W, et al. MicroRNA-99a inhibits hepatocellular carcinoma growth and correlates with prognosis of patients with hepatocellular carcinoma. J Biol Chem. 2011;286:36677–85. doi: 10.1074/jbc.M111.270561. [DOI] [PMC free article] [PubMed] [Google Scholar]
- 34.Li XJ, Luo XQ, Han BW, Duan FT, Wei PP, Chen YQ. MicroRNA-100/99a, deregulated in acute lymphoblastic leukaemia, suppress proliferation and promote apoptosis by regulating the FKBP51 and IGF1R/mTOR signalling pathways. Br J Cancer. 2013;109:2189–98. doi: 10.1038/bjc.2013.562. [DOI] [PMC free article] [PubMed] [Google Scholar]
- 35.Sun D, Lee YS, Malhotra A, Kim HK, Matecic M, Evans C, Jensen RV, Moskaluk CA, Dutta A. miR-99 family of MicroRNAs suppresses the expression of prostate-specific antigen and prostate cancer cell proliferation. Cancer Res. 2011;71:1313–24. doi: 10.1158/0008-5472.CAN-10-1031. [DOI] [PMC free article] [PubMed] [Google Scholar]
- 36.Cui L, Zhou H, Zhao H, Zhou Y, Xu R, Xu X, Zheng L, Xue Z, Xia W, Zhang B, et al. MicroRNA-99a induces G1-phase cell cycle arrest and suppresses tumorigenicity in renal cell carcinoma. BMC Cancer. 2012;12:546. doi: 10.1186/1471-2407-12-546. [DOI] [PMC free article] [PubMed] [Google Scholar]
- 37.Jiang H, Qu L, Wang Y, Cong J, Wang W, Yang X. miR-99a promotes proliferation targeting FGFR3 in human epithelial ovarian cancer cells. Biomed Pharmacother. 2014;68:163–9. doi: 10.1016/j.biopha.2013.12.001. [DOI] [PubMed] [Google Scholar]
- 38.Yen YC, Shiah SG, Chu HC, Hsu YM, Hsiao JR, Chang JY, Hung WC, Liao CT, Cheng AJ, Lu YC, et al. Reciprocal regulation of microRNA-99a and insulin-like growth factor I receptor signaling in oral squamous cell carcinoma cells. Mol Cancer. 2014;13:6. doi: 10.1186/1476-4598-13-6. [DOI] [PMC free article] [PubMed] [Google Scholar]
- 39.Hay N, Sonenberg N. Upstream and downstream of mTOR. Genes Dev. 2004;18:1926–45. doi: 10.1101/gad.1212704. [DOI] [PubMed] [Google Scholar]
- 40.Abraham RT, Wiederrecht GJ. Immunopharmacology of rapamycin. Annu Rev Immunol. 1996;14:483–510. doi: 10.1146/annurev.immunol.14.1.483. [DOI] [PubMed] [Google Scholar]
- 41.Gera JF, Mellinghoff IK, Shi Y, Rettig MB, Tran C, Hsu JH, Sawyers CL, Lichtenstein AK. AKT activity determines sensitivity to mammalian target of rapamycin (mTOR) inhibitors by regulating cyclin D1 and c-myc expression. J Biol Chem. 2004;279:2737–46. doi: 10.1074/jbc.M309999200. [DOI] [PubMed] [Google Scholar]
- 42.Moschetta M, Reale A, Marasco C, Vacca A, Carratù MR. Therapeutic targeting of the mTOR-signaling pathway in cancer: benefits and limitations. Br J Pharmacol. 2014 doi: 10.1111/bph.12749. In press. [DOI] [PMC free article] [PubMed] [Google Scholar]
- 43.Beevers CS, Li F, Liu L, Huang S. Curcumin inhibits the mammalian target of rapamycin-mediated signaling pathways in cancer cells. Int J Cancer. 2006;119:757–64. doi: 10.1002/ijc.21932. [DOI] [PubMed] [Google Scholar]
- 44.Zhou H, Luo Y, Huang S. Updates of mTOR inhibitors. Anticancer Agents Med Chem. 2010;10:571–81. doi: 10.2174/187152010793498663. [DOI] [PMC free article] [PubMed] [Google Scholar]
- 45.Zhao G, Nie Y, Lv M, He L, Wang T, Hou Y. ERβ-mediated estradiol enhances epithelial mesenchymal transition of lung adenocarcinoma through increasing transcription of midkine. Mol Endocrinol. 2012;26:1304–15. doi: 10.1210/me.2012-1028. [DOI] [PMC free article] [PubMed] [Google Scholar]
Associated Data
This section collects any data citations, data availability statements, or supplementary materials included in this article.


