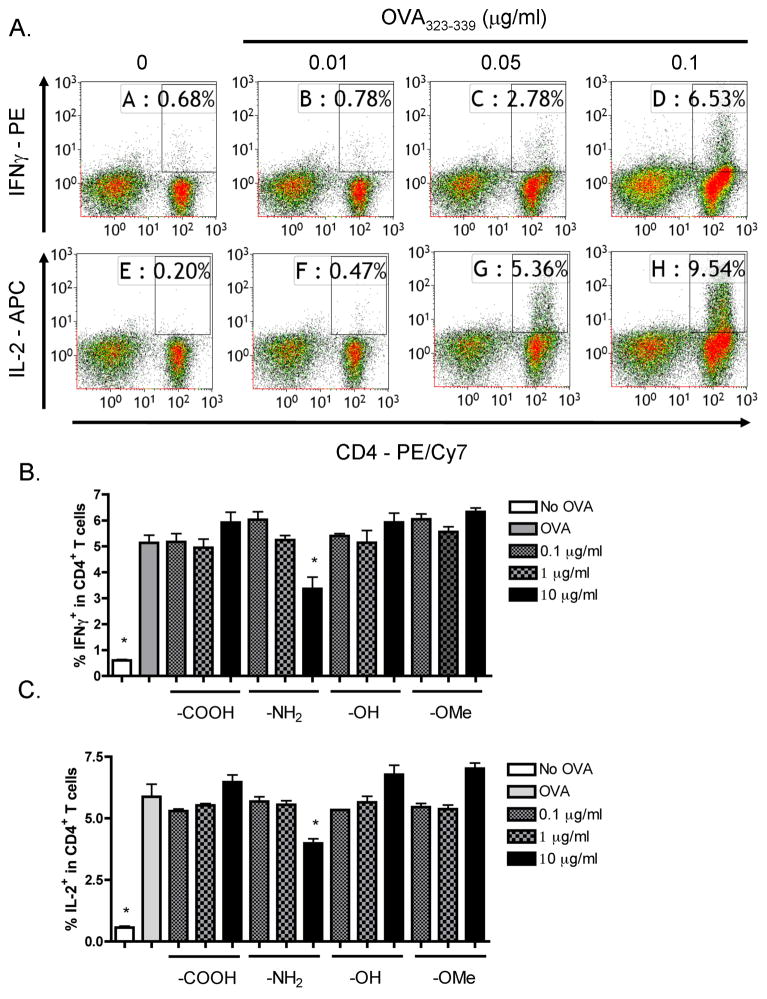
Figure 6.
Absence of enhancement by SNPs with different functional groups on CD4+ T cell responses under suboptimal OVA323–339 stimulation. (A) OT-II splenocytes (CD4+ T cells, 8 × 10⁵ cells/well) were incubated with various concentrations of OVA323–339 peptide (10−2 to 0.1 μg/ml) for 2 days. (B and C) SNPs with different functional groups, including LTM40PTrg4PEG (–OMe), LTM40PTrg4PEGOH (–OH), LTM40PTrg4PEGCOOH (–COOH) and LTM40PTrg4PEGNH2 (–NH2), were sonicated and added to OT-II splenocytes at various concentrations (10−1 to 10 μg/ml) prior to OVA323–339 peptide stimulation (0.05 μg/ml) for 2 days. (A–C) Brefeldin A was added during the last 6 h of incubation. Splenocytes were stained for viability, surface CD4 and intracellular IFNγ or IL-2 expression. The percent of IFNγ+ or IL-2+ cells within CD4+ T cells is presented in the quadrants in dot plots (A), with X axis and Y axis representing fluorescence intensity for CD4 and IFNγ or IL-2, respectively. Three replicates were concatenated for each treatment in the flow cytometry analysis (A). The percent of IFNγ+ (B) or IL-2+ (C) cells within CD4+ T cells is presented as the mean % ± SE of triplicate cultures. *p < 0.05 as compared to respective no SNP treatment (0 μg/ml) control. Data are representative of at least two separate experiments.

