

Abstract
Objective
Elevations in uric acid (UA) and the associated hyperuricaemia are commonly observed secondary to treatment with thiazide diuretics. We sought to identify novel single-nucleotide polymorphisms (SNPs) associated with hydrochlorothiazide (HCTZ)-induced elevations in UA and hyperuricaemia.
Methods
A genome-wide association study of HCTZ-induced changes in UA was performed in Caucasian and African American participants from the Pharmacogenomic Evaluation of Antihypertensive Response (PEAR) study who were treated with HCTZ monotherapy. Suggestive SNPs were replicated in Caucasians and African Americans from the PEAR study who were treated with HCTZ add-on therapy. Replicated regions were followed up through expression and pathway analysis.
Results
Five unique gene regions were identified in African Americans (LUC7L2, ANKRD17/COX18, FTO, PADI4 and PARD3B) and one region was identified in Caucasians (GRIN3A). Increases in UA of up to 1.8 mg/dL were observed following HCTZ therapy in individuals homozygous for risk alleles, with heterozygotes displaying an intermediate phenotype. Several risk alleles were also associated with an increased risk of HCTZ-induced clinical hyperuricaemia. A composite risk score, constructed in African Americans using the ‘top’ SNP from each gene region, was strongly associated with HCTZ-induced UA elevations (P = 1.79×10⁻⁷) and explained 11% of the variability in UA response. Expression studies in RNA from whole blood revealed significant differences in expression of FTO by rs4784333 genotype. Pathway analysis showed putative connections between many of the genes identified through common microRNAs.
Conclusion
Several novel gene regions were associated with HCTZ-induced UA elevations in African Americans (LUC7L2, COX18/ANKRD17, FTO, PADI4 and PARD3B) and one region was associated with these elevations in Caucasians (GRIN3A).
Keywords: genome-wide association study, hydrochlorothiazide, hypertension, pharmacogenetics, polymorphism, uric acid
Introduction
Hyperuricaemia, defined as a serum uric acid (UA) level >7.0 mg/dL for men and >6.0 mg/dL for women, is present in 21.2% and 21.6% of men and women, respectively, in the USA, and the prevalence has risen over the last two decades [1]. Elevated serum UA, the final breakdown product of purine metabolism, is clinically associated with an increased risk of gout. Additionally, a growing body of evidence suggests that hyperuricaemia may be associated with a variety of cardiovascular and metabolic disorders including hypertension [2, 3], diabetes [4], insulin resistance [5], obesity [6], metabolic syndrome [7] and coronary artery disease [8]. Recent findings indicate that hyperuricaemia may be more than just a marker of cardiovascular and metabolic disorders. In rat models, pharmacological lowering of serum UA can reduce blood pressure (BP), lower serum triglyceride levels and improve insulin resistance [9, 10]. Further underscoring the relationship between UA and cardiovascular health, recent findings suggest that the xanthine oxidase inhibitor allopurinol may reduce BP in individuals with hyperuricaemia [11]. It has also been proposed that as concentrations increase, UA loses its antioxidant capabilities and potentially becomes pro-oxidant, which would further contribute to cardiovascular damage [12].
Thiazide diuretics can elevate serum UA by up to 35%, often resulting in clinical hyperuricaemia [13]. Hydrochlorothiazide (HCTZ), alone or in combination, is the most commonly prescribed thiazide diuretic and antihypertensive agent in the USA [14] and is currently recommended as first-line treatment for most individuals with essential hypertension. HCTZ use is associated with a variety of adverse metabolic effects, including an increased risk of developing diabetes, which may be associated, in part, with hyperuricaemia [15]. In rats, HCTZ administration exacerbates fructose-induced hyperuricaemia, and correcting HCTZ-induced hyperuricaemia improves insulin resistance and hypertriglyceridaemia to levels similar to those before HCTZ treatment [16]. Although the exact mechanism of HCTZ-induced hyperuricaemia remains unknown, HCTZ may increase serum UA through diverse mechanisms including impairment of UA secretion secondary to volume depletion [17], inhibition of UA efflux by multidrug resistance protein 4 [18] and increasing UA reuptake through direct effects on organic anion transporter 4 [19]. Given the frequent use of HCTZ, and thiazide diuretics in general, a greater understanding of the mechanisms underlying thiazide-induced hyperuricaemia is needed.
Genetic influences are thought to contribute substantially to individual variability in UA clearance by the kidney [20], and to serum UA levels; heritability has been estimated to be approximately 40% [21]. The first genes associated with UA elevation to be identified by the genome-wide association study (GWAS) approach were the transporters SLC2A9 and ABCG2 [22, 23]. A meta-analysis later identified several potential additional genes, including the transporters SLC22A12, SLC22A11, SLC17A1 and SLC16A9, the scaffolding protein PDZK1, glucokinase regulatory protein (GCKR) and the cytoskeletal protein carmil (LRRC16A) [24]. Two other genes, methylene tetrahydrofolate reductase (MTHFR) and the β3 adrenergic receptor (ADRB3) have also been associated with UA elevations [25]. To our knowledge, no pharmacogenomic studies investigating genetic associations with thiazide-induced elevations in UA levels have been published to date.
In the current study, we used a GWAS-based approach to identify potential novel pharmacogenomic influences on HCTZ-induced elevations in UA and risk of developing clinical hyperuricaemia in individuals of both African American and Caucasian descent.
Methods
Pharmacogenomic Evaluation of Antihypertensive Responses (PEAR) trial
Details of the PEAR study have been described previously (www.clinicaltrials.gov, NCT00246519) [26]. Participants with mild to moderate hypertension [at home diastolic BP (DBP) >85 mmHg and in the clinic DBP >90 mmHg] aged 17–65 years were enrolled at the University of Florida (Gainesville, FL, USA), Emory University (Atlanta, GA, USA) and Mayo Clinic (Rochester, MN, USA). Following enrolment, all antihypertensive therapy was discontinued in treated participants. After an average washout period of 4 weeks, hypertension was confirmed and participants were randomly assigned to receive monotherapy with either atenolol or HCTZ. Participants received 50 mg/day atenolol or 12.5 mg/day HCTZ, titrated to 100 mg/day or 25 mg/day, respectively, if BP remained above 120/70 mmHg after 3 weeks. After 9 weeks of treatment, if BP remained above 120/70 mmHg the other drug (i.e. atenolol for those assigned to HCTZ, and vice versa) was added and participants were followed for 9 additional weeks. Home BP was monitored throughout the trial. All individuals provided written informed consent to participate and supply genetic material. The PEAR study was approved by the institutional review board at each study centre and was carried out in compliance with the Declaration of Helsinki.
Serum uric acid measurements
Serum was collected at baseline and after each treatment phase. UA levels were measured in a research laboratory, on a Hitachi 911 Chemistry Analyzer (Roche, Basel, Switzerland) at the Mayo Clinic. The instrument was always calibrated with control samples before use. The between-day variation for the control samples ranged from ± 0.19 to 0.36 mg/dL, and the coefficient of variation ranged from 3.58% to 4.13%.
Genome-wide analysis genotyping and quality control
The HumanCVD Beadchip was genotyped on the iScan System using the Infinium II Assay (Illumina, San Diego, CA, USA). Genotypes were called using GenomeStudio Software version 2011.1 and the Genotyping Module version 1.9 calling algorithm (Illumina). Patients were excluded if sample genotype call rates were below 95% and single-nucleotide polymorphisms (SNPs) were excluded if genotype call rates were below 90%. Overall, 81 blind duplicates were included in the genotyping and had a concordance rate of 99.992%. Gender was confirmed from X chromosome genotype data, and cryptic relatedness was estimated by pairwise identity-by-descent (IBD) analysis implemented using PLINK [27] (http://pngu.mgh.harvard.edu/purcell/plink/). One pair of monozygotic twins was identified in this analysis and one subject was excluded. Five pairs of samples were identified as first-degree relatives; these individuals all remained in the analysis. Heterozygosity was assessed using PLINK, by estimating the inbreeding coefficient (F). One subject had an F value >4 negative standard deviations from the mean and was excluded. The final dataset consisted of 767 subjects.
Similar genotyping and quality control procedures were employed for the GWAS (genome-wide association study). DNA samples from participants in the PEAR study were genotyped for more than 1 million SNP markers using the Illumina Human Omni1-Quad Beadchip. Genotypes were called using BeadStudio software and the GenTrain2 calling algorithm (Illumina). For participants included in the analyses, genotype call rates exceeded 95% over all SNPs. SNPs with call rates of <95% among all PEAR participants were excluded from the analyses. Sample contamination was detected by examining gender mismatches using X chromosome genotype data, and cryptic relatedness was estimated by pairwise IBD analysis implemented using PLINK. Hardy-Weinberg equilibrium was assessed using a chi-square test with one degree of freedom.
Imputation and principal component analysis
The MACH15 software (www.sph.umich.edu/csg/abecasis/MACH/download) was used to impute approximately 2.5 million SNPs using the HapMap Phase II CEU as the reference panel for Caucasians and the CEU and YRI panels for African Americans. Quality control was performed using standard procedures (RSQ_HAT <0.3 and MAF ≤0.05). After quality control and imputation, more than 2 million SNPs remained for analysis. A principal component analysis (PCA) was performed in all samples on a linkage disequilibrium (LD)-pruned dataset using the EIGENSTRAT method [28]. Participants were grouped into African American and Caucasian ancestry groups based upon PCA data. There were very few Asians in the study (n = 8) and PCA suggested it was reasonable to combine individuals of Caucasian and Asian ancestry into one group. The first two principal components that provided the best separation of ancestry clusters (PC 1 and PC 2) were selected to be included as covariates for analysis.
Statistical analysis
UA elevation analyses were performed separately for each race group using linear regression in PLINK [27]. Analyses were controlled for age, gender, baseline UA, body mass index (BMI) and PC 1 and PC 2. SNPs with a minor allele frequency below 3% were excluded. No SNPs were identified with genome-wide significance (OmniQuad chip, P < 5×10⁻⁸; HumanCVD chip, P < 1×10⁻⁶) for HCTZ monotherapy in either race group with data from either chip. Next, suggestive SNPs were identified. For the OmniQuad chip, a cutoff of P < 1×10⁻⁴ was used. Because the IBC chip was designed using a metabolic candidate gene approach and contained 20-fold fewer SNPs, a cutoff of P < 5×10⁻⁴ was used. All potentially suggestive SNPs identified were then tested for replication using an independent cohort of participants within the PEAR study who received HCTZ as add-on therapy. To be considered a replication, SNPs must have had a P-value of <0.05 in the add-on cohort and effects in the same direction as those observed in the monotherapy group. SNPs were also tested for additional replication (P < 0.05 and effects in the same direction) in the HCTZ monotherapy cohort of the other race group (i.e. SNPs that were identified in African Americans were tested for replication in Caucasians, and vice versa). The region was also examined in the other race group to determine whether the gene contained significant SNPs nearby (i.e. regions surrounding SNPs there were identified in African Americans were examined in Caucasians, and vice versa). Meta-analysis of both the HCTZ monotherapy and add-on therapy groups was performed for replicated SNPs using the program METAL [29].
The risk of developing hyperuricaemia (UA >6.0 mg/dL for women or >7.0 mg/dL for men) was determined using logistic regression modelling (SAS 9.2, SAS Institute, Cary NC, USA) to test the potential clinical impact of the observed associations. Only participants who were normouricaemic at baseline were included. Participants from both the monotherapy and add-on therapy groups were included in the analysis. Adjustments were made for age, gender, baseline UA, BMI and PCs 1 and 2.
UA elevation risk score
To determine the effect of multiple risk alleles on HCTZ-induced UA elevations, and to examine the relative contribution of genetic and clinical variables, we constructed a genetic risk score based on our ‘top’ genes. We began by examining a series of clinical predictor variables based on known characteristics associated with baseline UA as reported previously [1]. Linear regression (SAS 9.2) was used to determine the P-value and r-squared value of each variable and the analysis was limited to African Americans, as most of the significant findings occurred in this group. The variables selected for inclusion in the model were baseline UA, age, gender, BMI, log years of hypertension, estimated glomerular filtration rate, alcohol consumption (yes/no) and HCTZ treatment (monotherapy vs. add-on therapy).
Genetic risk scores were constructed in African Americans through an unweighted, allele-counting approach. One point was given for each risk allele, defined as the allele associated with a greater HCTZ-induced UA elevation. For gene regions with multiple significant SNPs, only the most strongly associated SNP was used in computing the risk score. Linear regression models were used to examine the association between the genetic risk score and HCTZ-induced elevation in UA. Baseline UA, age, gender and log duration of hypertension were included in this model.
Ingenuity Pathway Analysis of top genes
To further examine the potential physiological roles of the top genes identified by this study, we used Ingenuity Pathway Analysis software (Ingenuity Systems, www.ingenuity.com, Redwood City CA, USA). A list of the top genes associated with HCTZ-induced elevations in UA was entered into the Ingenuity software, which then identified potential biological pathways in which the genes might be involved, including potential interacting partners and putative regulatory microRNAs.
Gene expression analysis
Based on the in silico analysis, gene expression analysis was performed for the top genes that were (i) associated with HCTZ-induced elevations in UA and (ii) predicted to share a common microRNA regulatory pathway via the Ingenuity Pathway Analysis (LUC7L2, FTO and COX18). Thirty-six African American participants in the PEAR study, who provided good coverage across the genotype groups of the top SNPs in the selected genes, were chosen for the analysis. Whole-blood samples taken before and after HCTZ treatment, as either monotherapy or add-on therapy, were used for analysis. RNA was isolated from whole-blood samples using the PAXgene Blood RNA Kit IVD (Qiagen, Valencia, CA, USA). Isolated RNA samples were then converted to cDNA. Gene expression levels were measured using Taqman Gene Expression Assays and the Taqman 7900 Real Time PCR system (Applied Biosystems, Foster City, CA, USA). Target gene expression levels were normalized to the reference gene β-2-microglobulin. The 2−ΔΔCt method was used to assess relative gene expression differences before and after HCTZ treatment based upon SNP genotypes [30]. Relative expression levels of LUC7L2, FTO and COX18 were compared before and after treatment within genotype group using the signed rank test, and compared between genotype groups before and after HCTZ treatment using the Kruskal-Wallis test. A P-value <0.05 was considered significant.
Results
Baseline characteristics
Baseline characteristics of the participants in the PEAR study are shown in Table 1. Most baseline characteristics including race were similar between the two treatment arms. Among African Americans, the change in UA observed during HCTZ exposure was 1.1 ± 1.0 mg/dL in the HCTZ monotherapy arm and 1.1 ± 0.9 mg/dL in the HCTZ add-on therapy arm. For Caucasians, the corresponding changes in UA were 0.9 ± 0.9 and 0.7 ± 0.8 mg/dL following HCTZ monotherapy and HCTZ add-on therapy. Approximately 24% of participants were hyperuricaemic at baseline.
Table 1.
Baseline characteristics in the PEAR study
| Characteristic | HCTZ monotherapy (n = 381) | HCTZ add-on therapy (n = 387) |
|---|---|---|
| Age (years) | 48.9 ± 9.3 | 48.7 ± 9.2 |
| Women | 188 (49.3) | 217 (56.1) |
| Caucasians | 233 (61.2) | 240 (62.0) |
| African Americans | 148 (38.9) | 147 (38.0) |
| Duration of hypertension (years) | 6.4 ± 7.3 | 6.8 ± 7.1 |
| Family history of hypertension | 286 (75.1) | 300 (77.5) |
| BMI (kg/m2) | 30.8 ± 5.1 | 30.8 ± 5.9 |
| Smoker (ever) | 144 (37.8) | 147 (38.0) |
| SBP (mmHg) | 146.6 ± 10.6 | 145.0 ± 9.9 |
| DBP (mmHg) | 94.2 ± 6.0 | 93.3 ± 5.9 |
| Heart rate (beats/min) | 77.2 ± 9.5 | 77.8 ± 9.4 |
| Uric acid (mg/dL) | ||
| Caucasians | 5.9 ± 1.9 | 5.6 ± 1.4 |
| African Americans | 5.5 ± 1.5 | 5.4 ± 1.4 |
| Hyperuricaemic at study entry | ||
| Caucasians | 63 (27.8) | 44 (18.9) |
| African Americans | 36 (24.3) | 37 (25.2) |
Data presented as mean ± standard deviation, or n (%).
HCTZ, hydrochlorothiazide; BMI, body mass index; SBP, systolic blood pressure; DBP, diastolic blood pressure.
GWAS
No SNPs reached genome-wide significance for either the OmniQuad chip or HumanCVD chip, in either race group. However, both chips revealed potentially interesting signals. From the HumanCVD chip, 26 SNPs across 20 chromosomal regions in African Americans and 20 SNPs across 14 chromosomal regions in Caucasians were identified as suggestive, based on predefined suggestive P-values. Data from the OmniQuad chip revealed an additional 225 SNPs across 86 chromosomal regions in African Americans and 152 SNPs across 43 chromosomal regions in Caucasians (Supplemental Figs 1–4). All suggestive SNPs were tested for replication in a separate cohort of participants in the PEAR study of the same race receiving HCTZ as add-on therapy. After confirmation, suggestive SNPs remained in five gene regions (PARD3B, PADI4, LUC7L2, COX18 and FTO) in African Americans and one region in Caucasians (GRIN3A) (Table 2). Multiple SNPs in high LD were observed in the LUC7L2 and COX18 regions in African Americans. Finally, a meta-analysis of the HCTZ monotherapy and add-on therapy cohorts was conducted for all SNPs that met our replication criteria (Table 2). In the meta-analysis, rs6947309 in LUC7L2 approached genome-wide significance in African Americans (P = 7.18×10⁻⁸, Table 2).
Table 2.
HCTZ-induced elevations in UA by genotype
| Gene | SNP | MAF | Genotype | HCTZ monotherapy (discovery) | HCTZ add-on therapy (replication) | Meta-analysis | ||
|---|---|---|---|---|---|---|---|---|
|
| ||||||||
| Mean ΔUA ± SE (mg/dL) | P-value | Mean ΔUA ± SE (mg/dL) | P-value | P-value | ||||
| African Americans | ||||||||
| LUC7L2 | rs6947309 | 0.24 | C/C | 0.05 ± 0.28 | 2.46E-05 | 0.55 ± 0.29 | 6.08E-04 | 7.18E-08 |
| C/T | 0.91 ± 0.13 | 0.89 ± 0.13 | ||||||
| T/T | 1.36 ± 0.11 | 1.34 ± 0.11 | ||||||
| PADI4 | rs2477134 | 0.42 | T/T | 0.66 ± 0.13 | 2.55E-05 | 0.86 ± 0.14 | 4.37E-02 | 6.91E-06 |
| G/T | 1.35 ± 0.11 | 1.28 ± 0.12 | ||||||
| G/G | 1.57 ± 0.20 | 1.23 ± 0.25 | ||||||
| PARD3B | rs236829 | 0.38 | C/C | 0.78 ± 0.12 | 6.03E-05 | 0.92 ± 0.12 | 2.17E-02 | 7.67E-06 |
| T/C | 1.15 ± 0.12 | 1.21 ± 0.14 | ||||||
| T/T | 1.77 ± 0.22 | 1.47 ± 0.21 | ||||||
| COX18 | rs16849146 | 0.42 | T/T | 0.80 ± 0.12 | 3.18E-05 | 0.83 ± 0.11 | 4.81E-02 | 9.81E-06 |
| C/T | 1.12 ± 0.13 | 1.20 ± 0.13 | ||||||
| C/C | 1.76 ± 0.18 | 1.40 ± 0.22 | ||||||
| FTO | rs4784333* | 0.43 | G/G | 0.84 ± 0.15 | 3.56E-04 | 0.90 ± 0.17 | 2.62E-02 | 4.19E-05 |
| C/G | 1.13 ± 0.13 | 1.17 ± 0.11 | ||||||
| C/C | 1.52 ± 0.16 | 1.49 ± 0.22 | ||||||
| Caucasians | ||||||||
| GRIN3A | rs1418243 | 0.08 | G/G | 0.86 ± 0.06 | 8.97E-05 | 0.72 ± 0.07 | 3.79E-02 | 3.91E-05 |
| A/G | 1.43 ± 0.19 | 0.76 ± 0.13 | ||||||
| A/A | 2.40 | 1.72 ± 0.59 | ||||||
rs4784333 was identified from the HumanCVD chip; all other SNPs were identified from the OmniQuad chip.
HCTZ, hydrochlorothiazide; MAF, minor allele frequency; UA, uric acid.
Elevations in UA and risk of new-onset hyperuricaemia
For each suggestive SNP, the change in UA following HCTZ treatment by genotype was assessed. Additionally, each risk allele was assessed for the likelihood of developing new-onset clinical hyperuricaemia following HCTZ exposure. After HCTZ monotherapy, UA elevations of 1.4 to 1.8 mg/dL were observed in African Americans who were homozygous for the risk alleles at the suggestive SNPs compared to those who were homozygous for the reference alleles with increases of 0.1 to 0.8 mg/dL (Table 2 and Fig. 1). Patients who were heterozygous displayed an intermediate phenotype. Similar results were observed in African Americans in the HCTZ add-on therapy cohort, with HCTZ-induced UA elevations between 0.4 and 0.8 mg/dL higher in patients homozygous for the risk alleles (Table 2 and Fig. 1). In African Americans, new-onset hyperuricaemia was significantly associated with SNPs in the PARD3B and LUC7L2 regions; there was also a trend towards a statistically significant association with SNPs located in the FTO and COX18 regions. In most cases, patients heterozygous for the risk allele displayed an intermediate phenotype (Fig. 2 and Supplemental Table 1). None of the top SNPs identified in this study had an effect on baseline UA (Supplemental Table 2).
Fig. 1.
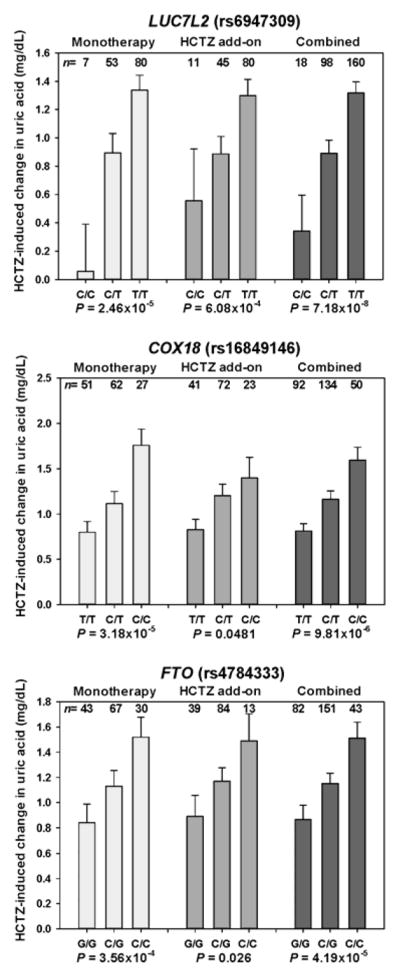
Rise in uric acid (UA) for the top three single-nucleotide polymorphisms (SNPs) in genes associated with metabolism or energy regulation. Hydrochlorothiazide (HCTZ)-induced elevations in UA are shown by genotype for the top three SNPs in genes associated with metabolism or cellular energy regulation. Data are shown for African Americans in the HCTZ monotherapy group and the HCTZ add-on therapy group, or for both treatments combined. The standard error is shown.
Fig. 2.

Increased risk of hyperuricaemia for the top three single-nucleotide polymorphisms (SNPs) in genes associated with metabolism or energy regulation. Risks of hydrochlorothiazide (HCTZ)-induced hyperuricaemia are shown by genotype for the top three SNPs in genes associated with metabolism or cellular energy regulation. Data are shown for African Americans in the HCTZ monotherapy group and the HCTZ add-on therapy group, combined. The standard error is shown. OR, odds ratio; CI, confidence interval.
HCTZ-induced UA elevation risk score in African Americans
Overall, traditional characteristics associated with baseline UA levels [1] were included in our univariate regression analysis and were not associated with HCTZ-induced elevations in UA in African Americans (Supplemental Table 3). Of the variables considered, only log duration of hypertension was significant with an r2-value of 0.0276. Based on the univariate analysis and a review of the literature, we created a linear regression model with baseline UA, age, gender and log duration of hypertension forced into the model. This model, including clinical variables, explained about 5% of the variability in UA elevation observed with HCTZ therapy in African Americans (Table 3, without genetic risk score model).
Table 3.
Model describing HCTZ-induced elevations in UA with and without a genetic risk score in African Americans
| Characteristic | Without genetic risk score | With genetic risk score | ||
|---|---|---|---|---|
| Parameter estimate | P-value | Parameter estimate | P-value | |
| Baseline UA | −0.035 | 0.5072 | −0.006 | 0.8998 |
| Age | 0.015 | 0.0799 | 0.008 | 0.2876 |
| Gender | 0.25 | 0.1316 | 0.153 | 0.3248 |
| Log duration of hypertension | 0.166 | 0.0241 | 0.133 | 0.0545 |
| Genetic risk score | n/a | n/a | 0.201 | 1.79E-07 |
| model P-value | 0.0162 | <0.0001 | ||
| model r2-value | 0.0524 | 0.1611 | ||
HCTZ, hydrochlorothiazide; UA, uric acid; n/a, not applicable.
To account for the potential genetic influence on UA response to HCTZ therapy in African Americans, a composite risk score was developed using the top SNP from each gene region identified in our study (LUC7L2, ANKRD17/COX18, FTO, PADI4 and PARD3B). Possible composite risk scores ranged from 0 to 10; the scores were normally distributed and the most common risk score was 5 (Supplemental Figs 5 and 6). The composite risk score was strongly associated with HCTZ-induced elevations in UA in African Americans (P = 1.79×10⁻⁷, Table 3), explaining an additional 11% of the variability, and thus increased the variability explained by the model to over 16% (Table 3).
Ingenuity Pathway Analysis
Next, the Ingenuity Pathway Analysis software was used to examine our top candidate genes to determine the potential physiological roles of these identified genes. Pathway analysis revealed putative connections between five of the genes identified in this study. It was predicted that COX18, ANKRD17, LUC7L2, FTO and C7orf55 are commonly regulated by specific microRNAs (Supplemental Fig. 7).
Gene expression analysis
To further examine the possible functional consequences of genetic variability in the top genes, we measured gene expression of LUC7L2, FTO and COX18 in 36 African American participants in the PEAR study (Supplemental Table 4). There was equal distribution among the selected participants receiving HCTZ either as monotherapy or as add-on therapy.
Subjects homozygous for the C allele at rs4784333 in FTO had expression levels ~2.5- to 3-fold higher than subjects with a G/C or G/G genotype at rs4784333 at baseline (P = 0.006, Fig. 3). This difference in expression between genotype group remained after treatment with HCTZ (P = 0.0174, data not shown). There was no drug effect observed within genotype groups with FTO expression (data not shown). Additionally, there were no differences in baseline expression of LUC7L2 or COX18 between genotype groups, and no drug effect within genotype groups (data not shown).
Fig. 3.

Baseline relative expression of FTO by rs4784333 genotype in 36 African American subjects in the PEAR study. Expression levels are normalized relative to β-2-microglobulin. The standard error is shown.
Discussion
To our knowledge, this study is the first pharmacogenomic analysis of HCTZ-induced elevations in UA and the associated clinical hyperuricaemia. We have identified several novel gene regions (LUC7L2, COX18/ANKRD17, FTO, PADI4 and PARD3B) associated with HCTZ-induced UA elevations in African Americans and one region (GRIN3A) in Caucasians. Increased risk of developing clinical hyperuricaemia was significantly associated with SNPs in LUC7L2 and PARD3B. Several additional genes showed statistically significant trends towards hyperuricaemia in response to HCTZ therapy. A composite risk score based on the number of risk alleles present was also predictive of HCTZ-induced UA elevations in African Americans, in contrast to models based solely on clinical factors. Pathway-based analyses revealed that many of the genes identified in African Americans in this study may share common regulatory pathways. Finally, gene expression analysis showed that baseline expression levels of FTO are significantly different according to rs4784333 genotype.
The most significant SNP identified was rs6947309 in LUC7L2. LUC7L2 is located on chromosome 7 and is thought to play a role in RNA splicing [31]. There is a large LD block throughout the LUC7L2 region, and several additional significant SNPs within this region were in high LD with rs6947309. Within this LD block, the identified SNPs may be tagging two possible functional polymorphisms. Immediately 5-prime of LUC7L2 is the gene C7orf55. rs10265 is a non-synonymous (Ser8Ala) SNP located in C7orf55 that is in high LD with rs6947309. Although in silico predictions suggest that this is a benign mutation, no experimental data presently exist regarding the function of C7orf55 or the effect of rs10265. A putative transcript AC083883.1-201, located within an intron of LUC7L2, has been reported by the 1000 Genomes Project. Within this putative transcript, rs4732371 is in LD with rs6947309, an SNP that causes a premature stop codon. If this transcript is confirmed to have a protein product, rs6947309 is another possible functional polymorphism.
Two other genes, COX18 and FTO, were also among the top genes identified in this study and are associated with aspects of energy regulation and metabolism. COX18 is located on chromosome 4 and is required for insertion of proteins into the inner mitochondrial membrane [32]. FTO encodes a DNA demethylase [33] that has been previously associated with obesity [34], type 2 diabetes [35] and osteoporosis [36]. FTO SNPs previously associated with diabetes or obesity are located within the first intron of the gene. By contrast, rs4784333, which was identified in this study, is located in the eighth intron and is not in LD with previously identified SNPs. This finding suggests that UA should be added to the list of metabolic effects that FTO may influence.
Three additional genes were also identified in this study. ANKRD17 is located on chromosome 4, immediately 5-prime of COX18 and may play a role in liver [37] and cardiovascular [38] development as well as in cell cycle regulation [39]. The SNPs identified in ANKRD17 were in high LD with those in COX18, so it is possible that the SNPs in one gene are simply tagging the SNPs in the other gene. PADI4 is located on chromosome 1, is involved in protein citrullination [40] and polymorphisms in PADI4 have been associated with rheumatoid arthritis [41]. PARD3B is located on chromosome 2 and is involved in regulating epithelial cell polarity [42]. Polymorphisms in PARD3B have been associated with type 2 diabetes [43].
Pathway analysis revealed previously unknown connections between some of the genes identified in this study. COX18, ANKRD17, LUC7L2, FTO and C7orf55 were predicted to be commonly regulated by specific microRNAs. Several of these genes are known to be involved in regulation of metabolism and cellular energy. These connections suggest that the other genes and microRNAs identified may also have a role in these processes. Pathway analysis revealed that PADI4 and PARD3B were not included in this regulatory network, which suggests that they may act to elevate UA through different mechanisms. Applying this pathway analysis approach has generated a variety of interesting hypotheses that will require further functional testing to validate.
Gene expression analysis showed that there are baseline differences in FTO expression by rs4784333 genotype, with those subjects having the highest expression levels also having the largest increases in UA in response to HCTZ therapy. No differences in expression levels were observed in response to HCTZ treatment, and no differences in baseline expression or in response to HCTZ treatment were found for COX18 and LUC7L2. However, it is possible that these differences may exist in a tissue more relevant to our phenotype (i.e. kidney).
Clinical factors that strongly influence baseline UA levels are well known and may contribute to an increased risk of gout [1]. However, these factors had very little influence on UA elevation in response to HCTZ exposure in African Americans. Furthermore, none of the top SNPs identified in this study had an effect on baseline UA in either race group. When a risk score, based on the number of UA elevating risk alleles present, was added to the model, the risk score was significant for HCTZ-induced UA elevation in African Americans, and was more predictive than any of the individual SNPs. As the number of risk alleles present increased, the degree of HCTZ-induced UA elevation observed also increased. This suggests that the UA response to HCTZ treatment in African Americans has a strong pharmacogenomic influence and is affected by multiple loci.
This study has several limitations. First, none of the top SNPs reached Bonferroni-corrected statistical significance. However, we endeavoured to employ a stringent analysis strategy that required SNPs to achieve suggestive significance in the HCTZ monotherapy cohorts, and show evidence of replication in the add-on therapy cohorts. Furthermore, we also conducted meta-analyses of mono- and add-on therapy which increased the power of the study and improved the statistical significance of all the top genes identified, with rs6947309 almost achieving genome-wide significance. Secondly, most of our findings were limited to individuals of African American descent and were not replicated in Caucasians. Because our sample size was larger for Caucasians, this could imply a stronger pharmacogenomic effect in African Americans for thiazide-induced increases in UA. Failure to show replication of specific SNPs between African Americans and Caucasians is not surprising, however, given differences in LD between individuals of African and of European ancestry. It is therefore possible that the genes identified in African Americans may also affect UA response to HCTZ treatment in Caucasians, and that we have not identified the functional variants. Additionally, the genetic risk score should ideally be tested in an independent cohort (i.e. not in the cohort in which the genetic risk score was derived); nonetheless the data we present provide evidence for the potential benefits of such an approach. Finally, another weakness of this study is that we did not investigate any correlation between the presence or absence of our genetic risk score and clinical outcomes such as gout. However, given that the differences in individuals homozygous for the alleles associated with elevated risk versus those lacking these alleles amounted to at least 1.0 mg/dL uric acid, it is likely that this translates into increased risk of gout, and possibly of cardiovascular events.
In conclusion, we identified five novel gene regions associated with HCTZ-induced UA elevations in African Americans (LUC7L2, COX18/ANKRD17, FTO, PADI4 and PARD3B) and one region in Caucasians (GRIN3A). Additional replication and functional studies will be needed to confirm these findings and to elucidate the physiological mechanisms by which these genes may affect UA levels in African Americans and Caucasians following HCTZ exposure.
Supplementary Material
Acknowledgments
Funding
PEAR was supported by the NIH Pharmacogenetics Research Network grant U01-GM074492 and the National Center for Advancing Translational Sciences, award numbers UL1 TR000064 (University of Florida), UL1 TR000454 (Emory University) and UL1 TR000135 (Mayo Clinic), and funds from the Mayo Foundation. This research was also supported by NIH grant K23 HL091120 (ALB).
We thank and acknowledge the contributions of the PEAR study participants, support staff and the study physicians R. Whit Curry, Karen Hall, Frederic Rabari-Oskoui, Dan Rubin and Siegfried Schmidt.
Abbreviation List
- BMI
Body Mass Index
- BP
Blood Pressure
- DBP
Diastolic Blood Pressure
- GWAS
Genome-wide Association Study
- HCTZ
Hydrochlorothiazide
- LD
Linkage Disequilibrium
- MAF
Minor Allele Frequency
- PEAR
Pharmacogenomic Evaluation of Antihypertensive Responses
- PCA
Principal Component Analysis
- SNP
Single Nucleotide Polymorphism
- UA
Uric Acid
Footnotes
Conflict of interest statement
AGV, CWM, YG, TYL, AML and KRB declare no conflicts of interest. RMC-D, ALB, ABC, JGG, EB, RJJ, STT and JAJ received funding from the National Institutes of Health (NIH). RMC-D also received funding from Women’s Health Initiative. JGG received funding from Janssen Pharmaceuticals, Inc., has a Speakers’ Bureau appointment for Boehringer-Ingelheim and is a consultant for Forest Pharmaceuticals and Boehringer-Ingelheim. EB received honoraria from the Foundation of Rome. RJJ has been granted patents related to lowering UA as a means to treating blood pressure (with the University of Washington) and insulin resistance (with the University of Florida) and has also submitted patent applications related to UA and fructose metabolism. These patents have been tentatively licensed by XORT therapeutics. He is also on the Scientific Board of Amway and has grants from the NIH, Amway and Danone. In addition, RJJ has written two lay books on fructose and UA (The Sugar Fix, Rodale, 2008; and The Fat Switch, mercola.com, 2012).
References
- 1.Zhu Y, Pandya BJ, Choi HK. Prevalence of gout and hyperuricemia in the US general population: the National Health and Nutrition Examination Survey 2007–2008. Arthritis Rheum. 2011;63:3136–41. doi: 10.1002/art.30520. [DOI] [PubMed] [Google Scholar]
- 2.Krishnan E, Kwoh CK, Schumacher HR, Kuller L. Hyperuricemia and incidence of hypertension among men without metabolic syndrome. Hypertension. 2007;49:298–303. doi: 10.1161/01.HYP.0000254480.64564.b6. [DOI] [PubMed] [Google Scholar]
- 3.Mellen PB, Bleyer AJ, Erlinger TP, et al. Serum uric acid predicts incident hypertension in a biethnic cohort: the atherosclerosis risk in communities study. Hypertension. 2006;48:1037–42. doi: 10.1161/01.HYP.0000249768.26560.66. [DOI] [PubMed] [Google Scholar]
- 4.Choi HK, De Vera MA, Krishnan E. Gout and the risk of type 2 diabetes among men with a high cardiovascular risk profile. Rheumatology (Oxford) 2008;47:1567–70. doi: 10.1093/rheumatology/ken305. [DOI] [PubMed] [Google Scholar]
- 5.Facchini F, Chen YD, Hollenbeck CB, Reaven GM. Relationship between resistance to insulin-mediated glucose uptake, urinary uric acid clearance, and plasma uric acid concentration. JAMA. 1991;266:3008–11. [PubMed] [Google Scholar]
- 6.Masuo K, Kawaguchi H, Mikami H, Ogihara T, Tuck ML. Serum uric acid and plasma norepinephrine concentrations predict subsequent weight gain and blood pressure elevation. Hypertension. 2003;42:474–80. doi: 10.1161/01.HYP.0000091371.53502.D3. [DOI] [PubMed] [Google Scholar]
- 7.Choi HK, Ford ES. Prevalence of the metabolic syndrome in individuals with hyperuricemia. American Journal of Medicine. 2007;120:442–7. doi: 10.1016/j.amjmed.2006.06.040. [DOI] [PubMed] [Google Scholar]
- 8.Tuttle KR, Short RA, Johnson RJ. Sex differences in uric acid and risk factors for coronary artery disease. Am J Cardiol. 2001;87:1411–4. doi: 10.1016/s0002-9149(01)01566-1. [DOI] [PubMed] [Google Scholar]
- 9.Mazzali M, Hughes J, Kim YG, et al. Elevated uric acid increases blood pressure in the rat by a novel crystal-independent mechanism. Hypertension. 2001;38:1101–6. doi: 10.1161/hy1101.092839. [DOI] [PubMed] [Google Scholar]
- 10.Nakagawa T, Hu H, Zharikov S, et al. A causal role for uric acid in fructose-induced metabolic syndrome. Am J Physiol Renal Physiol. 2006;290:F625–31. doi: 10.1152/ajprenal.00140.2005. [DOI] [PubMed] [Google Scholar]
- 11.Feig DI, Soletsky B, Johnson RJ. Effect of allopurinol on blood pressure of adolescents with newly diagnosed essential hypertension: a randomized trial. JAMA. 2008;300:924–32. doi: 10.1001/jama.300.8.924. [DOI] [PMC free article] [PubMed] [Google Scholar]
- 12.Sautin YY, Johnson RJ. Uric acid: the oxidant-antioxidant paradox. Nucleosides Nucleotides Nucleic Acids. 2008;27:608–19. doi: 10.1080/15257770802138558. [DOI] [PMC free article] [PubMed] [Google Scholar]
- 13.Sica DA. Diuretic-related side effects: development and treatment. J Clin Hypertens (Greenwich) 2004;6:532–40. doi: 10.1111/j.1524-6175.2004.03789.x. [DOI] [PMC free article] [PubMed] [Google Scholar]
- 14.2010 Top 200 generic drugs by total prescriptions. Drug Topics. 2011 [Google Scholar]
- 15.Nakanishi N, Okamoto M, Yoshida H, Matsuo Y, Suzuki K, Tatara K. Serum uric acid and risk for development of hypertension and impaired fasting glucose or Type II diabetes in Japanese male office workers. European journal of epidemiology. 2003;18:523–30. doi: 10.1023/a:1024600905574. [DOI] [PubMed] [Google Scholar]
- 16.Reungjui S, Roncal CA, Mu W, Srinivas TR, Sirivongs D, Johnson RJ, Nakagawa T. Thiazide diuretics exacerbate fructose-induced metabolic syndrome. J Am Soc Nephrol. 2007;18:2724–31. doi: 10.1681/ASN.2007040416. [DOI] [PubMed] [Google Scholar]
- 17.Steele TH, Oppenheimer S. Factors affecting urate excretion following diuretic administration in man. American Journal of Medicine. 1969;47:564–74. doi: 10.1016/0002-9343(69)90187-9. [DOI] [PubMed] [Google Scholar]
- 18.El-Sheikh AA, van den Heuvel JJ, Koenderink JB, Russel FG. Effect of hypouricaemic and hyperuricaemic drugs on the renal urate efflux transporter, multidrug resistance protein 4. Br J Pharmacol. 2008;155:1066–75. doi: 10.1038/bjp.2008.343. [DOI] [PMC free article] [PubMed] [Google Scholar]
- 19.Hagos Y, Stein D, Ugele B, Burckhardt G, Bahn A. Human renal organic anion transporter 4 operates as an asymmetric urate transporter. J Am Soc Nephrol. 2007;18:430–9. doi: 10.1681/ASN.2006040415. [DOI] [PubMed] [Google Scholar]
- 20.Emmerson BT, Nagel SL, Duffy DL, Martin NG. Genetic control of the renal clearance of urate: a study of twins. Ann Rheum Dis. 1992;51:375–7. doi: 10.1136/ard.51.3.375. [DOI] [PMC free article] [PubMed] [Google Scholar]
- 21.Wilk JB, Djousse L, Borecki I, et al. Segregation analysis of serum uric acid in the NHLBI Family Heart Study. Hum Genet. 2000;106:355–9. doi: 10.1007/s004390000243. [DOI] [PubMed] [Google Scholar]
- 22.Vitart V, Rudan I, Hayward C, et al. SLC2A9 is a newly identified urate transporter influencing serum urate concentration, urate excretion and gout. Nat Genet. 2008;40:437–42. doi: 10.1038/ng.106. [DOI] [PubMed] [Google Scholar]
- 23.Dehghan A, Kottgen A, Yang Q, et al. Association of three genetic loci with uric acid concentration and risk of gout: a genome-wide association study. Lancet. 2008;372:1953–61. doi: 10.1016/S0140-6736(08)61343-4. [DOI] [PMC free article] [PubMed] [Google Scholar]
- 24.Kolz M, Johnson T, Sanna S, et al. Meta-analysis of 28,141 individuals identifies common variants within five new loci that influence uric acid concentrations. PLoS Genet. 2009;5:e1000504. doi: 10.1371/journal.pgen.1000504. [DOI] [PMC free article] [PubMed] [Google Scholar]
- 25.Fan AZ, Yesupriya A, Chang MH, et al. Gene polymorphisms in association with emerging cardiovascular risk markers in adult women. BMC Med Genet. 2010;11:6. doi: 10.1186/1471-2350-11-6. [DOI] [PMC free article] [PubMed] [Google Scholar]
- 26.Johnson JA, Boerwinkle E, Zineh I, et al. Pharmacogenomics of antihypertensive drugs: rationale and design of the Pharmacogenomic Evaluation of Antihypertensive Responses (PEAR) study. Am Heart J. 2009;157:442–9. doi: 10.1016/j.ahj.2008.11.018. [DOI] [PMC free article] [PubMed] [Google Scholar]
- 27.Purcell S, Neale B, Todd-Brown K, et al. PLINK: a tool set for whole-genome association and population-based linkage analyses. Am J Hum Genet. 2007;81:559–75. doi: 10.1086/519795. [DOI] [PMC free article] [PubMed] [Google Scholar]
- 28.Price AL, Patterson NJ, Plenge RM, Weinblatt ME, Shadick NA, Reich D. Principal components analysis corrects for stratification in genome-wide association studies. Nat Genet. 2006;38:904–9. doi: 10.1038/ng1847. [DOI] [PubMed] [Google Scholar]
- 29.Willer CJ, Li Y, Abecasis GR. METAL: fast and efficient meta-analysis of genomewide association scans. Bioinformatics. 2010;26:2190–1. doi: 10.1093/bioinformatics/btq340. [DOI] [PMC free article] [PubMed] [Google Scholar]
- 30.Livak KJ, Schmittgen TD. Analysis of relative gene expression data using real-time quantitative PCR and the 2(-Delta Delta C(T)) Method. Methods. 2001;25:402–8. doi: 10.1006/meth.2001.1262. [DOI] [PubMed] [Google Scholar]
- 31.Howell VM, Jones JM, Bergren SK, Li L, Billi AC, Avenarius MR, Meisler MH. Evidence for a direct role of the disease modifier SCNM1 in splicing. Human Molecular Genetics. 2007;16:2506–16. doi: 10.1093/hmg/ddm206. [DOI] [PubMed] [Google Scholar]
- 32.Sacconi S, Trevisson E, Pistollato F, et al. hCOX18 and hCOX19: two human genes involved in cytochrome c oxidase assembly. Biochem Biophys Res Commun. 2005;337:832–9. doi: 10.1016/j.bbrc.2005.09.127. [DOI] [PubMed] [Google Scholar]
- 33.Gerken T, Girard CA, Tung YC, et al. The obesity-associated FTO gene encodes a 2-oxoglutarate-dependent nucleic acid demethylase. Science. 2007;318:1469–72. doi: 10.1126/science.1151710. [DOI] [PMC free article] [PubMed] [Google Scholar]
- 34.Frayling TM, Timpson NJ, Weedon MN, et al. A common variant in the FTO gene is associated with body mass index and predisposes to childhood and adult obesity. Science. 2007;316:889–94. doi: 10.1126/science.1141634. [DOI] [PMC free article] [PubMed] [Google Scholar]
- 35.Scott LJ, Mohlke KL, Bonnycastle LL, et al. A genome-wide association study of type 2 diabetes in Finns detects multiple susceptibility variants. Science. 2007;316:1341–5. doi: 10.1126/science.1142382. [DOI] [PMC free article] [PubMed] [Google Scholar]
- 36.Guo Y, Liu H, Yang TL, et al. The fat mass and obesity associated gene, FTO, is also associated with osteoporosis phenotypes. PLoS One. 2011;6:e27312. doi: 10.1371/journal.pone.0027312. [DOI] [PMC free article] [PubMed] [Google Scholar]
- 37.Watt AJ, Jones EA, Ure JM, Peddie D, Wilson DI, Forrester LM. A gene trap integration provides an early in situ marker for hepatic specification of the foregut endoderm. Mech Dev. 2001;100:205–15. doi: 10.1016/s0925-4773(00)00530-x. [DOI] [PubMed] [Google Scholar]
- 38.Hou SC, Chan LW, Chou YC, et al. Ankrd17, an ubiquitously expressed ankyrin factor, is essential for the vascular integrity during embryogenesis. FEBS Lett. 2009;583:2765–71. doi: 10.1016/j.febslet.2009.07.025. [DOI] [PubMed] [Google Scholar]
- 39.Deng M, Li F, Ballif BA, Li S, Chen X, Guo L, Ye X. Identification and functional analysis of a novel cyclin e/cdk2 substrate ankrd17. J Biol Chem. 2009;284:7875–88. doi: 10.1074/jbc.M807827200. [DOI] [PMC free article] [PubMed] [Google Scholar]
- 40.Tanikawa C, Espinosa M, Suzuki A, et al. Regulation of histone modification and chromatin structure by the p53-PADI4 pathway. Nat Commun. 2012;3:676. doi: 10.1038/ncomms1676. [DOI] [PubMed] [Google Scholar]
- 41.Hou S, Gao GP, Zhang XJ, et al. PADI4 polymorphisms and susceptibility to rheumatoid arthritis: a meta-analysis. Mod Rheumatol. 2012 doi: 10.1007/s10165-012-0639-4. [DOI] [PubMed] [Google Scholar]
- 42.Izaki T, Kamakura S, Kohjima M, Sumimoto H. Phosphorylation-dependent binding of 14-3-3 to Par3beta, a human Par3-related cell polarity protein. Biochem Biophys Res Commun. 2005;329:211–8. doi: 10.1016/j.bbrc.2005.01.115. [DOI] [PubMed] [Google Scholar]
- 43.Below JE, Gamazon ER, Morrison JV, et al. Genome-wide association and meta-analysis in populations from Starr County, Texas, and Mexico City identify type 2 diabetes susceptibility loci and enrichment for expression quantitative trait loci in top signals. Diabetologia. 2011;54:2047–55. doi: 10.1007/s00125-011-2188-3. [DOI] [PMC free article] [PubMed] [Google Scholar]
Associated Data
This section collects any data citations, data availability statements, or supplementary materials included in this article.