

Abstract
iNKT cells are a particular lymphocyte population with potent immunomodulatory capacity; by promoting or suppressing immune responses against infections, tumors, and autoimmunity, iNKT cells are a promising target for immunotherapy. The hallmark of iNKT cells is the expression of a semiinvariant TCR (with an invariant α-chain comprising AV14 and AJ18 gene segments), which recognizes glycolipids presented by CD1d. Here, we identified iNKT cells for the first time in the rat using rat CD1d-dimers and PLZF staining. Importantly, in terms of frequencies (1.05% ± 0.52 SD of all intrahepatic αβ T cells), coreceptor expression and in vitro expansion features, iNKT cells from F344 inbred rats more closely resemble human iNKT cells than their mouse counterparts. In contrast, in LEW inbred rats, which are often used as models for organ-specific autoimmune diseases, iNKT cell numbers are near or below the detection limit. Interestingly, the usage of members of the rat AV14 gene family differed between F344 and LEW inbred rats. In conclusion, the similarities between F344 rat and human iNKT cells and the nearly absent iNKT cells in LEW rats make the rat a promising animal model for the study of iNKT cell-based therapies and of iNKT-cell biology.
Keywords: Animal models, Cellular immunology, CD1 molecules, NKT cells, TCR
Introduction
iNKT cells (also known as type I NKT cells) are a distinct subset of T lymphocytes sharing features of innate and adaptive lymphocytes. They express TCRs comprising an invariant α-chain created by lineage-defining rearrangements of AV14 (TRAV14, Vα14) and AJ18 (TRAV18, Jα18) gene segments in mice and by their homologues AV24 (TRAV24, Vα24) and AJ18 (TRAV18, Jα18) in humans and a number of other mammalian species [1,2]. (Mouse AV14 and human AV24 correspond to TRAV11 in the WHO/IMGT nomenclature.) This rearrangement is further characterized by a VJ gene segment transition of uniform length, which contains a germ line-encoded amino acid at position 93 (glycine in mice and serine in humans) in most instances [3,4]. The CDR3s of the β-chain are highly variable but the BV (Vβ) gene segments used are mainly BV8S2, BV7, and BV2 in mouse and BV11 in human (homologue to mouse BV8S2) [1]. Most but not all iNKT cells express NKR-P1C (also known as NK1.1) in mice and NKR-P1A (CD161) in humans. Nonetheless in humans, only a minor fraction of all NKR-P1A+ αβ T cells are iNKT cells [1,5]. Mouse iNKT cells are CD4+ or CD4 and CD8 double negative (DN) whereas human iNKT cells are DN, CD4+, and CD8α+ [5, 6]. iNKT cells home to particular tissues such as the liver, constituting up to 30% of all intrahepatic lymphocytes (IHLs) in certain mouse-inbred strains such as C57BL/6 [1]. In humans however, the frequencies are much more reduced (about 0.5% of all CD3+ cells in the liver) and vary considerably between individuals [1,7].
In contrast to most αβ T cells, which recognize peptides presented by MHC molecules, the semi-invariant TCR of iNKT cells is specific for lipid antigens presented by CD1d, a nonpolymorphic MHC class I-like molecule [1]. The first and still one of the strongest antigens identified is KRN7000 (commonly referred to as α-Galactosylceramide (α-GalCer)), which is a synthetic derivate of a compound isolated from the marine sponge Agelas mauritanus [1]. Importantly, iNKT cells can be unequivocally identified using α-GalCer-loaded CD1d oligomers, distinguishing them for example from non-iNKT T cells, which express NKR-P1 [5].
iNKT cells rapidly secrete large amounts of many different cytokines after activation and a significant fraction of them even simultaneously produces the Th1 and Th2 signature cytokines IFN-y and IL-4 [1]. Largely due to the effects of their secreted cytokines on other cells, iNKT cells greatly influence the immune system. Studies in mice and clinical observations in humans have shown iNKT cells to suppress or promote autoimmunity as well as responses against infections and tumors, making iNKT cells a promising target for immunotherapy. Nevertheless, there is still much to be learned about how iNKT-cell stimulation results in such different outcomes.
Genetic as well as functional studies have indicated the existence of iNKT cells in the rat but the direct identification of these cells has thus far been lacking. Rats have one CD1d, two BV8S2 (BV8S2 and BV8S4), various AV14, and one AJ18 homologues and the typical AV14AJ18 rearrangements [8–10]. The presence of an AV14 gene family with up to ten highly similar members is a particularity of rats not found in humans or mice [9, 11, 12]. Rat AV14 gene segments have been grouped into type 1 and type 2 based on characteristics of their CDR2 and have been reported to be distributed, to some extent, in an organ-specific manner [9]. At the functional level, rat splenocytes and IHLs have been shown to secrete IFN-γ and IL-4 in response to stimulation with α-GalCer [12, 13] in a CD1d-dependent fashion ([13] and this study).
α-GalCer-loaded mouse or human CD1d tetramers bind very poorly to the rat iNKT-TCR [12] (Monzon-Casanova, Herrmann, unpublished data). This is in contrast to the mouse and the human, both of which show CD1d/iNKT-TCR cross-species reactivity [1], but it explains why a discrete population was not observed among rat IHLs using mouse CD1d tetramers [12]. Furthermore, former attempts to identify rat iNKT cells using surrogate markers have also failed as no cell population has yet been found with the features predicted for iNKT cells based on their mouse counterparts. Instead, rat NKR-P1A/B-positive T cells are found in the spleen and the liver at similar frequencies, show no BV8S2 or BV8S4 bias, produce IFN-γ but not IL-4, and most of them express CD8β [9, 12, 14–16].
In the present study, newly generated rat CD1d dimers allowed us to identify rat iNKT cells for the first time in the F344 inbred rat strain. Importantly, these cells are more similar to human than mouse iNKT cells in terms of frequencies, CD8 expression, and expansion upon in vitro stimulation with α-GalCer. In addition, we found a nearly complete lack of iNKT cells in the widely used LEW rat strain. These findings identify the rat as a closely matching animal model to study the biology and the therapeutic use of iNKT cells in humans.
Results
Identification of rat iNKT cells
The negligible binding of rat iNKT-TCR to α-GalCer-loaded mouse CD1d tetramers [14] prompted us to generate syngeneic CD1d dimers. Rat and mouse CD1d dimers were loaded with α-GalCer or vehicle only (DMSO) as a control and were used to stain IHLs derived from F344 rats and from C57BL/6 mice (Fig. 1). Rat α-GalCer-CD1d dimers bound to a small but distinct population of F344 IHLs, which was missing when rat vehicle-CD1d dimers were used. As expected, very few rat cells were stained by mouse α-GalCer-CD1d dimers (when comparing with the vehicle control), but in contrast, a subpopulation of mouse iNKT cells was stained with rat α-GalCer-CD1d dimers. These results are consistent with our previous functional data [12].
Figure 1.
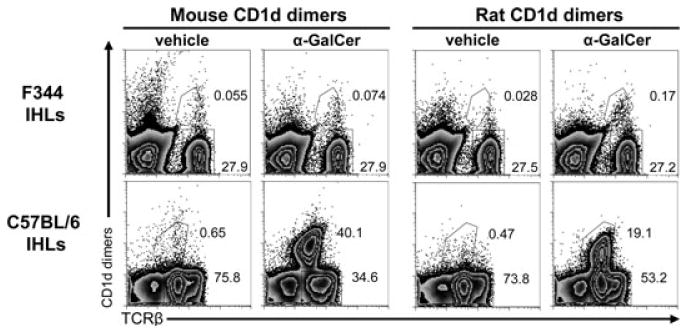
Identification of rat iNKT cells. IHLs derived from F344 inbred rats or C57BL/6 inbred mice were analyzed by flow cytometry using rat and mouse CD1d dimers loaded with α-GalCer or vehicle as control. Rat and mouse TCRβ expression was also analyzed. The secondary DαM Ab used to visualize the bound dimers also stained mouse IgG-positive B cells, thus these cells were excluded in the analysis of mouse IHLs by gating out CD19+ cells, which were 23% of all IHLs. Numbers indicate the percentages of the gated cells. The data shown are representative of three independent experiments.
The differences between the iNKT-cell frequencies of C57BL/6 mice and F344 rats are noteworthy. In C57BL/6 mice, more than 50% of all αβ T cells in the liver (30% of total IHLs) were detected with mouse α-GalCer-CD1d dimers, while in F344 rats, iNKT cells constituted only 1.05% of all αβ T cells (0.24% of total IHLs; Fig. 1 and Supporting Information Table 1). In both species positive α-GalCer-CD1d-dimer-stained T cells expressed low TCR levels, a feature of iNKT cells.
Phenotypic characterization of rat iNKT cells
In line with the particular homing preferences of iNKT cells, more iNKT cells were found in the liver (0.24%) as compared with what was found in the spleen (0.013%) of F344 inbred rats (Fig. 2A and Supporting Information Table 1). Importantly, these frequencies are very similar to those of humans [7]. Since there was some degree of nonspecific staining with the vehicle-CD1d dimers, a control staining with vehicle-CD1d dimers was always carried out in parallel to each α-GalCer-dimer staining. The calculation of the final frequencies, including the phenotypic characterization, was carried out by subtracting the event numbers obtained with the vehicle-CD1d dimers from the event numbers obtained with α-GalCer-CD1d dimers. Results obtained with groups of three to ten individual animals are summarized in Table 1 of the Supporting Information while Figure 2 illustrates how these frequencies were calculated. In the spleen, a higher binding of the vehicle-loaded control dimers and the secondary reagent used to visualize them was observed compared with that of the liver (Fig. 2A and Supporting Information Fig. 2). This nonspecific staining may have obscured specific binding of α-GalCer-CD1d-dimers to splenocytes and therefore a cautious interpretation of the final frequencies calculated for the spleen is warranted.
Figure 2.
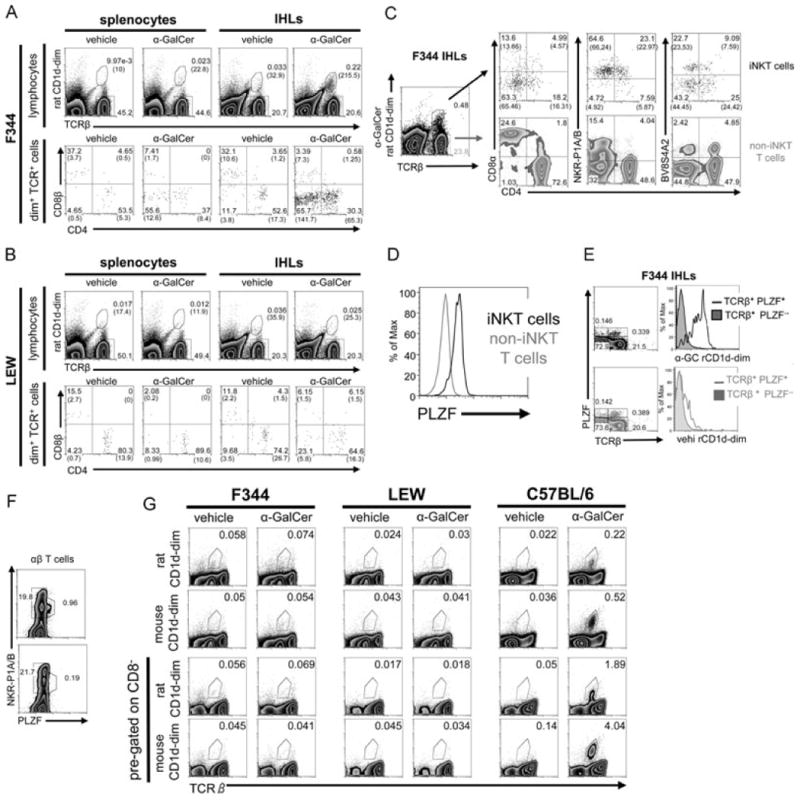
iNKT-cell characterization in F344 and LEW inbred rat strains. (A, B) Splenocytes and IHLs derived from (A) F344 and (B) LEW inbred rats were stained with rat CD1d dimers loaded with α-GalCer or vehicle as control, anti-TCRβ, -CD4, and -CD8β mAbs and were analyzed by flow cytometry. The number of cells included in the depicted gates per 100 000 lymphocytes is shown in brackets. (C) CD4, CD8α, NKR-P1A/B, and BV8S4A2 expression on intrahepatic F344 rat iNKT (dot plots, top) and non-iNKT T cells (density plots, bottom) was addressed by flow cytometry. The final percentages of the cells in the quadrants after substraction of the cells stained with control vehicle-CD1d dimers are shown in brackets. (D) PLZF expression by F344 iNKT and non-iNKT T cells. IHLs were stained at the surface with anti-TCRβ mAb and α-GalCer-CD1d dimers and with anti-PLZF mAb intracellularly. (E) PLZF expression and CD1d dimer binding analyzed among IHLs. Density blots show total IHLs stained with anti-TCR and anti-PLZF mAb and the gating strategy used to create the histograms shown on the right. IHLs were stained with α-GalCer-CD1d dimers (top) or with vehicle-CD1d dimers (bottom). (F) PLZF expression by αβ T cells among F344 (density plot, top) and LEW IHLs (density plot, bottom). IHLs were stained at the surface with anti-TCRβ and anti-NKR-P1A/B mAbs and intracellularly with anti-PLZF mAb. Shown are pregated TCRβ-positive events. (G) Analysis of iNKT cells in the thymus. Thymocytes from F344 and LEW rats and from C57BL/6 mice were stained with rat and mouse CD1d dimers, anti-TCRβ, and anti-CD8 mAbs and were analyzed by flow cytometry. Total thymocytes are shown in the two upper rows whereas the two lower rows depict only CD8− thymocytes. In all mouse samples, B cells were excluded from the analysis by pregating on CD19− cells. (A–G) The data shown are representative of at least three independent experiments except in (F) where the experiment shown was carried out once. Values without brackets indicate the percentages of gated cells.
A reliable phenotypic characterization of iNKT cells was only possible in the liver, but not for the extremely small numbers of splenic iNKT cells. Most rat iNKT cells are DN or CD4+ (Fig. 2A and Supporting Information Table 1) and, similar to their mouse counterparts [17], rat iNKT cells express lower levels of CD4 than non-iNKT CD4+ T cells (Fig. 2C). Similar to humans, but in contrast to mice [1, 6], a fraction of rat iNKT cells were found to express CD8α+ (Fig. 2C). In contrast, almost no CD8β+ iNKT cells were detected (Fig. 2A and Supporting Information Table 1). As shown in Figure 2, the majority of rat iNKT cells expressed NKR-P1A/B at intermediate levels, detected by the mAb 10/78 [18], but only a small fraction of all NKR-P1A/B+ T cells are iNKT cells (Supporting Information Table 1). It is important to highlight this finding since coexpression of NKR-P1A/B and TCR are used as surrogate markers for iNKT cells in the rat [19–21]. TCR usage among iNKT cells was analyzed with the mAbs R78 and HIS42, which in F344 rats bind, respectively, to TCRs containing BV8S4A2 (a homologue to mouse BV8S2) and BV16 [10]. About half of iNKT cells were R78 (BV8S4A2)-positive while almost no BV16+ iNKT cells were detected (Fig. 2C and data not shown for BV16).
Recently, the transcription factor PLZF was found to be expressed at high levels by iNKT cells and to control the development of their innate-like features [22, 23]. As shown in Fig. 2(D), most iNKT cells, defined by concomitant staining with α-GalCer-CD1d dimers and anti-TCRβ mAb (as shown in Fig. 2A and C), were stained by an anti-PLZF mAb. Moreover, almost all PLZF+ αβ T cells were also stained by α-GalCer-CD1d dimers but not by vehicle-loaded CD1d dimers (Fig. 2E). Some TCRβ-negative cells were also stained with the anti-PLZF mAb (Fig. 2E). However, staining with an isotype control antibody revealed a similar background staining for TCRβ-negative cells (0.193%) whereas the background staining among TCRβ-positive cells was much lower (0.06%, data not shown). Last, consistent with iNKT cells being the major PLZF-expressing T-cell population, most PLZF+ αβ T cells expressed NKR-P1A/B at intermediate levels (Fig. 2F).
LEW rats show a profound iNKT cell deficiency
Apart from F344 inbred rats, we also examined the widely used LEW inbred rat strain. The LEW strain is well known for its susceptibility to induced organ-specific autoimmunity, which is not to be found in F344 rats [24–26]. As shown in Figure 2F LEW rats lack the PLZF+ NKR-P1A/B-intermediate T-cell population found in F344 and show no specific binding of α-GalCer-CD1d dimers (Fig. 2B). Nevertheless, the few cells stained with α-GalCer-CD1d dimers in the liver of LEW rats showed some increase of the DN fraction in comparison with the cells stained with vehicle-CD1d dimers (Fig. 2B). Therefore, it is conceivable that these DN cells are iNKT cells, which may be missed due to nonspecific staining of the vehicle control. However, even if it is postulated that all the DN α-GalCer-CD1d-stained cells would be bona fide iNKT cells, their frequency would be a maximum of 0.003% in IHLs (i.e., about 2% of the iNKT cells found in F344 liver).
Next, we examined the presence of iNKT cells in the thymus of both inbred rat strains by flow cytometry and compared it with that of C57BL/6 mice (Fig. 2G). We used both rat and mouse CD1d dimers, but none of them revealed a distinct iNKT-cell population among F344 or LEW thymocytes. In contrast, C57BL/6 thymocytes contained a distinct fraction of α-GalCer-CD1d dimer-stained cells. The analysis of iNKT cells in mouse thymi is commonly carried out after exclusion of HSAhigh (CD24) immature thymocytes. The commercially available anti-rat HSA mAb does not stain rat thymocytes. Therefore, we analyzed CD8− cells (CD8αβ− in case of rat and CD8αα−/CD8αβ− in case of mouse), stained with anti-TCRβ mAb and CD1d dimers. This approach has been chosen to specifically enrich the populations among which rat (CD4+, DN, and CD8αα+) or mouse (CD4+, DN) iNKT cells are expected and found to result in an eightfold increase of the relative iNKT-cell frequency among C57BL/6 thymocytes. However, we were still not able to detect a distinct iNKT-cell population among F344 or LEW thymocytes (Fig. 2G).
In addition to flow cytometry experiments, we also examined the expression of AV14-containing TCRs by RT-PCR (Supporting Information Fig. 1F). First, we analyzed the expression of TCRα chains comprised by AV14 and AJ18 gene segments. The highest expression levels were found among F344 IHLs, followed by F344 splenocytes, and thymocytes. In contrast, analysis of LEW-derived RNA gave only very weak or no signals. Importantly, the differences between LEW and F344 were already found in thymocytes.
AV14-AJ18 rearrangements were also analyzed by sequencing the RT-PCR products. Sequencing always succeeded in F344 rats but only in one of three attempts in LEW rats. In thymocytes of F344 rats, the AJ18 sequence was only partially readable, which would be expected if noncanonical AV14-AJ18 rearrangements with VJ gene segment transitions of different lengths were also amplified (data not shown). The PCR products obtained from F344 IHLs and splenocytes showed a characteristic iNKT AV14-AJ18 transition with a three nucleotide length, which very often encoded the germ line alanine (position 93). Nonetheless, in this position nongerm line nucleotides encoding a glycine were also found with high frequency (data not shown), as it has been described by Matsuura and colleagues [9]. Importantly, human iNKT-TCRs also vary at this position resulting in different binding capacities to CD1d [27].
AV14-AC RT-PCR, which detects TCRα chains containing AV14 gene segments, and, in principle, any AJ gene segment, gave clear signals for both strains in all organs (Supporting Information Fig. 1F). AV14-AC PCR products with a readable AJ18 signal were found only in splenocytes and IHLs of F344 rats (data not shown). In F344 splenocytes, the AJ18 sequence was superimposed with other sequences while the entire AV14-AC product from IHLs was read as an iNKT-TCRα sequence (data not shown).
Cytokine secretion in response to α-GalCer stimulation
After antigen recognition, iNKT cells rapidly secrete vast amounts of many different cytokines. Therefore, we cultured splenocytes and IHLs from F344 and LEW inbred rats for 24 h and subsequently, we analyzed IFN-γ and IL-4 released into the culture supernatants (Fig. 3A). Cells derived from F344 inbred rats secreted both IL-4 and IFN-γ in a dose-dependent manner after α-GalCer stimulation. This response was observed among F344 IHLs cultured at a cell density of 2.5 × 10⁶ cells/ml. In order to detect such a response in the spleen it was necessary to increase the cell density to 107 cells/ml. Cytokine production in response to α-GalCer stimulation was dependent on CD1d since it was blocked by the anti-rat CD1d mAb WTH-1. The supernatants of IHLs contained twice as much cytokines as those of splenocytes, although the concentration of IHLs was four times lower than that of splenocytes. This correlates well with the iNKT cell frequencies determined by flow cytometry.
Figure 3.
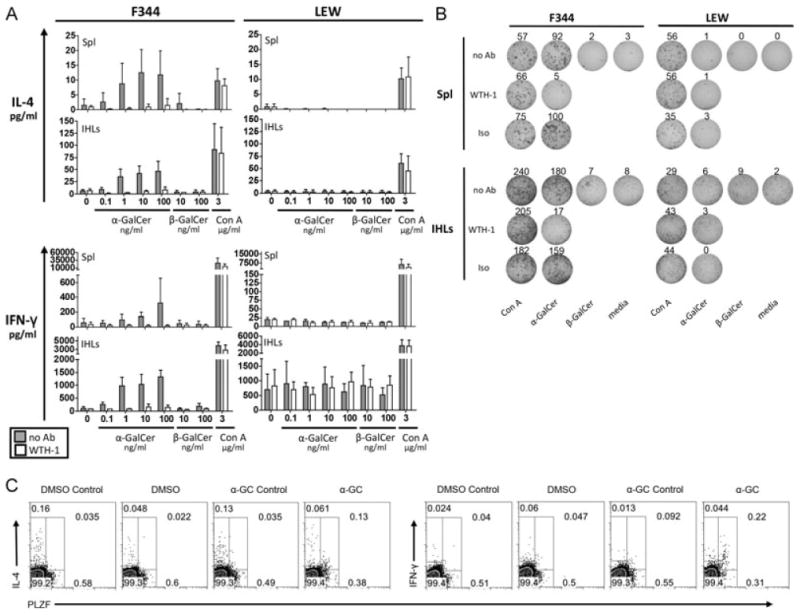
Cytokine release by F344- and LEW-derived primary cells in response to α-GalCer stimulation. (A) IL-4 and IFN-γ release into the supernatant was analyzed by ELISA after 24 h of stimulation of primary splenocytes (107 cells/ml) and IHLs (2.5 × 10⁶ cells/ml) with the indicated concentrations of α-GalCer, β-GalCer or Con A in the absence (gray bars) or presence of an anti-rat CD1d monoclonal antibody (WTH-1 at 3.6 μg/ml, white bars). Data are shown as the mean + SD of results pooled from three independent experiments, each experiment performed with cells derived from individual animals. Assays with splenocytes performed in duplicate, assays with IHLs performed on single samples. (B) IL-4 secretion by F344- and LEW-derived splenocytes (106 cells/well) and IHLs (2.5 × 10⁵ cells/well) addressed by ELISPOT after 24 h of culture with α-GalCer (10 ng/ml), β-GalCer (10 ng/ml), Con A (2 μg/ml), or in medium only. The cultures with α-GalCer and Con A were also carried out in the presence of the anti-rat CD1d monoclonal antibody WTH-1 or an isotype-matched control antibody at a final concentration of 5 μg/ml. Values indicate the number of spots per well. (C) α-GalCer-induced cytokine production by PLZF+ IHLs. 106 F344 IHLs/ml were cultured for 5 h with 100 ng/ml α-GalCer, adding GolgiPlug during the last 2 h. Control stainings were carried out incubating the samples with excess of the unconjugated anti-cytokine mAbs before the fluorochrome-labeled antibodies were added. Control cultures adding only DMSO were carried out in parallel. Data shown are representative of three (IFN-γ) or two (IL-4) independent experiments. PLZF+ cells were gated with help of isotype-control stainings (not shown).
In contrast to F344 inbred rats, LEW splenocytes or IHLs secreted no IL-4 or IFN-γ after α-GalCer stimulation, although Con A-induced cytokine release was similar to that of F344. A spontaneous IFN-γ secretion by LEW-derived IHLs was observed, which was not blocked by the anti-rat CD1d mAb WTH-1. Primary cells derived from DA and BN rats also showed α-GalCer-induced IL-4 and IFN-γ production, which was abrogated by the WTH-1 mAb (data not shown).
In addition, we addressed IL-4 release by primary cells in ELISPOT assays (Fig. 3B). IL-4-secreting cells were found among F344 but not LEW IHLs and splenocytes cultured with α-GalCer. The response was profoundly inhibited by anti-CD1d mAb and on a per cells basis, α-GalCer-induced IL-4-secreting F344 splenocytes were eightfold less frequent than the corresponding IHLs. These data correspond well with the IL-4 concentrations shown in Fig. 3A and the lower frequency of iNKT cells found in the spleen compared with that in the liver (Supporting Information Table 1).
As a more direct test for cytokine production by iNKT cells, freshly isolated IHLs were stimulated for 5 h with α-GalCer and subsequently were stained for intracellular IFN-γ and IL-4 (Fig. 3C). Due to down-regulation of TCR after activation, a reliable CD1d dimer staining was not possible. Therefore PLZF was used as a surrogate marker for iNKT cells. The mean frequency of IFN-γ-positive iNKT cells obtained from three independent experiments is 29.1% with a SD of 3.65%. The numbers of IL-4-producing iNKT cells in two experiments were 14.8 and 18.8%. In contrast, PLZF− cells were not specifically stained for IL-4 or IFN-γ and no cytokine production was found in control cultures with the α-GalCer solvent DMSO.
In vitro expansion of rat iNKT cells
We next sought to expand rat iNKT cells. Toward this goal, we cultured splenocytes of F344 inbred rats with α-GalCer. After 1 week, F344-derived iNKT cells expanded strikingly in frequency. The expansion of about 40-fold in number, resulted in the cells being easily detected with rat α-GalCer-CD1d dimers (Fig. 4A, Supporting Information Table 3). Moreover, using the supernatants of Con A-stimulated splenocytes as a source of T-cell growth factor(s), a further 7 days of culture led to an approximately 400-fold expansion (Fig. 4B, Supporting Information Table 3). All cells in the cultures stained by α-GalCer-CD1d dimers express PLZF, but probably due to their low TCR expression levels, there are some PLZF+ cells that are not stained by α-GalCer-CD1d dimers. Therefore, iNKT cell expansion from F344 splenocytes was calculated by identifying iNKT cells as PLZF+ cells. In contrast to F344, no iNKT cells were observed after 7 days of culture of LEW splenocytes with α-GalCer. Importantly, mouse iNKT cells from C57BL/6 splenocytes did not proliferate under these culture conditions (Fig. 4A). Interestingly, it has been shown that human iNKT cells expand vigorously from PBMCs in short-term cultures (7 days) with α-GalCer [28]. We also cultured primary IHLs from both rat strains under the same conditions as splenocytes and observed even a greater expansion of F344 iNKT cells during the first week of culture (80-fold expansion, Supporting Information, Table 3). No iNKT cells were seen after culture of LEW IHLs (data not shown).
Figure 4.
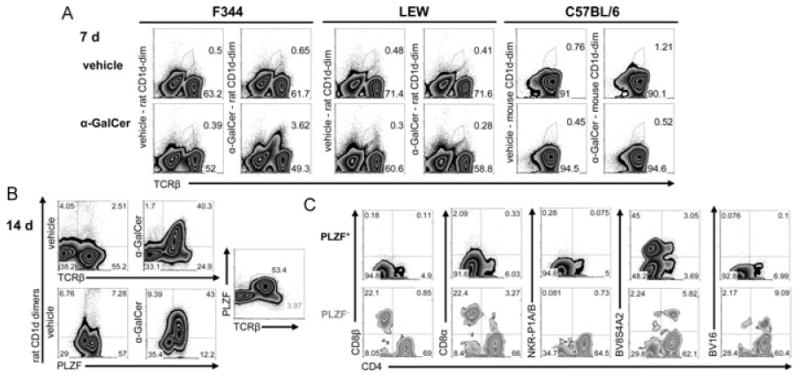
Rapid in vitro expansion of iNKT cells from F344 inbred rats. (A) Flow cytometry analysis after 7-day culture of splenocytes. Rat- and mouse-derived splenocytes were stained with rat and mouse CD1d dimers, respectively. Mouse B cells, identified as CD19+ cells, were excluded from the analysis. (B) Expanded iNKT cells in 14-day cultures of F344-derived splenocytes stained with rat CD1d dimers and anti-PLZF mAb. (C) Analysis of CD4, CD8β, CD8α, NKR-P1A/B, BV8S4A2, and BV16 expression by PLZF+ and PLZF− T cells gated as shown in (B) (PLZF and TCRβ plot). The depicted data are from one of three similar experiments.
In order to analyze the phenotype of the expanded iNKT cells, we identified them as PLZF+ cells although in parallel, we also stained them with CD1d-dimers (Fig. 4C, Supporting Information Table 3). In contrast to primary iNKT cells, after 14 days of culture most of the expanded iNKT cells did not express NKR-P1A/B receptors and were DN. Furthermore, only small fractions expressing CD4 or CD8α+ were detected. So far, we cannot distinguish whether this change in expression of surface molecules resulted from modulation of the respective molecules, outgrowth of the DN population, or a combination of both. Nonetheless, the usage of BV8S4A2 and BV16-positive TCRs was very similar to that of primary iNKT cells. The phenotype of iNKT cells identified with CD1d dimers was highly similar to that of the PLZF+ cells (Supporting Information Table 3).
We also addressed cytokine production by the expanded iNKT cells after stimulation with PMA and ionomycin. We identified iNKT cells again as PLZF+ cells. Practically all expanded iNKT cells produced IFN-γ and most of them also secreted IL-4 (Fig. 5A). In contrast, neither IL-10 nor IL-17 was detected (data not shown). The supernatants of the cultures at days 7 and 14 also contained very high levels of IFN-γ and IL-4 (Fig. 5B). Furthermore, we analyzed cytokine release by different subsets of iNKT cells as defined by CD4 and CD8α expression (Fig. 5C). Whereas we did not observe any differences for IL-4 release between these subsets, CD8α+ iNKT cells appear to be the subset with the highest potential to produce IFN-γ, followed by DN and CD4+ iNKT cells, respectively. Taking all together, like in humans [6, 28], the small number of iNKT cells among primary cells could be enormously expanded in cultures with α-GalCer and after expansion they produce very high levels of cytokines.
Figure 5.
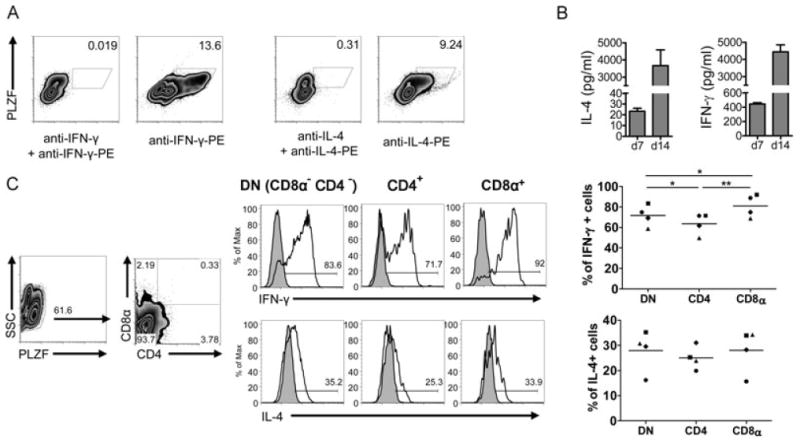
Cytokine production by expanded iNKT cells. (A) IL-4 and IFN-γ production by expanded iNKT cells (14-day cultures) studied by flow cytometry. iNKT cells were identified as PLZF+ cells. Control stainings were carried out incubating the samples with excess of the unconjugated anti-cytokine mAbs before the fluorochrome-labeled antibodies were added. Data shown are representative of three independent experiments. (B) Concentrations of IL-4 and INF-γ in the supernatant of F344 cultures with α-GalCer at days 7 and 14 were determined by ELISA. The amounts of IFN-γ and IL-4 contained in culture media supplemented with 10% of Con A supernatant used in 14-day cultures were subtracted from the values obtained in supernatants of expanded cells at day 14. Data are shown as the mean + SD of results pooled from three independent experiments, each performed in duplicate. (C) IL-4 and IFN-γ production by DN, CD4+, and CD8α+ PLZF+ cells. The density plots on the left show the gating strategy. Control stainings of cytokines (filled histograms) were carried out as in (A). The values obtained in four independent experiments are shown, each experiment illustrated with different symbols (right). Means are shown by lines. *p < 0.05 and **p < 0.005, paired t-test.
The AV14 gene family and its organ distribution
Rats possess a multimember AV14 gene family, which has been divided into type 1 and type 2 genes on the basis of CDR2α differences [9, 11, 12]. The data on the rat genome deposited in the NCBI database (derived from BN inbred rats) have been updated since the last analysis carried out by Kinebuchi and Matsuura [11]. Therefore, we have reassessed the relevant databank entry and updated the nomenclature according to the actual genome version. Fig. 1 of the Supporting Information contains the updated AV14 nomenclature and further analyses including the identification of a new AV14 family member and information about the AV14 and AJ18 recognition signal sequences.
In order to address the usage of the two different AV14 types in different organs of F344 and LEW rats, we analyzed the sequences obtained from the RT-PCR products described above. Supporting Information Fig. 1 illustrates how we evaluated the data. Depending on which nucleotide sequences appeared in the CDR2α regions, a type 1 versus type 2 ranking was established and was illustrated with symbols “>” (Supporting Information Table 2). First of all, with this technique we did not observe an organ-specific distribution of the different types, but rather a differential usage by individual rats. In F344, there were no remarkable differences in the AV14-type usage of TCRs containing only AJ18 compared with that of TCRs, which contained diverse AJ gene segments (i.e., AV14-AC products of thymus and spleen). Interestingly, in contrast to F344 inbred rats, which show a general preference toward type 2 AV14 gene segments (taking all the data of the four analyzed animals together), LEW inbred rats preferentially use type 1 AV14 gene segments. Furthermore, we analyzed the AV14 usage of iNKT cells expanded for 14 days from splenocytes cultured with α-GalCer (as described above). In three independent experiments, a preferential usage of type 2 AV14 gene segments was found (data not shown). In summary, we could not confirm an organ-specific distribution of the different AV14 types, but we observed a differential usage among F344 and LEW rats.
Discussion
This study provides the first direct identification and ex vivo and in vitro characterization of rat iNKT cells, the description of a profound iNKT cell deficiency in the LEW rat strain and an update on the rat AV14 multigene family as well as its proposed organ-specific usage.
Instrumental for the direct identification of rat iNKT cells was the use of syngeneic CD1d dimers. Since α-GalCer-CD1d tetramers of the mouse and man bind to the iNKT-TCR of either species and also of the iNKT-TCR of pigs [1, 29], it was surprising that α-GalCer-loaded mouse and human CD1d oligomers did not bind to rat iNKT-TCR ([12], this paper and own unpublished data). These results were initially unexpected due to the high similarity of the predicted amino acid sequences of mouse, rat, and human CD1d, AV14, and AJ18 [12,13]. Nonetheless, rats have two amino acids that are different from those described to directly contribute to the recognition of α-GalCer/CD1d complexes by iTCRs in human and mouse. One is located in the invariant TCRα chain (lysine at position 101) and the other one in the CD1d (methionine at position 148) [12, 13, 30]. These differences could be the reason for the lack of cross-reactivity between rats and mice similar as in the case of Tupaia belangeri where a single amino acid substitution in CD1d prevents the recognition of α-GalCer by the human iNKT-TCR [31]. Thus, a correlation between cross-reactivity on the one hand and overall sequence similarity or phylogenetic relationship on the other hand cannot be always assumed. Another surprising finding is that the lack of cross-reactivity between mouse and rat is partially unidirectional since rat α-GalCer-CD1d dimers still bound to a distinct population of about 50% of all mouse iNKT cells (Fig. 1). This demonstrates the unsuitability of using xenogeneic CD1d oligomers for the identification of iNKT cells in another mammalian species, since it could mistakenly identify only a fraction of iNKT cells as being the entire iNKT cell population.
The direct identification of iNKT cells with rat CD1d dimers definitively demonstrated that the co-expression of NKR-P1A/B and the TCR are not at all suitable surrogate markers for iNKT cells in the rat. Therefore, previous studies where rat NKR-P1A/B+ αβ T cells have been considered as iNKT cells [19,21] should be interpreted with caution. Rat iNKT cells are mostly DN or CD4+ and a considerable fraction of CD8α+ cells was also detected, what is similar to humans but different to mice. Since different iNKT cell subsets defined by the differential expression of CD4, CD8, and NKR-P1 receptors have been shown to secrete different cytokine profiles [1], it would be of interest to learn whether this is also the case of primary rat iNKT cells. Indeed, we observed greater IFN-y production by expanded rat CD8α+ iNKT cells, compared with that of DN and CD4+ iNKT cells, as it has been reported for expanded human CD8α+ iNKT cells [6].
The genetic basis for the low iNKT cell frequencies of F344 rats compared with that in mice remains unclear. However, different expression levels of CD1d by thymocytes, which would affect iNKT cell selection, can be excluded since thymocytes of both species have nearly identical CD1d levels [13]. The same is true for the recognition signal sequences, which are identical for all AV14 gene segments of mice and rats and for AJ18 genes differ in only two nucleotides (Supporting Information Fig. 1E and data not shown). The low frequency of iNKT cells probably explains the lack of a direct identification of thymic F344 iNKT cells. Although frequencies of peripheral and thymic iNKT cells do not necessarily correlate [32], an extrapolation from frequencies of C57BL/6 liver and thymic iNKT cells would predict for F344 rats a frequency in the range of 0.01% of total thymocytes and 0.08% for CD8β-pregated cells. In humans, gating of vehicle-CD1d stained cells into a “dump” channel has been instrumental for better characterization of very low frequencies (about 0.01%) of (thymic) iNKT cells [32]. So far, this approach is not feasible since in this study the rat CD1d dimers used are detected with a secondary reagent (fluorochrome-labeled anti-mouse Ig), which binds both vehicle and α-GalCer-loaded dimers. Nevertheless, the identification of canonical iNKT-TCRα sequences among AV14AJ18 PCR products clearly indicates the existence of iNKT cells in the F344 thymus.
The differences observed in iNKT cell numbers between F344 and LEW rats in this study are not completely understood, but cannot be accounted to strain-specific differences in the amino acid sequence of the mature CD1d protein or its expression levels, which are identical for both rat strains [13]. Nonetheless, since the first step necessary for the development of iNKT cells is the rearrangement of the A14 and AJ18 gene segments, the lack of iNKT cells in LEW inbred rats might be the consequence of a very inefficient production of iTCRα chains by thymocytes. Furthermore, LEW and F344 rats do differ in their Tcrb haplotypes. In particular, BV8S2 and BV8S4 are distinct in their CDR2β. Consequently, they could very well affect iNKT-TCR affinity and, thereby, iNKT cell development as well [12]. Our observation of a type 2 AV14 dominance in iNKT and in non-iNKT cell rearrangements of F344 and the type 1 bias in the iNKT cell-deficient LEW inbred rat strain prompts the question of whether the type of AV14 usage could be connected with the impaired iNKT cell development in these animals and whether AV14 type 1 or type 2-comprising iNKT cell receptors may differ in antigen recognition. Based on thorough studies of many groups using different techniques, the current view on iNKT-TCR/CD1d interaction is that the CDR2α, which discriminates type 1 and type 2 AV14 genes, is not at all, or only very weakly, involved in CD1d-restricted antigen recognition [30]. Whether this holds true for the rat still needs to be shown, especially since own preliminary data obtained with α-GalCer-CD1d dimers and iNKT-TCR transductants suggest that rat AV14 family members may indeed differ in their CD1d/antigen-binding properties.
Our data on the F344 iNKT-TCR repertoire are fully consistent with the data from Matsuura and colleagues who used molecular biology methods (RT-PCR and analysis of cDNA libraries) to make predictions on frequencies and organ-specific distribution of rat iNKT cells, as well as on the proportion of canonical iNKT-TCR rearrangements within AV14-containing TCRs [9]. Nevertheless, we could not confirm the proposed organ specificity of AV14 gene usage. It was not clear that Matsuura and colleagues analyzed several individual animals. Therefore, it is possible that their different results were due to variability between individual animals. Indeed, we found the proposed dominance of type 2 AV14 in spleen and a nearly equal distribution of type 1 and type 2 in IHLs, but only in one of four F344 rats (Supporting Information Table 2, animal 2).
The impossibility to detect iNKT cells in LEW rats is of particular interest since iNKT cells have been linked to autoimmunity in humans and mouse models and the LEW strain is widely used as model for organ-specific autoimmune diseases such as experimentally induced encephalomyelitis, uveitis, and others. Importantly, the induction of these diseases is not successful in F344 rats [24–26]. Therefore, the clear differences in iNKT-cell frequencies between LEW and F344 rats (and probably between other inbred strains as well) offer the opportunity to map loci controlling the different frequencies and link them (or not) with known disease-associated loci, for example, controlling autoimmunity [24–26]. Moreover, the role of iNKT cells in the development of spontaneous type 1 autoimmune diabetes is not clear [1]. Thus, an obvious candidate for the analysis of iNKT cells are BB inbred rats as they are, apart from NOD mice, the only animal model available for this disease.
The observed similarities in the frequencies and phenotype of F344 rat iNKT cells compared with those in the human already suggest that certain rat strains might result in valuable models to study iNKT cells in disease. Indeed, the rather simple mode of in vitro expansion is of special interest, since it opens the possibility of expanding and manipulating iNKT cells in vitro and testing the functional properties of the cells after adoptive transfer. Such possibilities are especially appealing in tumor models where the adoptive transfer of iNKT cells is already being tested in clinical trials [33], and also in the well-established rat models of autoimmunity. The findings presented in this study should also be relevant for researchers using rats to study obesity and/or inflammatory processes such as arteriosclerosis, where the importance of iNKT cells has emerged over the last years [34,35]. Moreover, our results are also of high relevance in the fields of pharmacology, physiology, and surgery in which the rat is the major model organism and where iNKT cells have been ignored so far.
Altogether, we hope that the current study will help and motivate researchers to analyze iNKT cells in the rat model, which shows some promising similarities to humans, and we anticipate that such studies will greatly enhance our understanding of iNKT-cell biology.
Materials and methods
Animals
F344/DuCrl and LEW/Crl inbred rats and C57BL/6J/Crl inbred mice originally obtained from Charles River were kept and bred in the animal facilities of the Institute for Virology and Immunobiology, University of Würzburg, Würzburg, Germany. The procedures for performing animal experiments as well as animal care were in accordance with the principles of the German law. Permission to keep and breed the animals was given by the city of Würzburg, Germany (OA/he-wa07.12.1987). All animals were maintained under specific pathogen-free conditions and were used at 6–18 weeks of age.
Cell preparation
Thymocytes and splenocytes were prepared by mechanical disruption using a stainless steel mesh. Erythrocytes were eliminated by lysis with TAC buffer (20 mM Tris, pH 7.2, and 0.82% NH4Cl). Rat and mouse IHLs were isolated as described previously [36].
Rat and mouse CD1d dimer production and loading with α-GalCer
Rat and mouse CD1d dimers were produced in our laboratory as previously described for mouse CD1d dimer [37, 38]. Modifications such as the use of rat-β-2 microglobulin transduced J558L cells for rat CD1d-dimer production and construction of the CD1d dimer expression vectors have been performed as described in [36]. The dimers (at a final concentration of 250 ng/μl) were loaded with 40× molar excess of α-GalCer in the presence of 0.05% Triton X-100 for 16 to 24 h at 37°C. As previously shown by Porcelli and colleagues [39], the presence of Triton X-100 was crucial for appropriate loading of α-GalCer into the CD1d molecules. The vehicle used for dilution of α-GalCer was DMSO, thus as control, the dimers were loaded only with the corresponding amount of DMSO.
Flow cytometry
Nonspecific binding of the Ab/dimers to mouse Fc receptors were blocked by incubating the cells first with anti-mouse Fc receptor mAb (2.4G2). CD1d dimer stainings were carried out at room temperature for 30 min with 1 μg of dimers (4 μl) per 100 μl of sample containing up to 106 cells suspended in FACS buffer (PBS pH 7.4, BSA 0.1%, 0.01% NaN3). Bound CD1d dimers were detected with a fluorophore-labeled donkey F(ab′)2 fragment anti-mouse IgG (H+L) with minimal cross-reactivity to rat and other species serum proteins (Dianova), referred hereafter as DαM. After incubation with DαM, nonspecific binding to the DαM Ab was blocked with IgG from mouse serum and subsequently other mAbs were added. Gating out macrophages and DCs (CD11b/c: clone OX-42) and B cells (CD45RA: clone OX-33) did not lead to an improvement of α-GalCer-CD1d versus vehicle-CD1d dimer staining. Furthermore, the background staining observed with vehicle-CD1d dimers appeared to a similar extent when mouse IgG1 was used as control isotype matching antibody for CD1d-dimers and also when the secondary reagent was used alone (Supporting Information Fig. 2).
Cells were fixed for intracellular stainings with Foxp3 fixation/permeabilization buffers (eBiosciences). Intracellular stainings were carried out in permeabilization buffer (eBiosciences). Intracellular cytokine stainings were performed after stimulation with PMA (10 ng/ml) and ionomycin (1000 ng/ml) during 5 h in the presence of GolgiPlug containing Brefeldin A (BD Biosciences) for the last 2 h. Biotinylated antibodies were visualized with streptavidin-allophycocyanin (BD Biosciences). Flow cytometry was conducted in a FACSCalibur and samples were analyzed using FlowJo software (Tree Star).
Monoclonal antibodies
mAbs used in this study were purchased from BD Biosciences unless otherwise indicated. These mAbs are anti-rat TCRβ (R73 conjugated with FITC, PE, or biotin); mAb R78-biotin, which recognizes BV8S2A1 or BV8S4A2-positive TCRβ from the l (LEW inbred rat strain) or a (F344 inbred rat strain) rat Tcrb haplotypes, respectively [10]; anti-rat BV16 (HIS42 was purified and biotinylated in our laboratory); anti-rat NKR-P1A/B (10/78-biotin). This antibody and the widely used mAb 3.2.3 have originally been generated against NKR-P1A but were found to bind the inhibitory NKR-P1B as well [18]; anti-rat CD4 (OX-35-Cy5-PE); anti-rat CD8β (341-biotin); anti-rat CD8α (G28-biotin); anti-mouse TCRβ (H57-597-FITC and -PE); anti-mouse CD8α (53-6.7-PerCP, Biolegend); anti-mouse CD19 (1D3-allophycocyanin); anti-PLZF (Mags.21F7-AF488 produced and labeled by the Monoclonal Antibody Core Facility of Memorial Sloan-Kettering Cancer Center); anti-rat IFN-γ (DB-1-PE from BD Biosciences and unconjugated from Serotec) and anti-rat IL-4 (OX-81-PE and unconjugated); anti-mouse IL-17A (TCII-18H10-PE), which also binds rat IL-17 specifically; and anti-rat IL-10 (A5-4-PE).
Cytokine release by primary cells after ex vivo stimulation
Primary cells were cultured in RPMI 1640 medium supplemented with 10% FCS, 1 mM sodium pyruvate, 2.05 mM glutamine, 0.1 mM nonessential amino acids, 5 mM β-mercaptoethanol, penicillin (100 U/ml), streptomycin (100 μg/ml), and 10 mM HEPES at 37°C with 5% CO2 and an H2O-saturated atmosphere. IL-4 and IFN-γ release into the supernatant was analyzed by ELISA with the commercially available rat IL-4 and IFN-γ ELISA kits (BD Biosciences). IL-4 secretion was also addressed by ELISPOT with the rat IL-4 ELISPOT set from BD Biosciences following the recommendations of the manufacturer. Primary cells at the indicated densities were cultured for 24 h in the presence or absence various stimuli at the specified concentrations. α-GalCer (Alexis Biochemicals) and β-GalCer (Galactocerobroside, Sigma) were dissolved in DMSO. The anti-CD1d mAb WTH-1 [13] was added to the cultures 30 min before the addition of any stimuli. Spots were analyzed and enumerated using the CTLImmunoSpot S5 Versa analyzer ELISPOT reader and the ImmunoSpot 4.0 Software (both from CTL). Small spots (smaller than 0.096 mm2) obtained in cultures with medium only were considered nonspecific background and were subtracted from all the samples.
In vitro expansion of iNKT cells
Single cell suspensions prepared from spleens and livers were plated at a density of 106 cells per 1 ml of RPMI 1640 supplemented as aforementioned. Cells were cultured with 20 ng/ml α-GalCer during the first 7 days. During the second week, the cells were cultured with 10 ng/ml α-GalCer and 10% of T-cell growth factor-containing medium (supernatant from Con A-stimulated rat splenocytes blocked with α-methylmannoside) usually adding fresh media at day 13.
Supplementary Material
Acknowledgments
We would like to especially thank T. Hünig for his continuous support to this project and N. Beyersdorf for critical reading of the manuscript and helpful comments. This work was supported by the Deutsche Forschungsgemeinschaft Graduate College 520 Immunomodulation and HE 2346/6-1. EMC was also supported by a STIBET Doktoranden grant of the Deutsche Akademische Auslandsdienst. DBS was supported by NIH NIAID R01 AI083988 and AI059739 and by the Robert Wood Johnson Foundation (grant no. 67038) to the Child Health Institute.
Abbreviations
- α-GalCer
α-Galactosylceramide
- IHL
Intrahepatic lymphocyte
- DN
CD4 and CD8 double negative
Footnotes
Conflict of interest: The authors declare no financial or commercial conflict of interest.
Additional supporting information may be found in the online version of this article at the publisher's web-site
References
- 1.Bendelac A, Savage PB, Teyton L. The biology of NKT cells. Annu Rev Immunol. 2007;25:297–336. doi: 10.1146/annurev.immunol.25.022106.141711. [DOI] [PubMed] [Google Scholar]
- 2.Looringh van Beeck FA, Reinink P, Hermsen R, Zajonc DM, Laven MJ, Fun A, Troskie M, et al. Functional CD1d and/or NKT cell invariant chain transcript in horse, pig, African elephant and guinea pig, but not in ruminants. Mol Immunol. 2009;46:1424–1431. doi: 10.1016/j.molimm.2008.12.009. [DOI] [PMC free article] [PubMed] [Google Scholar]
- 3.Koseki H, Imai K, Nakayama F, Sado T, Moriwaki K, Taniguchi M. Homogenous junctional sequence of the V14+ T-cell antigen receptor alpha chain expanded in unprimed mice. Proc Natl Acad Sci U S A. 1990;87:5248–5252. doi: 10.1073/pnas.87.14.5248. [DOI] [PMC free article] [PubMed] [Google Scholar]
- 4.Lantz O, Bendelac A. An invariant T cell receptor alpha chain is used by a unique subset of major histocompatibility complex class I-specific CD4+ and CD4-8- T cells in mice and humans. J Exp Med. 1994;180:1097–1106. doi: 10.1084/jem.180.3.1097. [DOI] [PMC free article] [PubMed] [Google Scholar]
- 5.Godfrey DI, MacDonald HR, Kronenberg M, Smyth MJ, Van Kaer L. NKT cells: what's in a name? Nat Rev Immunol. 2004;4:231–237. doi: 10.1038/nri1309. [DOI] [PubMed] [Google Scholar]
- 6.O'Reilly V, Zeng SG, Bricard G, Atzberger A, Hogan AE, Jackson J, Feighery C, et al. Distinct and overlapping effector functions of expanded human CD4+, CD8alpha+ and CD4-CD8alpha-invariant natural killer T cells. PLoS One. 2011;6:e28648. doi: 10.1371/journal.pone.0028648. [DOI] [PMC free article] [PubMed] [Google Scholar]
- 7.Kenna T, Golden-Mason L, Porcelli SA, Koezuka Y, Hegarty JE, O'Farrelly C, Doherty DG. NKT cells from normal and tumor-bearing human livers are phenotypically and functionally distinct from murine NKT cells. J Immunol. 2003;171:1775–1779. doi: 10.4049/jimmunol.171.4.1775. [DOI] [PubMed] [Google Scholar]
- 8.Katabami S, Matsuura A, Chen HZ, Imai K, Kikuchi K. Structural organization of rat CD1 typifies evolutionarily conserved CD1D class genes. Immunogenetics. 1998;48:22–31. doi: 10.1007/s002510050396. [DOI] [PubMed] [Google Scholar]
- 9.Matsuura A, Kinebuchi M, Chen HZ, Katabami S, Shimizu T, Hashimoto Y, Kikuchi K, et al. NKT cells in the rat: organ-specific distribution of NK T cells expressing distinct V alpha 14 chains. J Immunol. 2000;164:3140–3148. doi: 10.4049/jimmunol.164.6.3140. [DOI] [PubMed] [Google Scholar]
- 10.Asmuss A, Hofmann K, Hochgrebe T, Giegerich G, Hunig T, Herrmann T. Alleles of highly homologous rat T cell receptor beta-chain variable segments 8.2 and 8.4: strain-specific expression, reactivity to superantigens, and binding of the mAb R78. J Immunol. 1996;157:4436–4441. [PubMed] [Google Scholar]
- 11.Kinebuchi M, Matsuura A. Rat T-cell receptor TRAV11 (Valpha14) genes: further evidence of extensive multiplicity with homogeneous CDR1 and diversified CDR2 by genomic contig and cDNA analysis. Immunogenetics. 2004;55:756–762. doi: 10.1007/s00251-003-0640-3. [DOI] [PubMed] [Google Scholar]
- 12.Pyz E, Naidenko O, Miyake S, Yamamura T, Berberich I, Cardell S, Kronenberg M, et al. The complementarity determining region 2 of BV8S2 (V beta 8.2) contributes to antigen recognition by rat invariant NKT cell TCR. J Immunol. 2006;176:7447–7455. doi: 10.4049/jimmunol.176.12.7447. [DOI] [PubMed] [Google Scholar]
- 13.Monzon-Casanova E, Steiniger B, Schweigle S, Clemen H, Zdzieblo D, Starick L, Muller, et al. CD1d expression in paneth cells and rat exocrine pancreas revealed by novel monoclonal antibodies which differentially affect NKT cell activation. PLoS One. 2010;5:e13089. doi: 10.1371/journal.pone.0013089. [DOI] [PMC free article] [PubMed] [Google Scholar]
- 14.Brissette-Storkus C, Kaufman CL, Pasewicz L, Worsey HM, Lakomy R, Ildstad ST, Chambers WH. Characterization and function of the NKR-P1dim/T cell receptor-alpha beta+ subset of rat T cells. J Immunol. 1994;152:388–396. [PubMed] [Google Scholar]
- 15.Knudsen E, Seierstad T, Vaage JT, Naper C, Benestad HB, Rolstad B, Maghazachi AA. Cloning, functional activities and in vivo tissue distribution of rat NKR-P1+ TCR alpha beta + cells. Int Immunol. 1997;9:1043–1051. doi: 10.1093/intimm/9.7.1043. [DOI] [PubMed] [Google Scholar]
- 16.Badovinac V, Boggiano C, Trajkovic V, Frey AB, Vujanovic NL, Gold DP, Mostarica-Stojkovic M, et al. Rat NKR-P1+ CD3+ T cells: selective proliferation in interleukin-2, diverse T-cell-receptor-Vbeta repertoire and polarized interferon-gamma expression. Immunology. 1998;95:117–125. doi: 10.1046/j.1365-2567.1998.00567.x. [DOI] [PMC free article] [PubMed] [Google Scholar]
- 17.Engel I, Hammond K, Sullivan BA, He X, Taniuchi I, Kappes D, Kronenberg M. Co-receptor choice by V alpha14i NKT cells is driven by Th-POK expression rather than avoidance of CD8-mediated negative selection. J Exp Med. 2010;207:1015–1029. doi: 10.1084/jem.20090557. [DOI] [PMC free article] [PubMed] [Google Scholar]
- 18.Li J, Rabinovich BA, Hurren R, Shannon J, Miller RG. Expression cloning and function of the rat NK activating and inhibitory receptors NKR-P1A and -P1B. Int Immunol. 2003;15:411–416. doi: 10.1093/intimm/dxg046. [DOI] [PubMed] [Google Scholar]
- 19.Shao H, Van Kaer L, Sun SL, Kaplan HJ, Sun D. Infiltration of the inflamed eye by NKT cells in a rat model of experimental autoimmune uveitis. J Autoimmun. 2003;21:37–45. doi: 10.1016/s0896-8411(03)00049-0. [DOI] [PubMed] [Google Scholar]
- 20.Kattan OM, Kasravi FB, Elford EL, Schell MT, Harris HW. Apolipoprotein E-mediated immune regulation in sepsis. J Immunol. 2008;181:1399–1408. doi: 10.4049/jimmunol.181.2.1399. [DOI] [PubMed] [Google Scholar]
- 21.Chopra P, Diiorio P, Pino SC, Wilson SB, Phillips NE, Mordes JP, Rossini AA, et al. Failure of alpha-galactosylceramide to prevent diabetes in virus-inducible models of type 1 diabetes in the rat. In Vivo. 2009;23:195–201. [PMC free article] [PubMed] [Google Scholar]
- 22.Kovalovsky D, Uche OU, Eladad S, Hobbs RM, Yi W, Alonzo E, Chua K, et al. The BTB-zinc finger transcriptional regulator PLZF controls the development of invariant natural killer T cell effector functions. Nat Immunol. 2008;9:1055–1064. doi: 10.1038/ni.1641. [DOI] [PMC free article] [PubMed] [Google Scholar]
- 23.Savage AK, Constantinides MG, Han J, Picard D, Martin E, Li B, Lantz O, et al. The transcription factor PLZF directs the effector program of the NKT cell lineage. Immunity. 2008;29:391–403. doi: 10.1016/j.immuni.2008.07.011. [DOI] [PMC free article] [PubMed] [Google Scholar]
- 24.Sun D, Whitaker JN, Wilson DB. Regulatory T cells in experimental allergic encephalomyelitis. III. Comparison of disease resistance in Lewis and Fischer 344 rats. Eur J Immunol. 1999;29:1101–1106. doi: 10.1002/(SICI)1521-4141(199904)29:04<1101::AID-IMMU1101>3.0.CO;2-#. [DOI] [PubMed] [Google Scholar]
- 25.Mattapallil MJ, Sahin A, Silver PB, Sun SH, Chan CC, Remmers EF, Hejtmancik JF, et al. Common genetic determinants of uveitis shared with other autoimmune disorders. J Immunol. 2008;180:6751–6759. doi: 10.4049/jimmunol.180.10.6751. [DOI] [PMC free article] [PubMed] [Google Scholar]
- 26.Bleich A, Hopf S, Hedrich HJ, van Lith HA, Li F, Balfour Sartor R, Mahler M. Genetic dissection of granulomatous enterocolitis and arthritis in the intramural peptidoglycan-polysaccharide-treated rat model of IBD. Inflamm Bowel Dis. 2009;15:1794–1802. doi: 10.1002/ibd.21018. [DOI] [PMC free article] [PubMed] [Google Scholar]
- 27.Sanderson JP, Waldburger-Hauri K, Garzon D, Matulis G, Man-sour S, Pumphrey NJ, Lissin N, et al. Natural variations at position 93 of the invariant Valpha24-Jalpha18 alpha chain of human iNKT-cell TCRs strongly impact on CD1d binding. Eur J Immunol. 2012;42:248–255. doi: 10.1002/eji.201141956. [DOI] [PubMed] [Google Scholar]
- 28.Watarai H, Nakagawa R, Omori-Miyake M, Dashtsoodol N, Taniguchi M. Methods for detection, isolation and culture of mouse and human invariant NKT cells. Nat Protoc. 2008;3:70–78. doi: 10.1038/nprot.2007.515. [DOI] [PubMed] [Google Scholar]
- 29.Renukaradhya GJ, Manickam C, Khatri M, Rauf A, Li X, Tsuji M, Rajashekara G, et al. Functional invariant NKT cells in pig lungs regulate the airway hyperreactivity: a potential animal model. J Clin Immunol. 2011;31:228–239. doi: 10.1007/s10875-010-9476-4. [DOI] [PMC free article] [PubMed] [Google Scholar]
- 30.Godfrey DI, Pellicci DG, Patel O, Kjer-Nielsen L, McCluskey J, Rossjohn J. Antigen recognition by CD1d-restricted NKTT cell receptors. Semin Immunol. 2010;22:61–67. doi: 10.1016/j.smim.2009.10.004. [DOI] [PubMed] [Google Scholar]
- 31.Zhang P, Li D, Stewart-Jones G, Shao X, Zhang Y, Chen Q, Li Y, et al. A single amino acid defines cross-species reactivity of tree shrew (Tupaia belangeri) CD1d to human invariant natural killer T (iNKT) cells. Immunology. 2009;128:500–510. doi: 10.1111/j.1365-2567.2009.03133.x. [DOI] [PMC free article] [PubMed] [Google Scholar]
- 32.Berzins SP, Cochrane AD, Pellicci DG, Smyth MJ, Godfrey DI. Limited correlation between human thymus and blood NKT cell content revealed by an ontogeny study of paired tissue samples. Eur J Immunol. 2005;35:1399–1407. doi: 10.1002/eji.200425958. [DOI] [PubMed] [Google Scholar]
- 33.Motohashi S, Okamoto Y, Yoshino I, Nakayama T. Anti-tumor immune responses induced by iNKT cell-based immunotherapy for lung cancer and head and neck cancer. Clin Immunol. 2011;140:167–176. doi: 10.1016/j.clim.2011.01.009. [DOI] [PubMed] [Google Scholar]
- 34.Getz GS, Vanderlaan PA, Reardon CA. Natural killer T cells in lipoprotein metabolism and atherosclerosis. Thromb Haemost. 2011;106:814–819. doi: 10.1160/TH11-05-0336. [DOI] [PMC free article] [PubMed] [Google Scholar]
- 35.Yang L, Jhaveri R, Huang J, Qi Y, Diehl AM. Endoplasmic reticulum stress, hepatocyte CD1d and NKT cell abnormalities in murine fatty livers. Lab Invest. 2007;87:927–937. doi: 10.1038/labinvest.3700603. [DOI] [PubMed] [Google Scholar]
- 36.Monzon-Casanova E. Rat iNKT cells: phenotype and function section of infection and immunity. Julius-Maximilians-Universität; Würzburg, Germany: 2010. p. 180. [Google Scholar]
- 37.Schneck JP. Monitoring antigen-specific T cells using MHC-Ig dimers. Immunol Invest. 2000;29:163–169. doi: 10.3109/08820130009062300. [DOI] [PubMed] [Google Scholar]
- 38.Schumann J, Voyle RB, Wei BY, MacDonald HR. Cutting edge: influence of the TCR V beta domain on the avidity of CD1d:alpha-galactosylceramide binding by invariant V alpha 14 NKT cells. J Immunol. 2003;170:5815–5819. doi: 10.4049/jimmunol.170.12.5815. [DOI] [PubMed] [Google Scholar]
- 39.Im JS, Arora P, Bricard G, Molano A, Venkataswamy MM, Baine I, Jerud ES, et al. Kinetics and cellular site of glycolipid loading control the outcome of natural killer T cell activation. Immunity. 2009;30:888–898. doi: 10.1016/j.immuni.2009.03.022. [DOI] [PMC free article] [PubMed] [Google Scholar]
Associated Data
This section collects any data citations, data availability statements, or supplementary materials included in this article.