Abstract
Objective
To evaluate the relative importance of bilabial prominence in relation to other facial profile parameters in a normal population.
Methods
Profile stimulus images of 38 individuals (28 female and 10 male; ages 19-25 years) were shown to an unrelated group of first-year students (n = 42; ages 18-24 years). The images were individually viewed on a 17-inch monitor. The observers received standardized instructions before viewing. A six-question questionnaire was completed using a Likert-type scale. The responses were analyzed by ordered logistic regression to identify associations between profile characteristics and observer preferences. The Bayesian Information Criterion was used to select variables that explained observer preferences most accurately.
Results
Nasal, bilabial, and chin prominences; the nasofrontal angle; and lip curls had the greatest effect on overall profile attractiveness perceptions. The lip-chin-throat angle and upper lip curl had the greatest effect on forehead prominence perceptions. The bilabial prominence, nasolabial angle (particularly the lower component), and mentolabial angle had the greatest effect on nasal prominence perceptions. The bilabial prominence, nasolabial angle, chin prominence, and submental length had the greatest effect on lip prominence perceptions. The bilabial prominence, nasolabial angle, mentolabial angle, and submental length had the greatest effect on chin prominence perceptions.
Conclusions
More prominent lips, within normal limits, may be considered more attractive in the profile view. Profile parameters have a greater influence on their neighboring aesthetic units but indirectly influence related profile parameters, endorsing the importance of achieving an aesthetic balance between relative prominences of all aesthetic units of the facial profile.
Keywords: Lip prominence, Perception, Attractiveness, Facial profile
INTRODUCTION
A growing body of evidence suggests that perceptions of facial profile attractiveness have changed and will continue to change over time.1,2 For the lips, some authors have suggested that fuller, more prominent lips may be perceived as more youthful and consequently, more desirable from an aesthetic viewpoint.1,2 If this change in perception is true, particularly since modern orthodontics is partly demanded and undertaken to improve facial attractiveness, it would have potentially important consequences to both orthodontic treatment planning and hard and soft tissue surgery, which can influence lip prominence.
A study by Auger and Turley,1 which assessed periodical fashion magazines spanning over 100 years, found that perceptions of the ideal female facial profile have changed throughout the 20th century. Ideals of facial beauty appear to have changed with a trend toward more protrusive lips and increased vermilion display.
Another study by Nguyen and Turley2 examined fashion magazine photographs of male models over the last 65 years from publications such as Harper's Bazaar, Vanity Fair, Vogue, and Cosmopolitan. Their findings showed that the perceptions of the male model profile have changed significantly with time, especially with respect to the lips. There has been a trend towards increasing lip protrusion, lip curl, and vermilion display. However, facial convexity and measurements in the region of the forehead and nose, including the nasofrontal angle, nasal tip angle, and nasal base angle, have remained unchanged over time. Linear measurements of the upper and lower lips to the E-line have significantly reduced with time, suggesting an increase in lip protrusion. Additionally, a significant decrease in the interlabial angle with time (representing the increased lip projection/lip curl) was observed. The labiomental angle has also increased with time, again suggesting an increased lip curl. However, vertical facial heights, i.e., the upper, middle, and lower, did not change significantly with time. The authors surmised that fuller lips were perceived to be more youthful.
Age changes in the lips are well documented and are perceived as a natural flattening of the facial profile with age, indicated by less protrusive lips and a soft tissue profile with increased age.3,4,5 Furthermore, there is an increase in ethnic diversity among fashion models; for example, African models have more voluptuous lips. Yehezkel and Turley6 evaluated changes in the profiles of African-American women presented in fashion magazines during the 20th century. The photographs of women were divided into six groups corresponding to the decade in which they were published. Twenty-six variables were measured, and significance between group differences (p < 0.01) was found for the anteroposterior lip position, the nasolabial angle, and the interlabial angle, with increased fullness and more anteriorly positioned lips in the more recent decades. No significant differences were found for the nasofrontal angle, the nasal tip angle, and the relationship of the chin to the upper face (total facial angle). A low mean total facial angle (convex profile) was consistently observed, and a number of subjects may have had a Class II skeletal relationship. The authors concluded: "Esthetic standards for the African American female profile have changed during the 20th century, and similar to standards for the white profile, show a trend towards fuller and more anteriorly positioned lips".6 Thus, it is questionable whether facial aesthetic standards of the past are applicable to present day aesthetic facial analysis.
Meanwhile, the lay public and professionals have different profile preferences.7,8,9,10 Hall et al.11 published a study designed to assess the perceived optimal profiles of African-Americans versus white Americans. A survey was conducted using profile silhouettes of 30 African Americans and 30 white patients, ranging in age from 7 to 17 years. Twenty white orthodontists, 18 African-American orthodontists, 20 white laypersons, and 20 African-American laypersons evaluated the profiles. The preference of each rater for each of the 60 profiles was scored on a visual analog scale. Eighteen cephalometric variables were measured for each profile, and statistical analyses were performed on the profiles. The results showed that the following six cephalometric variables were significant: the Z-angle, skeletal convexity at A-point, upper lip prominence, lower lip prominence, nasomental angle, and mentolabial sulcus. All raters preferred the African American sample to have a greater profile convexity than they preferred for the white sample.11 The raters preferred the African-American sample with upper and lower lips that were more prominent than the white sample. However, only the choice of African-American orthodontists in the African-American sample was significantly different for this parameter. White orthodontists gave the highest mean scores for the profile chosen; whereas, African-American laypersons gave the lowest scores.
When a patient is assessed by his/her profile, the position of the profile features are usually assessed in relation to each other. The lips are most often related to the relative prominence of the nose and chin.12 More specifically, the evaluation of lip prominence may be undertaken in relation to certain reference lines, which include12 the E-line (Ricketts13,14), S-line (Steiner15,16), Z-line (Merrifield17), H-line (Holdaway18,19), Subnasale-Pogonion line (Burstone20,21), Riedel plane (Riedel22), and the true vertical through subnasale (SnV) - wherein, the prominence of the lips may be related to a true vertical line passing through subnasale.12
The purpose of this investigation was to evaluate the relative importance of bilabial prominence in relation to the overall facial profile attractiveness and the relative prominences of other facial profile parameters in a normal population by using a different approach to traditional attractiveness perception research.
MATERIALS AND METHODS
Previous research in this field has predominately used one of two methodologies: the profile silhouette manipulation or the digital photographic manipulation. In traditional attractiveness research, a facial profile is chosen or created then only one facial parameter is incrementally altered to create a series of images, which are then rated in terms of attractiveness by a group of observers. In the present study, a novel methodology was used. The facial profiles of normal male and female subjects were used, but the observers were asked specific questions regarding the subjects' attractiveness in order to rate each profile parameter that may influence the perceptions of attractiveness (e.g., do you think the chin is too far forward, just right, or too far back, etc.). The responses were analyzed in relation to the angular and linear aesthetic analysis of each subject image to assess whether any trends were apparent (Figures 1 and 2). Unaltered images were used to most closely simulate real-world scenarios of how observers discern facial profile attractiveness. To make inferences about a population from a sample, a minimal number of representative individuals should be included. While university students may not always be adequately representative of the overall population, they were willing participants, and this population provided enough numbers for group separation in terms of age, gender, and ethnic background. Since the scatter of the data from previous studies was not defined and there is no industry-accepted value of clinical significance for the profile characteristics under investigation, a sample size of at least 40 was recommended. The present study was a part of an on-going project that had commenced in the year 2000, for which images had been obtained. After 2005, ethical permission from King's College London was required for students' images in this study, but if this was a new project, ethical committee approval would have been deemed mandatory. If identifiable images from dental students were used without anonymization, their written informed consent was obtained participation in the study.
Figure 1.
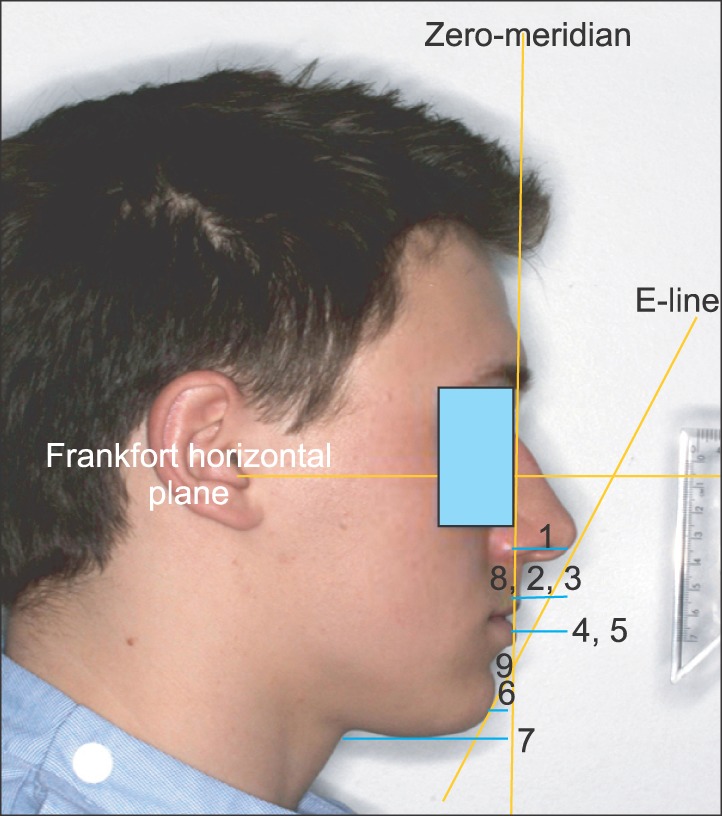
The following linear measurements were used in this investigation: 1, Zero-meridian line (a vertical line dropped from soft tissue nasion, perpendicular to the Frankfort plane) to the pronasale (pr); 2, zero-meridian line to the labrale superius (ul); 3, labrale superius to the Ricketts's E-line (ule); 4, zero-meridian line to the labrale inferius (ll); 5, labrale inferius to the Rickett's E-line (lle); 6, zero-meridian line to the soft tissue pogonion (poe); 7, submental length measured from the C-point to the menton (sml); 8, upper lip curl (ulc), measurement of the maximum concavity from a line drawn between the labrale superius and the subnasale; and 9, lower lip curl (llc), maximum concavity from the H-line of Holdaway.
Figure 2.
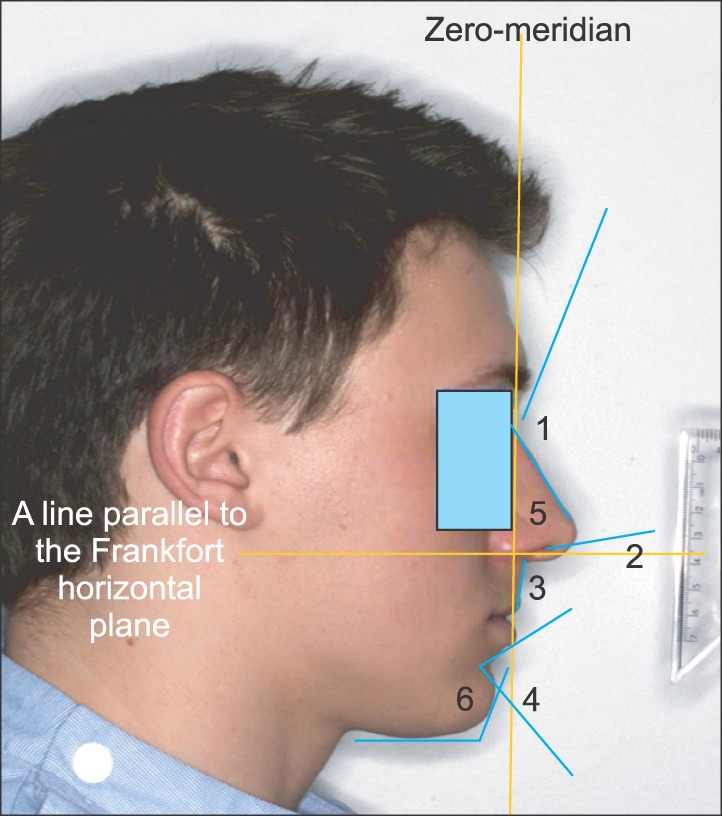
The following angular measurements were used in this investigation: 1, Nasofrontal angle defined as the inner angle formed by a line tangent to the glabella and a line tangent to the nasal dorsum intersecting at the nasion (nfr); 2, nasolabial angle defined as the inner angle formed by a line tangent to the nasal columella and a line tangent to the upper lip intersecting at the subnasale (nl); 3, lower component of the nasolabial angle defined as the inner angle formed by a line parallel to the Frankfort plane and a line tangent to the upper lip intersecting at the subnasale (lnl); 4, mentolabial angle defined as the inner angle between a lines tangent to the lower lip and the soft tissue chin intersecting at the sublabiale (mla); 5, nasofacial angle defined as the inner angle formed by the intersection of the facial plane, glabella to pogonion, and the nasal dorsal plane, nasion to pronasale (nfa); and 6, lip-chin-throat angle defined as the inner angle between the submental plane and a line between the labrale inferius and the soft tissue pogonion (lct).
In the first phase of this investigation, the profile photographs of King's College London students in their 3rd to 5th years were taken in a standardized manner by one operator (first author) following a standardized protocol: the spectacles and any head coverings of the students were removed, and right-sided profile photographs were taken against a plain background. Participants held a ruler parallel to their face to indicate the facial midline with respect to the photographer to record linear measurements during analysis of the images without the risk of magnification errors, invalidating the measurements. Thirty-eight students (28 female, 10 male) agreed to take part in the photographic acquisition phase, and an example of is shown in Figure 3.
Figure 3.
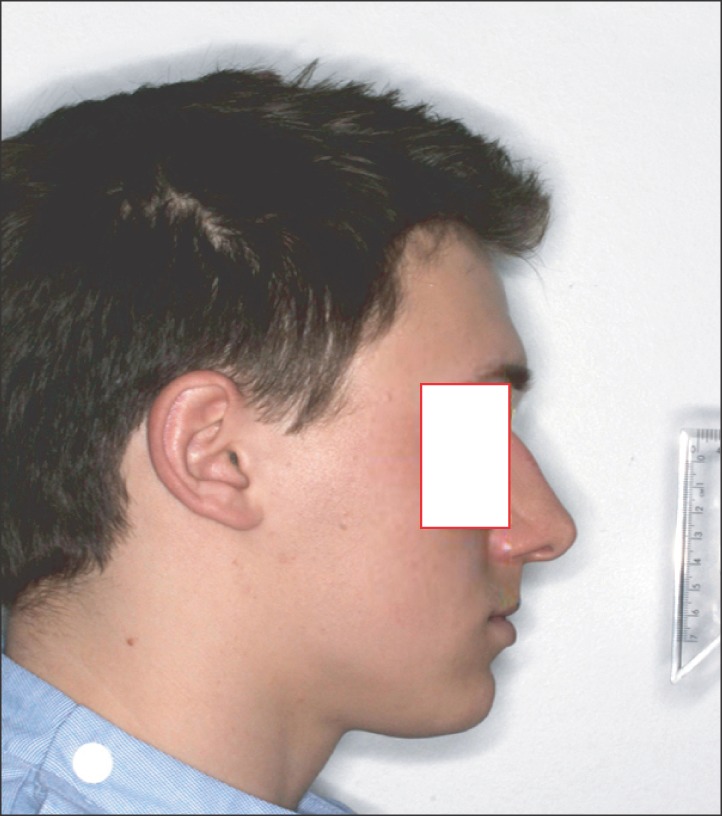
Example of a stimulus photograph.
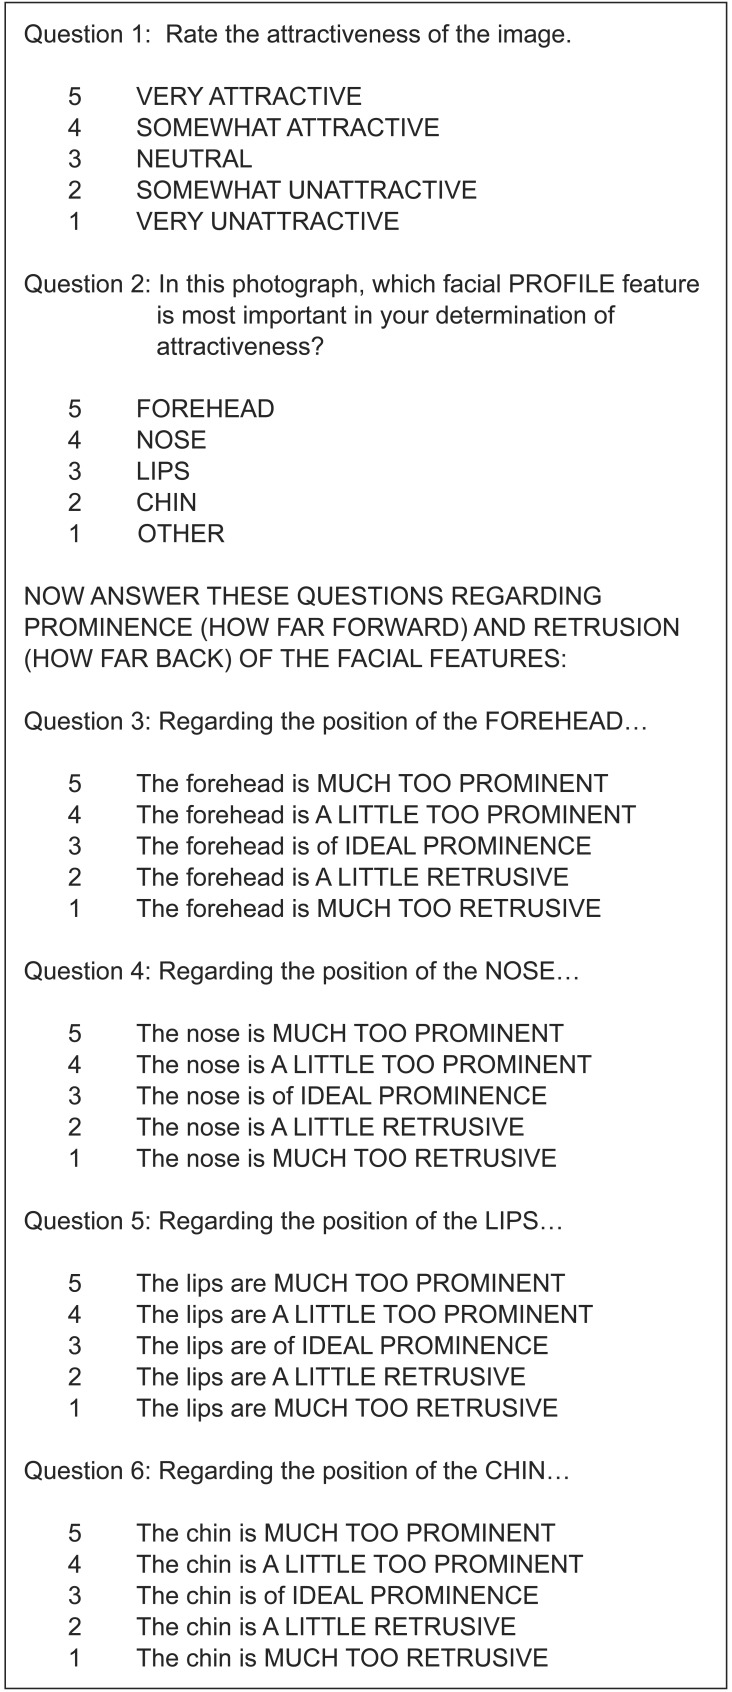
In the second phase, the aforementioned photographs (stimulus photographs) were shown to a different and unrelated group of King's College London students aged 18-24 years (n = 45). Most of these students had just arrived for their first year, and thereby did not know individuals in the stimulus photographs. However, three of these observers did indicate cognizance of at least one individual and were excluded from the study. We obtained 42 completed results. The photographs were individually viewed on a 17-inch computer monitor with the observers receiving standardized instructions for previewing. The observers were asked not to talk about their experimental experience with their colleagues. No time limit was set for completion of the questionnaires, but most observers required approximately 30 minutes. The questionnaire consisted of six questions (Figure 4), and each question had five possible answers arranged in a Likert-type scale for questions 1-6 and as a simple list for question 2. The measurements were tabulated into a Microsoft Excel spreadsheet and were forwarded to a professional biostatistician (MS) for analysis.
Figure 4.
Observer questionnaire.
Statistical methodology
Statistical analysis was performed using the statistical program Stata, version 12.1 (StataCorp LP, College Station, TX, USA). Questions 1-6 were analyzed by ordered logistic regression,23 because the response variable had more than two values and was categorically ordered (i.e., a larger value corresponded to a higher response). Question 2 was just a selection of a feature rather than a graded response, so a simple frequency analysis was used with a null hypothesis that all features had an equal likelihood to be chosen. The variables in question 2 were not ordered in a natural manner, as in questions 1 and 3-6.
Then, Bayesian Information Criterion (BIC) was used to select the subset of variables that had the greatest effect on how the observers answered each question.24 The BIC is a criterion used to select a model that is most valid for the data. The BIC identifies the best model for the data set by penalizing any models that have parameters that only add complexity rather than validity out of a range of all the possible models. Bayesian probability is the name given to several related interpretations of probability, which have the notion of probability as a partial belief, rather than a frequency. This allows the application of probability to a greater variety of propositions.
RESULTS
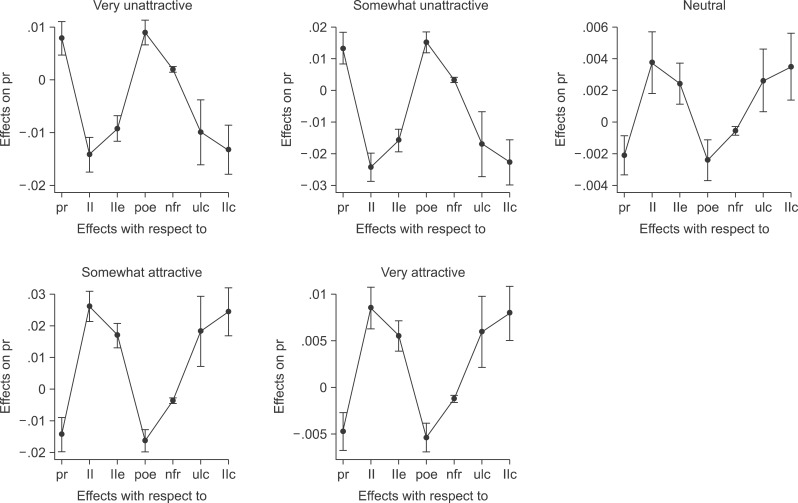
The BIC inferred that the zero-meridian line to the pronasale (pr), zero-meridian line to the labrale inferius (ll), labrale inferius to Rickett's E-line (lle), zero-meridian line to the soft tissue pogonion (poe), nasofrontal angle (nfr), upper lip curl (ulc), and lower lip curl (llc) had the greatest effect on how observers answered question 1 (Table 1). Figure 5 shows the influence of these variables on each response. The plots are probabilities associated with each value of the independent variable.
Table 1.
Odds ratio for question 1
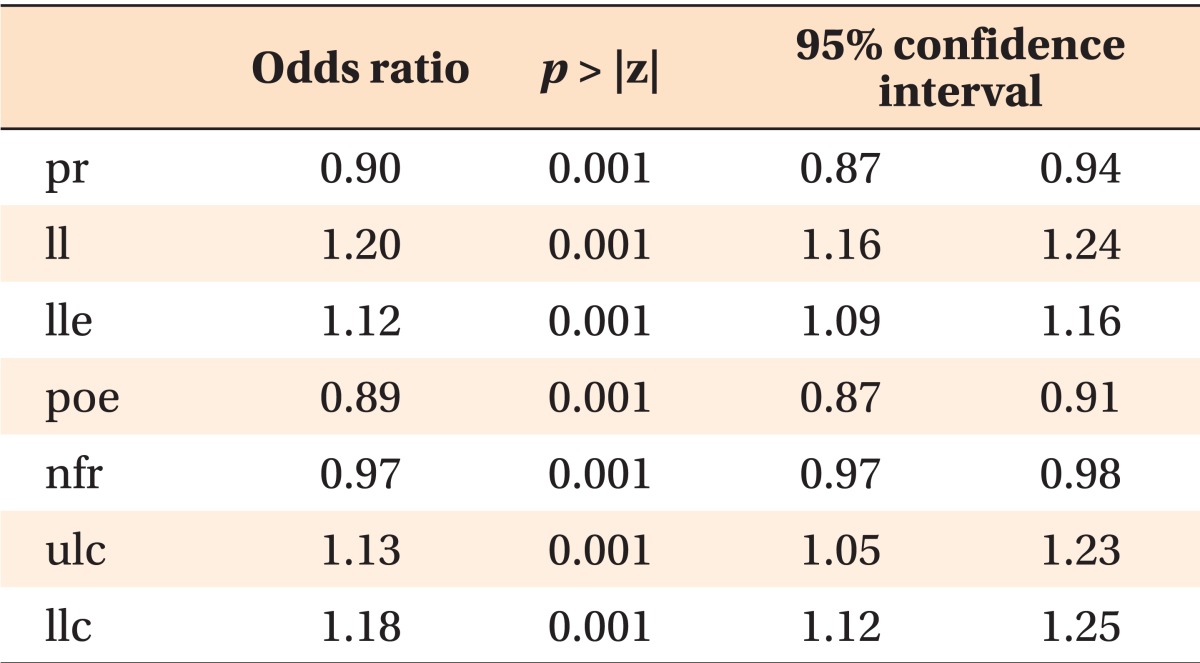
Figure 5.
A subset of the Bayesian Information Criterion-selected variables that influenced the responses to question 1. Bars on the plots represent the 95% confidence intervals. Refer Figures 1 and 2 for the measurements.
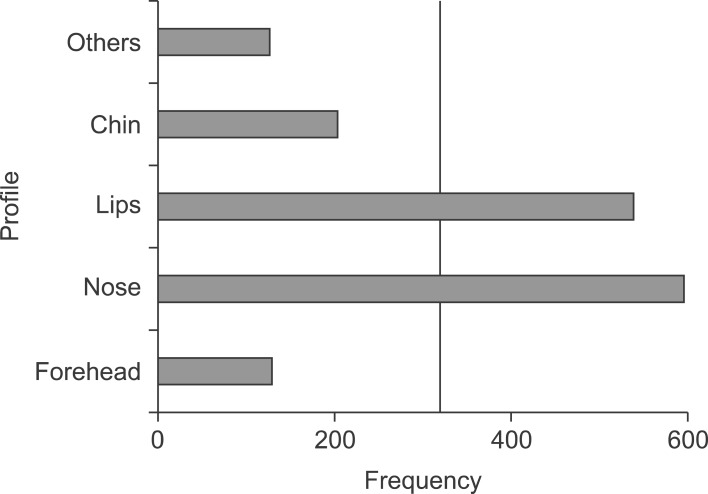
There were 38 images viewed by 42 observers, each of whom had five response choices (38 × 42) / 5 = 319.2. In Figure 6, the vertical line represents the value 319.2, which corresponds to the null hypothesis (Tables 2 and 3).
Figure 6.
Frequency analysis for question 2.
Table 2.
Frequency analysis for question 2
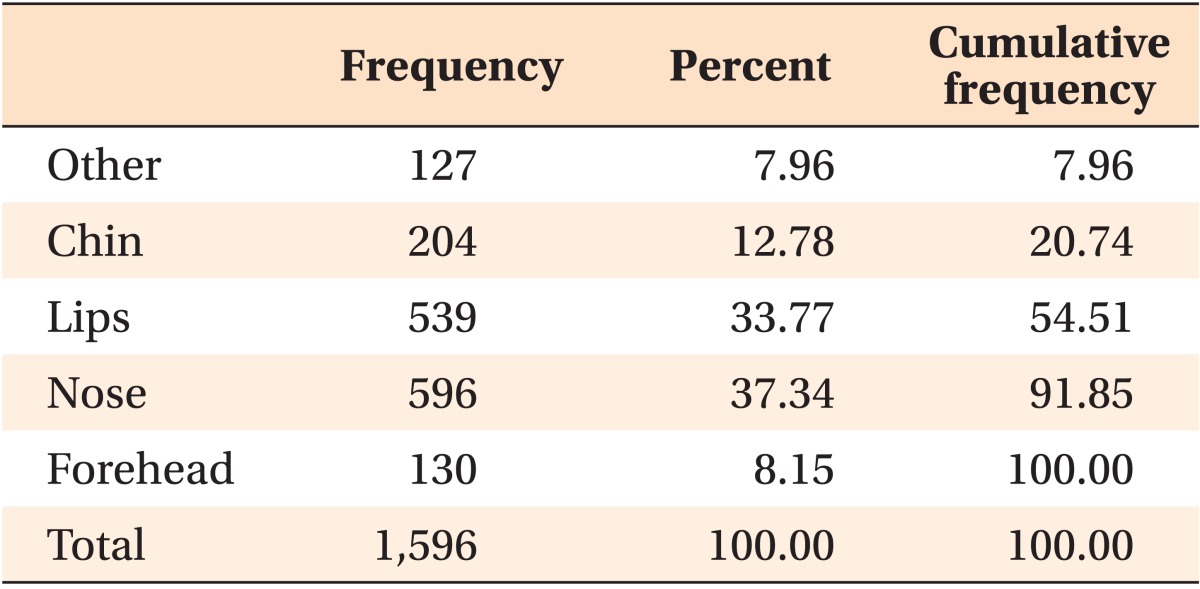
Table 3.
Chi-square analysis for question 2
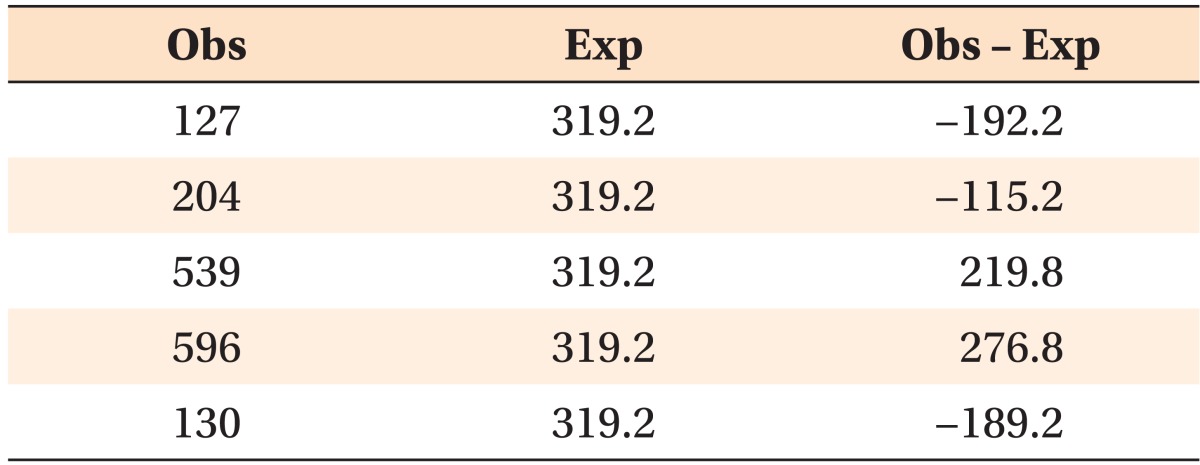
Obs, observed; Exp, expected.
The null hypothesis was that all features had an equal likelihood to be chosen.
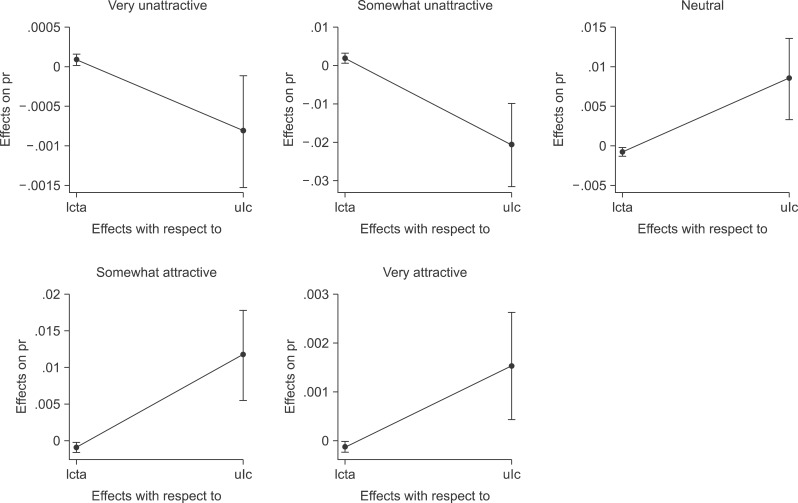
The BIC inferred that the lip-chin-throat angle (lcta) and ulc had the greatest effect on how observers answered question 3 (Table 4). Figure 7 shows the influence of these variables on each response.
Table 4.
Odds ratio for question 3

Figure 7.
A subset of the Bayesian Information Criterion-selected variables that influenced the responses to question 3. Bars on the plots represent the 95% confidence intervals. Refer Figures 1 and 2 for the measurements.
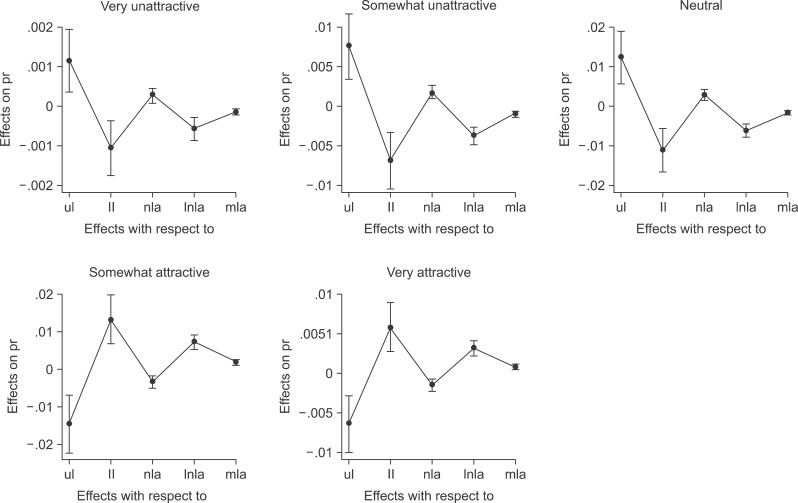
The BIC inferred that the zero-meridian line to the labrale superius (ul), ll, nasolabial angle (nla), lower component of the nasolabial angle (lnla), and mentolabial angle (mla) had the greatest effect on how observers answered question 4 (Table 5). Figure 8 shows the influence of these variables on each response.
Table 5.
Odds ratio for question 4
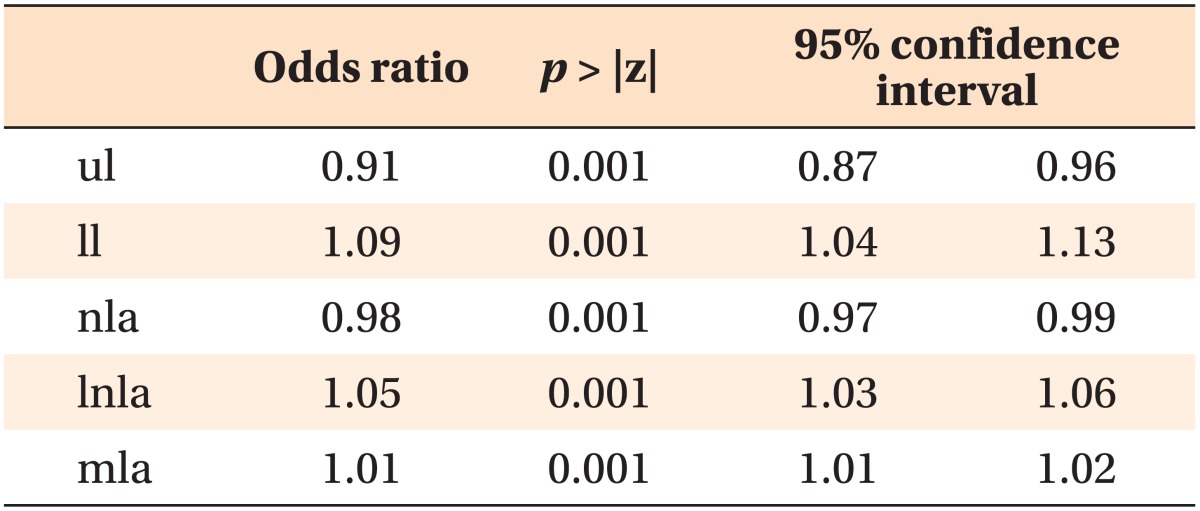
Figure 8.
A subset of the Bayesian Information Criterion-selected variables that influenced the responses to question 4. Bars on the plots represent the 95% confidence intervals. Refer Figures 1 and 2 for the measurements.
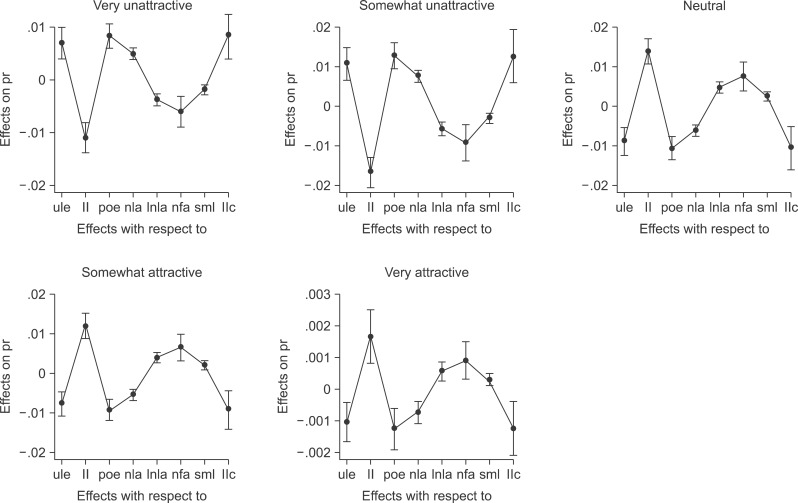
The BIC inferred that the labrale superius to the Rickett's E-line (ule), ll, poe, nla, lnla, nasofacial angle (nfa), submental length (sml), and llc had the greatest effect on how observers answered question 5 (Table 6). Figure 9 shows the influence of these variables on each response.
Table 6.
Odds ratio for question 5
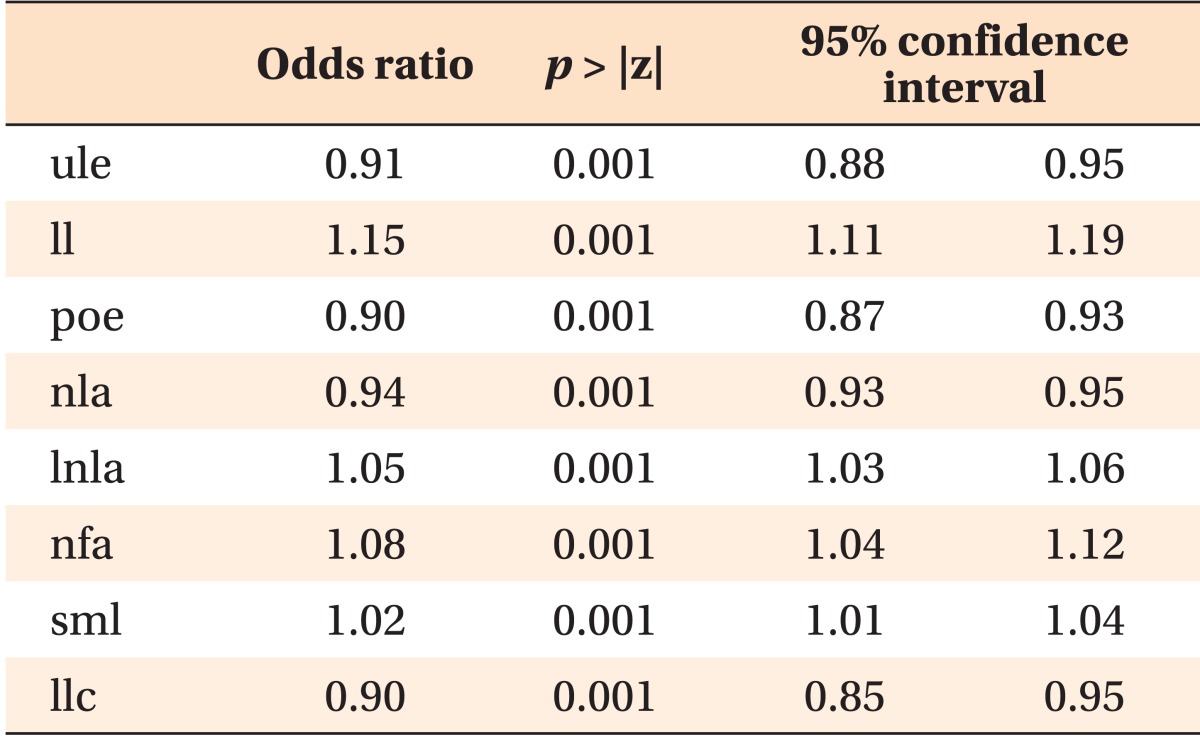
Figure 9.
A subset of the Bayesian Information Criterion-selected variables that influenced the responses to question 5. Bars on the plots represent the 95% confidence intervals. Refer Figures 1 and 2 for the measurements.
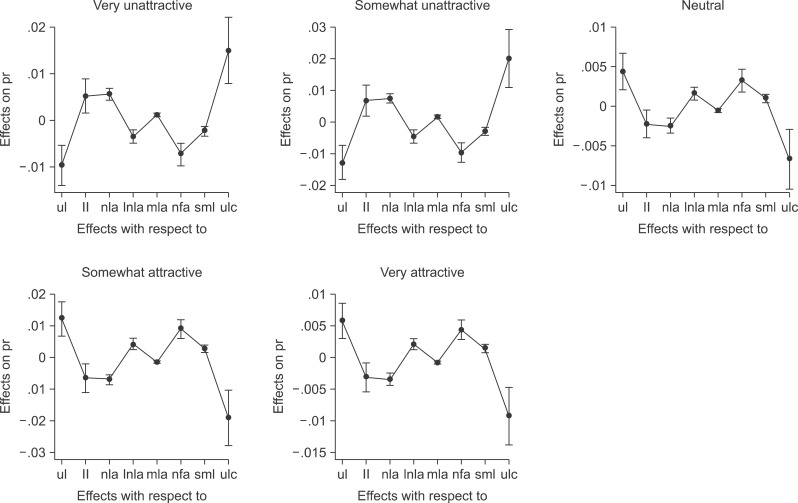
The BIC inferred that ul, ll, nla, lnla, mla, nfa, sml, and ulc had the greatest effect on how observers answered question 6 (Table 7). Figure 10 shows the influence of these variables on each response.
Table 7.
Odds ratio for question 6
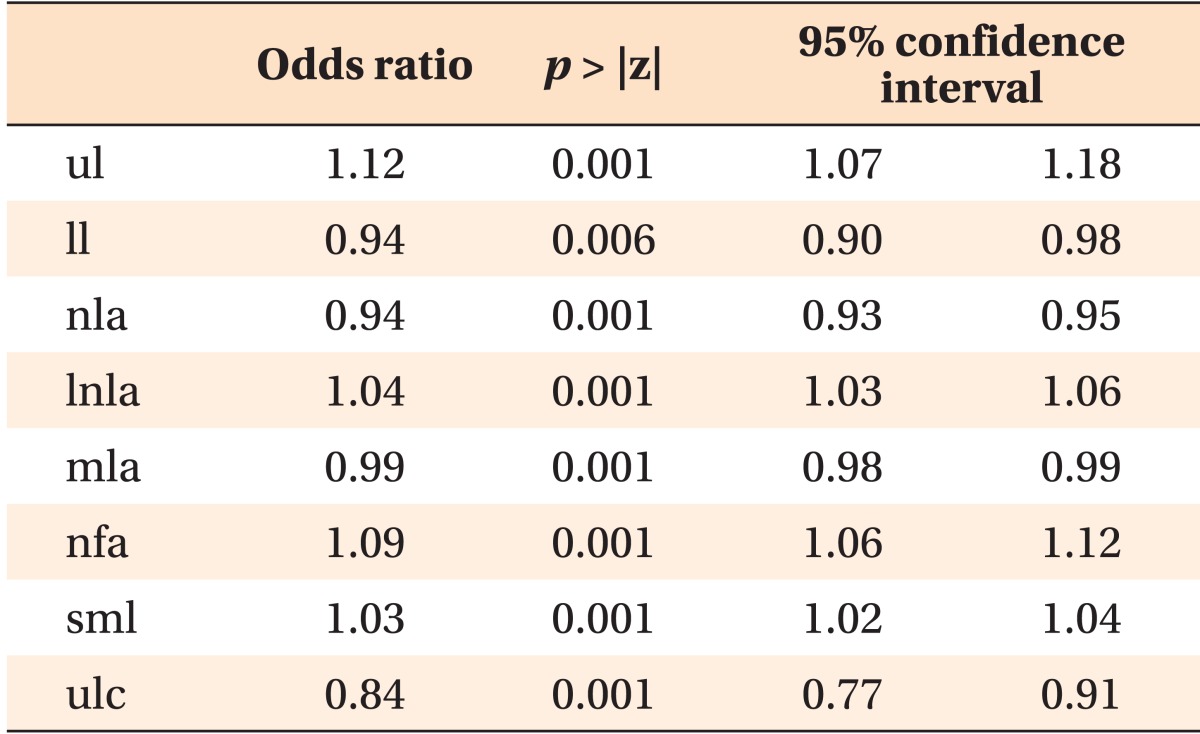
Figure 10.
A subset of the Bayesian Information Criterion-selected variables that influenced the responses to question 6. Bars on the plots represent the 95% confidence intervals. Refer Figures 1 and 2 for the measurements.
DISCUSSION
An odds ratio (OR) describes the strength of association between two variables. In the odds ratio representation, a ratio of 1 has no effect. If OR > 1, then an increase in the parameter value indicates an increase in response, and if OR < 1, an increase in the parameter corresponds to a decrease in the response. For example, in the OR representation in Table 1, increased values of ll, lle, ulc, and llc are related to increased attractiveness, as are decreased values of pr, poe, and nfr. This is consistent with previous works by Auger and Turley,1 Nguyen and Turley,2 Yehezkel and Turley,6 and Hall et al.,11 with an increasing preference towards a more protrusive lip position. However, the present study also found that an increased distance from the lle was associated with increased attractiveness according to the responses to question 1. This contradicts both Auger and Turley's1 and Nguyen and Turley's2 findings. Furthermore, Hall et al.11 used a different age group (7-17 years) that did not overlap with the age group of observers in this study. Therefore, age changes of the lips have been demonstrated.3,4
Analysis of question 2 results revealed that many observers perceived the prominence of both the nose and lips to be more important than the prominence of the forehead or chin, or any other profile feature. Figure 6 illustrates this graphically, and Table 3 numerically describes the variance from the null hypothesis that all profile features have an equally likelihood to be chosen. The importance of the lip prominence in question 2 again supports the aforementioned research cited. In question 3, there was an OR value of 1.18 for ulc, which was even higher than the OR for ulc in question 1 (OR = 1.13). This supports conclusions by Auger and Turley1 and Nguyen and Turley.2 In contrast, question 4 suggests that a less protrusive upper lip is a positive aesthetic value when observers rate the prominence of the nose. Lower lip prominence, within normal limits, was again associated with greater perceived attractiveness. Question 5 asked observers to rate the prominence of the lips. Again, the OR displayed preferences towards increased lower lip prominence but also for decreased llc.
Overall, the OR was most positive (OR = 1.20) for the ll prominence and the llc (OR = 1.18) in question 1, the ulc in question 3 (OR = 1.18), and the ll prominence in question 5 (OR = 1.15). The lowest OR (signifying a decrease in the likelihood of the response) was associated with an OR value of 0.84 in question 5 for the ulc.
The plots demonstrate the contribution of each variable (e.g., ulc or nla) to each level of response (answering 1-6 on the questionnaire) within each of the questions (1 and 3-6). For example, if question 6 is considered, then of the 15 possible variables chosen, the response is best described statistically by the subset of 8 variables in Figure 10 and Table 7 (i.e., the ul, ll, nla, lnla, mla, nfa, sml, and ulc). A trend can be discerned, because when the ulc decreases, the ul increases, as the response progresses from questions 1-5. Thus, when observers considered the chin position in the profile view to be much too retrusive (response 1), then it was more likely because of the value of the ulc and less likely because of the value of the ul. Similarly, with response 5 in question 6, if the observer believed the chin to be much too prominent, their response was most likely influenced by the ul and least likely influenced by the ulc-the plots involve average marginal effects. This is the effect of a unit change in the parameter, which holds the other variables constant and averages over all observations. Therefore, numerically, if you consider response 1 for question 6, then a 1-unit change in the ulc (i.e., 1 mm ulc increase) will change the probability of observing a very retrusive chin by 0.015% or 1.5%.
There were other discernable trends in the plots.
Question 1 - If the observer rated the image attractive or very attractive, they were most likely to have been influenced by the ll and llc values and not by the poe or pr. If the observer rated the image unattractive or very unattractive, it is likely that they were influenced most by the pr and poe values and not by the ll or llc values.
Question 3 - With regard to the position of the forehead in the profile view, if the observer responded that the forehead was retrusive or very retrusive, it is most likely that they were influenced by the lcta and least likely influenced by the ulc. If the observer responded that the forehead was too prominent or much too prominent, it is most likely that this response was influenced by the ulc value and least likely influenced by the lcta value.
Question 4 - With regard to the position of the nose in the profile view, if the observer responded that the nose was retrusive or very retrusive, it is most likely that they were influenced by the ul and least likely influenced by the ll. If the observer responded that the nose was too prominent or much too prominent, it is most likely that this response was influenced by the ll value and least likely influenced by the ul value.
Question 5 - With regard to the position of the lips in the profile view, if the observer responded that the lips were retrusive or very retrusive, it is most likely that they were influenced by the ule, poe, and llc and least likely influenced by the ll. If the observer responded that the lips were too prominent or much too prominent, it is most likely that this response was influenced by the ll value and least likely influenced by the ule, poe, and llc values as measured on the stimulus photographs.
Question 6 - Question 6 has been interpreted in the aforementioned text. However, with regard to the position of the chin in the profile view, observers displayed a positive OR for the ll, lnla, nfa, and sml and negative ORs for the ule, poe, nla, and llc.
To the best of our knowledge, an analysis of this detail has not been undertaken previously. Most analyses stop at the overall model without looking at the responses to each item. Further investigation is required to analyze the merit of the trends described, which would potentially provide useful data for facial aesthetic analysis.
CONCLUSION
Perceptions of facial profile attractiveness are multifactorial. This investigation provides support to the hypothesis that more prominent lips, within normal limits, are perceived to be more attractive in the profile view. It appears that profile parameters have a greater influence on their neighboring aesthetic units (e.g. the nasolabial angle has a considerable influence on the perceptions of nasal prominence). However, the results also provide evidence that profile parameters further away also have an influence on perceptions of indirectly related profile parameters (e.g., the nasofrontal angle on chin prominence). This further endorses the importance of achieving aesthetic balance between the relative prominences of all the aesthetic units of the facial profile.
Footnotes
The authors report no commercial, proprietary, or financial interest in the products or companies described in this article.
References
- 1.Auger TA, Turley PK. The female soft tissue profile as presented in fashion magazines during the 1900s: a photographic analysis. Int J Adult Orthodon Orthognath Surg. 1999;14:7–18. [PubMed] [Google Scholar]
- 2.Nguyen DD, Turley PK. Changes in the Caucasian male facial profile as depicted in fashion magazines during the twentieth century. Am J Orthod Dentofacial Orthop. 1998;114:208–217. doi: 10.1053/od.1998.v114.a86137. [DOI] [PubMed] [Google Scholar]
- 3.Mamandras AH. Growth of lips in two dimensions: a serial cephalometric study. Am J Orthod. 1984;86:61–66. doi: 10.1016/0002-9416(84)90277-x. [DOI] [PubMed] [Google Scholar]
- 4.Mamandras AH. Linear changes of the maxillary and mandibular lips. Am J Orthod Dentofacial Orthop. 1988;94:405–410. doi: 10.1016/0889-5406(88)90129-1. [DOI] [PubMed] [Google Scholar]
- 5.Bhatia SN, Leighton BC. A manual of facial growth: a computer analysis of longitudinal cephalometric growth data. Oxford: Oxford University Press; 1993. [Google Scholar]
- 6.Yehezkel S, Turley PK. Changes in the African American female profile as depicted in fashion magazines during the 20th century. Am J Orthod Dentofacial Orthop. 2004;125:407–417. doi: 10.1016/j.ajodo.2003.05.007. [DOI] [PubMed] [Google Scholar]
- 7.Prahl-Andersen B, Boersma H, van der Linden FP, Moore AW. Perceptions of dentofacial morphology by laypersons, general dentists, and orthodontists. J Am Dent Assoc. 1979;98:209–212. doi: 10.14219/jada.archive.1979.0456. [DOI] [PubMed] [Google Scholar]
- 8.Kerr WJ, O'Donnell JM. Panel perception of facial attractiveness. Br J Orthod. 1990;17:299–304. doi: 10.1179/bjo.17.4.299. [DOI] [PubMed] [Google Scholar]
- 9.Bell R, Kiyak HA, Joondeph DR, McNeill RW, Wallen TR. Perceptions of facial profile and their influence on the decision to undergo orthognathic surgery. Am J Orthod. 1985;88:323–332. doi: 10.1016/0002-9416(85)90132-0. [DOI] [PubMed] [Google Scholar]
- 10.Foster EJ. Profile preferences among diversified groups. Angle Orthod. 1973;43:34–40. doi: 10.1043/0003-3219(1973)043<0034:PPADG>2.0.CO;2. [DOI] [PubMed] [Google Scholar]
- 11.Hall D, Taylor RW, Jacobson A, Sadowsky PL, Bartolucci A. The perception of optimal profile in African Americans versus white Americans as assessed by orthodontists and the lay public. Am J Orthod Dentofacial Orthop. 2000;118:514–525. doi: 10.1067/mod.2000.109102. [DOI] [PubMed] [Google Scholar]
- 12.Naini FB. Facial aesthetics: concepts and clinical diagnosis. Oxford: Wiley-Blackwell; 2011. [Google Scholar]
- 13.Ricketts RM. A foundation for cephalometric communication. Am J Orthod. 1960;46:330–357. [Google Scholar]
- 14.Ricketts RM. The value of cephalometrics and computerized technology. Angle Orthod. 1972;42:179–199. doi: 10.1043/0003-3219(1972)042<0179:TVOCAC>2.0.CO;2. [DOI] [PubMed] [Google Scholar]
- 15.Steiner CC. Cephalometrics for you and me. Am J Orthod. 1953;39:729–755. [Google Scholar]
- 16.Steiner CC. Cephalometrics in clinical practice. Angle Orthod. 1959;29:8–29. [Google Scholar]
- 17.Merrifield LL. The profile line as an aid in critically evaluating facial esthetics. Am J Orthod. 1966;52:804–822. doi: 10.1016/0002-9416(66)90250-8. [DOI] [PubMed] [Google Scholar]
- 18.Holdaway RA. A soft-tissue cephalometric analysis and its use in orthodontic treatment planning. Part I. Am J Orthod. 1983;84:1–28. doi: 10.1016/0002-9416(83)90144-6. [DOI] [PubMed] [Google Scholar]
- 19.Holdaway RA. A soft-tissue cephalometric analysis and its use in orthodontic treatment planning. Part II. Am J Orthod. 1984;85:279–293. doi: 10.1016/0002-9416(84)90185-4. [DOI] [PubMed] [Google Scholar]
- 20.Burstone CJ. Lip posture and its significance in treatment planning. Am J Orthod. 1967;53:262–284. doi: 10.1016/0002-9416(67)90022-x. [DOI] [PubMed] [Google Scholar]
- 21.Burstone CJ, James RB, Legan H, Murphy GA, Norton LA. Cephalometrics for orthognathic surgery. J Oral Surg. 1978;36:269–277. [PubMed] [Google Scholar]
- 22.Riedel RR. An analysis of dentofacial relationships. Am J Orthod. 1957;43:103–119. [Google Scholar]
- 23.Bender R, Grouven U. Ordinal logistic regression in medical research. J R Coll Physicians Lond. 1997;31:546–551. [PMC free article] [PubMed] [Google Scholar]
- 24.Weakliem DL. A critique of the bayesian information criterion for model selection. Soc Methods Res. 1999;27:359–357. [Google Scholar]


