

Abstract
Functional maturation of astroglia is characterized by the development of a unique, ramified morphology and the induction of important functional proteins, such as glutamate transporter GLT1. Although pathways regulating the early fate specification of astroglia have been characterized, mechanisms regulating postnatal maturation of astroglia remain essentially unknown. Here we used a new in vivo approach to illustrate and quantitatively analyze developmental arborization of astroglial processes. Our analysis found a particularly high increase in the number of VGluT1+ neuronal glutamatergic synapses that are ensheathed by processes from individual developing astroglia from postnatal day (P) 14 to P26, when astroglia undergo dramatic postnatal maturation. Subsequent silencing of VGluT1+ synaptic activity in VGluT1 KO mice significantly reduces astroglial domain growth and the induction of GLT1 in the cortex, but has no effect on astroglia in the hypothalamus, where non-VGluT1+ synaptic signaling predominates. In particular, electron microscopy analysis showed that the loss of VGluT1+ synaptic signaling significantly decreases perisynaptic enshealthing of astroglial processes on synapses. To further determine whether synaptically released glutamate mediates VGluT1+ synaptic signaling, we pharmacologically inhibited and genetically ablated metabotropic glutamate receptors (mGluRs, especially mGluR5) in developing cortical astroglia and found that developmental arborization of astroglial processes and expression of functional proteins, such as GLT1, is significantly decreased. In summary, our genetic analysis provides new in vivo evidence that VGluT1+ glutamatergic signaling, mediated by the astroglial mGluR5 receptor, regulates the functional maturation of cortical astroglia during development. These results elucidate a new mechanism for regulating the developmental formation of functional neuron-glia synaptic units.
Keywords: astroglial mGluR5, developmental maturation, peripheral astroglial process, VGluT1
Introduction
Although the peak of astrogliogenesis occurs during the late embryonic to early postnatal stages [embryonic day 18 to postnatal day (P) 7] in various rodent CNS regions (Sauvageot and Stiles, 2002; Tien et al., 2012), newly born immature astroglia do not possess uniquely ramified morphology with a large number of fine processes (50–80 nm in diameter), which is typically seen in adult mammalian astroglia, especially the gray matter protoplasmic astroglia. These fine processes, termed “peripheral astroglial processes” (PAPs; Derouiche and Frotscher, 2001; Derouiche et al., 2002), extensively ensheath synapses and are inserted with important membrane proteins. Similarly, several important astroglial genes, including SLC1A2 (Furuta et al., 1997; Holmseth et al., 2012), connexin 43 and 30 (Nagy et al., 1999), and the inwardly rectifying potassium channel Kir4.1 (Olsen et al., 2006; Seifert et al., 2009), are also developmentally induced within 3–4 weeks postnatally. More recent transcriptome analysis has further characterized genome-wide expression changes in early developing astroglia (Cahoy et al., 2008), implicating a global molecular maturation of developing astroglia.
Recent studies have identified several intrinsic pathways, i.e., Jak/STAT (Janus kinase/signal transducer and activator of transcription; Bonni et al., 1997), BMP-SMAD (bone morphogenic protein-Sma and Mad-related protein; Nakashima et al., 2001), Notch/NFIA (Notch/nuclear factor I-A; Deneen et al., 2006), as well as extrinsic gliogenesis signals, such as ciliary neurotrophic factor (Song and Ghosh, 2004), cardiotrophin 1 (Barnabé-Heider et al., 2005), and leukemia inhibitory factor (Bonaguidi et al., 2005), that regulate astroglial fate specification from neural stem cells. In contrast, questions about how developing astroglia acquire their unique morphology and how characteristically functional astroglial genes are induced during the in vivo maturation process remain largely unexplored. Neuronal signaling has long been speculated to play an important role in the developmental maturation of astroglia (Freeman, 2010). Molecular analysis in cultured astroglia showed that GLT1 and connexin 43/30 expression is highly induced in astroglia that are cocultured with neurons (Swanson et al., 1997; Koulakoff et al., 2008; Yang et al., 2009), mimicking the in vivo developmental induction of these astroglial genes. In addition, direct application of glutamate to cultured astroglia induces rapid filopodia motility of astroglial processes (Lavialle et al., 2011). Neuronal activity has also been closely associated with structural plasticity of adult astroglial processes in vivo (Genoud et al., 2006; Theodosis et al., 2008). Despite long speculation and previous associative observations, the question of whether neuronal signaling, especially glutamatergic activity, directly regulates developmental arborization of astroglial processes and the induction of functional proteins, such as GLT1, in astroglia remains unanswered. In this study, we specifically investigated the roles of in vivo VGluT1+ neuronal glutamatergic to astroglial mGluR5 signaling in the morphological and molecular maturation of cortical astroglia during development.
Materials and Methods
Animals.
The EAAT2 tdTomato (tdT) transgenic mice were generated as previously described (Yang et al., 2011). Bacterial artificial chromosome (BAC) ALDH1L1 translating ribosome affinity purification (TRAP) transgenic mice were obtained from the Gene Expression Nervous System Atlas (GENSAT) project. The VGluT1 knockout (VGluT1 KO) mice were a gift from Dr. Robert Edwards (University of California, San Francisco). The BAC GLT1 eGFP transgenic mice were a gift from Dr. Jeffrey Rothstein (Johns Hopkins University). The GFAP CreERT2 transgenic mice were a gift from Dr. Flora Vaccarino (Yale University). The mGluR5f/f mice were obtained from Dr. Anis Contractor (Northwestern University). The Rosa26-mT/mG mice were a kind gift of Dr. James Schwob (Tufts University). The BAC glial high-affinity glutamate transporter (GLAST)-CreERT mice [B6.Cg-Tg (Slc1a3-cre/ERT)1Nat/J, stock #012586] were obtained from the Jackson Laboratory. All mice were maintained on a 12 h light/dark cycle with food and water available ad libitum. Mice of either sex were used for all experiments. All procedures were in strict accordance with the National Institutes of Health Guide for the Care and Use of Laboratory Animals and were approved by the Tufts University Institutional Animal Care and Use Committee.
Adeno-associated virus preparation and intracranial virus injection.
The EF1α-DIO-eYFP adeno associated viral construct (#27056) was obtained from Addgene. EF1α-DIO-eYFP adeno-associated virus (AAV) was prepared from the University of North Carolina vector core (Chapel Hill, NC). The pups (P1–P3) were anesthetized by placing on ice for a few minutes. A mixture of AAV (2 μl) and dye (0.5 μl) was injected bilaterally in the cortex by piercing through the skull and skin with a thin glass pipette, as previously described (Broekman et al., 2006). Animals were placed on a warming pad following injection for recovery (active movement) before returning to the cage.
Drug treatment.
Tamoxifen (4-OHT; Sigma-Aldrich) was resuspended at 20 mg/ml in ethanol and diluted into sunflower seed oil at a final concentration of 2 mg/ml in 10% of ethanol. GFAP CreERT2/Rosa26-mT/mG double-positive mice received three consecutive intraperitoneal injections (0.3 mg/d) starting at P21. Mice were perfused 3 d after the last injection. For GLAST-CreERT/mGluR5f/f mice, a daily intraperitoneal injection of 20 μl 4-OHT (50 mg/kg) was administered from P4 to P9 for a total dose of 0.25 mg. For in vitro astroglia cultures, cells were cultured in serum-free medium with 1 μm of 4-OHT for 12 h and then switched to a regular serum-complemented culture medium for 12 h (without 4-OHT), beginning day 1 in vitro (DIV 1). The switch of culture medium was continued for another 3 d (DIV 4). Then only regular astroglia culture medium was used until DIV 10 for collection. For In vivo MPEP injection, MPEP (Sigma-Aldrich) was dissolved in 0.9% NaCl (2 mg/ml). A daily intraperitoneal injection of MPEP at a dose of 10 mg/kg was given to mice from ages P14–P21. Control littermates received saline injections at the same period.
Immunohistochemistry and confocal imaging.
Animals were deeply anesthetized with ketamine (100 mg/kg) plus xylazine (10 mg/kg) in saline by intraperitoneal injection and perfused intracardially with 4% PFA in PBS. The brains were dissected and kept in 4% PFA overnight at 4°C, then cryoprotected by immersion in 30% sucrose for 48 h. Brains were embedded and frozen in OCT-Compound Tissu-Tek (Sakura). Coronal sections (20 mm) were prepared with a cryostat (Leica HM525) and mounted on glass SuperFrost+ slides (Thermo Fisher Scientific). For astroglia morphology analysis, sections were washed with PBS and directly mounted with FluoroGold medium containing DAPI (Invitrogen). For immunostaining, slides were rinsed three times in PBS, then treated with blocking buffer (1% BSA, 5% goat-serum, and 0.2% Triton X-100 in PBS) for 30 min at room temperature (RT). Primary antibodies for VGluT1 (1:2000; Invitrogen), PSD95 (1:500; Invitrogen), GFAP (1:1000; Calbiochem), NeuN (1:500; Millipore), Iba1 (1:500; Wako), PDGRFα (1:500; BD PharMingen), and Oligo2 (1:2000; Millipore) were incubated overnight at 4°C in blocking buffer. After washing slides three times in PBS, corresponding secondary antibody (1:2000) was added for 90 min at RT. The sections were rinsed three times in PBS before mounting. All images were obtained with a confocal laser scanning microscope (10–12 μm Z stack with 0.5–1 μm step; A1R, Nikon).
Astroglial domain analysis and quantification of synapse.
Astroglial domains from the sensory-motor cortex (layers 2–5) and the ventromedial and dorsomedial nuclei of hypothalamus were used for analysis. Reconstruction and the measurement of astroglial domain size were performed using Imaris (Bitplane). All confocal images for Imaris analysis were taken with a 60× oil-immersion objective lens. Images were taken under optimized setting to best illustrate the astroglial morphology. The settings were consistent across all age groups. For the morphological analysis of astroglia, a 3D reconstruction was first performed using original confocal Z-stack images in Imaris software. The surface tool was then used to build the astroglial domain. This function uses an automatic smoothing of the image with the Gaussian filter. The tdT fluorescence-negative area in each of the confocal stack images was used as the internal control to determine the background fluorescence. The sensitivity threshold (absolute intensity) was manually adjusted so that the generated astroglial domain in the 3D image matches with that in the original confocal image. The cell somas were then detected based on size (≤12 μm in diameter) and used as seeding points to build the 3D domain. The quality (intensity) threshold was also manually adjusted to ensure that all cell somas were detected in a given image. The seeded watershed algorithm enables the Imaris software to recognize and split the domains of neighboring cells. The cells that were only partially included in confocal and 3D images were excluded from analysis. Overlapped domains were also carefully examined to ensure accuracy. The volume size of individual astroglia can be directly measured from generated 3D domain in Imaris. To quantify the number of synapses within each astroglial domain, 3D images containing VGluT1/PSD95 immunostaining were generated. Then each astroglia was separately masked on the VGluT1 and PSD95 channels by setting all pixel signals outside the masked cell domain to zero so that only VGluT1 and PSD95 signals within the masked astroglia domain remain. For each astroglial domain, the separately masked VGluT1 or PSD95 channel images were saved in Imaris and then imported to ImageJ. The colocalization color map plugin generates a color-coded image of the VGluT1/PSD95 puncta colocalization using the normalized mean deviation product (nMDP) value. The nMDP value indicates the degree of overlap between two fluorescent pixels from noncolocalization (−1–0, cold color) to colocalization (0–1, warm color). By applying a threshold [127–255, universal RGB (red-green-blue) scale from ImageJ, equivalent to 0–1 nMDP value] to the color map to filter out all noncolocalized puncta (cold color), we obtained all the colocalization (warm color) puncta. The 3D object counter plugin was then used to count the colocalized VGlut1/PSD95 puncta in the masked Z-stack image. The major branches of the individual astroglia were illustrated using the filament tracing tool (autopath mode). The starting point (soma, ≥12 μm in diameter) and seeding point (process, 1 μm in diameter) were first defined. Then the detection threshold was manually adjusted to faithfully match the processes in the original confocal image stacks.
Calcium imaging and analysis.
Ca2+ imaging of astroglia in acute cortical brain slices was performed using a Neuro-CCD-SM camera (Redshirt Imaging) attached to an Olympus BX51 microscope. Briefly, cortical slices were incubated with 10 μm rhodomine-2-AM and pluronic acid (2.5 μg/ml) in aCSF for 40 min at RT, then transferred to aCSF until needed. At the time of the experiment, a single slice was transferred to the imaging/perfusion chamber. Slices were perfused with standard aCSF at a rate of 2 ml/min with 20 μm 6-7-dinitroquinoxaline-2,3-dione and 10 μm 3-(2-carboxypiperizin-4-yl)propyl-1-phosphonic acid. Astroglia were visualized with 40 and 60× water immersion objectives (numerical aperture, 1.0) and identified by their small, round soma and expression of eYFP [from EF1α-DIO-eYFP adeno-association virus (AAV)] reporter. Fluorescence images were acquired using full-field epi-fluorscent illumination (mercury bulb). Rhodomine-2-AM was excited using a 545/30× nm bandpass filter (peak excitation of rhodamine-2-AM, ≈560 nm). Emission light passed through a 570 LP dichroic mirror followed by a 610/75 nm bandpass filter (peak emission of rhodamine-2-AM, ≈607 nm). A flashlamp pumped solid-state 355 nm laser was directed at the brain slice and a 5 ms flash of laser light (5 μm diameter) was selectively targeted 10 μm away from a single astroglial soma to uncage the 1-(2-nitrophenyl)ethoxycarbonyl (NPEC)-(S)-3,5-dihydoxyphenylglycine (DHPG) compound (Palma-Cerda et al., 2012). Images were acquired at 1 image/ms for 4 s. No spatial binning or photomultiplication was used. Fractional fluorescence was determined by dividing the fluorescence intensity within a region of interest by a baseline average fluorescence value determined from 400 images showing no activity (before laser flash). All values are expressed as means ± SEM.
Immunoblot.
Cortical tissues were dissected from mice for in vivo analysis. Cultured astroglia were collected using a cell scraper. Samples were homogenized in lysis buffer (Tris-HCl 20 mm, SDS 0.1%, Triton 1%, and glycerol 10%) with a protease inhibitor mixture. The total protein amount was determined by the Bradford protein assay (Bio-Rad); 10 μg (for GLT1) or 50 μg (for other proteins) of total lysates was loaded into a 4–15% gradient SDS-PAGE gel. Separated proteins were transferred onto a polyvinylidene difluoride membrane (Bio-Rad) for 1 h. The membrane was blocked with blotting-grade blocker (Bio-Rad) in Tris buffer saline with 0.1% Tween 20 (TBST), then incubated with the appropriate primary antibody overnight at 4°C. Anti-GLT1 (1:5000, rabbit), anti-EAAC1 (1:500, rabbit), and anti-GLAST (1:500, rabbit) were generous gifts from Dr. Jeffrey Rothstein (John Hopkins University). Anti-β-actin (1:1000; Sigma-Aldrich), anti-VGluT1 (1:10,000; Synaptic Systems), anti-GFAP (1:1000; Dako), and anti-mGluR5 (1:500; Millipore) were obtained commercially. Following incubation with the primary antibody, the membrane was exposed to the horseradish peroxidase-conjugated goat anti-rabbit secondary antibody (1:5000), diluted in TBST. Bands were visualized on CL-XPosure film (Thermo Fisher Scientific) by ECL Plus chemiluminescent substrate (Thermo Fisher Scientific). Different exposure times were used for detecting different proteins. Glutamate transporter immunoblots often show a monomer (62 kDa), a dimer (120 kDa), and sometimes multimers (250 kDa), as previously described. All monomers, dimers, and multimers (if present) were used for the quantification of transporter expression levels.
Brain slice preparation.
For dye-filling and electrophysiological recording, cortical brain slices were prepared from juvenile (P14–P26) EAAT2 tdT and VGluT1−/− mice. For Ca2+ imaging experiments, cortical brain slices were prepared from juvenile (P15–P17) CreER+ mGluRf/f and CreER+ mGluR+/+ mice. The pups (P2) were injected with EF1α-DIO-eYFP AAV to label cortical astroglia. The 4-OHT was then administered in these mice as described above. Animals were anesthetized with a ketamine (110 mg/kg)/xylazine (10 mg/kg) mixture. The brain was quickly removed and 300 μm cortical slices were prepared using a vibrotome (Leica VT1000, Leica Microsystems) in ice-cold aCSF containing (in mm) the following: 3 KCl, 125 NaCl, 1 MgCl2, 26 NaHCO3, 1.25 NaH2PO4, 10 glucose, 1 CaCl2; and 400 μm l-ascorbic acid, with osmolarity at 300–305 mOsm, equilibrated with 95% O2–5% CO2. Slices were incubated at RT until use.
Dye-filling of astroglia in cortical slices.
Cortical astroglia were identified by tdT fluorescence and unique electrophysiological properties (−75mV to −85mV resting membrane potential). Astroglial somatic whole-cell recordings were obtained by Multiclamp 700B amplifier filtered at 2 kHz and sampled at 10 kHz with Digidata 1322A (Molecular Devices) in cortical slices. Pipettes were pulled by a P-97 model puller (Sutter Instrument). Pipettes had resistances of 4–6 MΩ. The internal solution for whole-cell recordings consisted of (in mm) the following: 130 K+ gluconate, 10 HEPES, 0.2 EGTA, 10 KCl, 0.9 MgCl2, 4 Mg2ATP, 0.3 Na2GTP, and 20 phosphocreatine; pH was adjusted to 7.2 with KOH. Slices were continuously perfused with aCSF with a flow rate of 1–2 ml/min, bubbled with 95% O2 and 5% CO2. For intracellular labeling, 5% lucifer yellow (LY) potassium salt (Invitrogen) was added to the pipette solution. In voltage-clamp mode, the clamp potential was set at the astroglial resting membrane potential and the dye was injected into the cell by applying a 0.5 s negative current pulse (1 Hz) until astroglial processes were completely filled. After the cell was filled with LY, slices were immersed in 4% PFA overnight at 4°C, rinsed in PBS, and mounted using Invitrogen ProLong Gold with DAPI reagent.
Electron microscopy and analysis.
Electron microscopy (EM) analysis was performed using the Harvard Medical School Electron Microscopy Facility. Mice were perfused with a 2.5% glutaraldehyde and 2% paraformaldehyde (PFA) mixture in 0.1 m sodium cacodylate buffer, pH 7.4, and cut into sections (100 μm) using a vibrotome (Leica VT1000, Leica Microsystems). Sections were washed in 0.1 m cacodylate buffer and postfixed with 1% osmiumtetroxide (OsO4)/1.5% potassiumferrocyanide (KFeCN6) for 1 h, washed in water 3 times, and incubated in 1% aqueous uranyl acetate for 1 h followed by two washes in water and subsequent dehydration in grades of alcohol (50, 70, 90%, 10 min each; 100%, 2× 10 min). The samples were then infiltrated for 15 min in a 1:1 mixture of propyleneoxide and TAAB Epon (Marivac Canada). The samples were embedded in drops of TAAB Epon between two sheets of aclar plastic (Electron Microscopy Sciences) and polymerized at 60°C for 48 h. Ultrathin sections (∼80 nm) were cut on a Reichert Ultracut-S microtome, placed onto copper grids, stained with uranyl acetate and lead citrate, and examined in a JEOL 1200EX transmission electron microscope. Images were recorded with an Advanced Microscopy Techniques 2k CCD camera at 2000 and 10,000×. ImageJ Fiji was then used to analyze the EM images from both wild-type and VGluT1 KO samples. First, synapses were identified using the following criteria: the presence of a postsynaptic density, clear core vesicles directly adjacent to the postsynaptic density, and preprotoplasmic and postprotoplasmic structures enclosed by a membrane. Second, the area of astroglia directly adjacent to the synaptic cleft was identified with the presence of glycogen granules.
Neuronal patch-clamp recording.
Whole-cell patch-current recordings from pyramidal neurons in layer 2/3 somatosensory cortex were obtained under the same recording conditions described above. Pyramidal neurons in layer 2/3 of the somatosensory cortex were identified by bright-field Nikon Eclipse e600FN microscopy with a 40× water-immersion lens and infrared illumination. To measure the miniature excitatory postsynaptic currents (mEPSCs), cells were recorded in voltage-clamp mode at a holding potential of −70 mV in the presence of 1 μm tetrodotoxin and 50 μm picrotoxin. A pClamp 9.2 (Molecular Devices) was used for data acquisition and storage. Analysis of mEPSC was performed using Minianalysis 6.0 software (Synaptosoft). For mEPSC analysis, ≥5 min of spontaneous activity was recorded from each cell with access resistance measured before and after the recording. Access resistance (Ra) was monitored following membrane rupture and dialysis, and recordings were abandoned if Ra was >30 MΩ. Recordings with unstable or high noise (>4 pA root mean square) were excluded. An event amplitude threshold was set at 5 pA above the baseline and ≥300 events were analyzed per cell. A minimum recording length of 2 min without apparent mEPSCs was defined as a silent cell.
TRAP mRNA extraction and QRT-PCR.
Ribosomal-bound translating mRNAs from astroglia were specifically extracted using immunoprecipitation of BAC ALDH1L1 TRAP transgenic mouse tissue, as previously described (Doyle et al., 2008). Briefly, the anti-eGFP antibody (HtzGFP-19C8) was coupled to magnetic beads (Dynabeads, Invitrogen) as described in the kit instructions. Cortical supernatant was prepared and mixed with eGFP antibody-coupled beads for immunoprecipitation. Following immunoprecipitation, RNA was isolated using the Trizol reagent and precipitated with isoproponal. The total RNA from the cortex was prepared using the Absolutely RNA Miniprep Kit (Stratagene). RNA was then converted to cDNA using a high-archive cDNA synthesis kit (Applied Biosystems). The relative abundance of mGluR1/3/5 and GLT1 transcripts was accessed using SYBR-Green (Life Technologies) and custom-made primers (mGluR5: F-GCTGTGAGATAAGAGATTCCTGC, R-ACTCCCACTATGGGTTTCTTGG; mGluR1: F-TGGAACAGAGCATTGAGTTCATC, R-CAATAGGCTTCTTAGTCCTGCC; mGluR3: F-CTGGAGGCCATGTTGTTTGC, R-CATCCACTTTAGTCAACGATGCT; β-actin: F-GGCTGTATTCCCCTCCATCG, R-CCAGTTGGTAACAATGCCATGT; GLT1: F-ACAATATGCCCAAGCAGGTAGA, R-GACACCAAACACAGTCAGTGA). β-Actin was used as an endogenous control for the normalization of RNA quantity.
Statistical analysis.
All analyses were performed using GraphPad Prism6. All values were plotted using the mean ± SEM, except for the astroglial domain size values, which were converted to cumulative frequency. The Kolmogorov–Smirnov test was used to analyze the significance for all of the cumulative frequency curves. One-way ANOVA was used to analyze the variance, followed by a Tukey's post-test to compare pairs of groups. Statistical significance was tested at a 95% (p < 0.05) confidence level and was denoted with an asterisk (*p < 0.05, **p < 0.01, ***p < 0.001).
Results
In situ illustration and measurement of cortical protoplasmic astroglial domains
We had previously generated the EAAT2 tdT transgenic mice in which the tdT reporter is strongly expressed in cortical astroglia (Yang et al., 2011). Coexpression of tdT and eGFP reporters is widely observed in the same cortical astroglia in EAAT2 tdT × BAC GLT1 eGFP double-transgenic mice, especially in cortical layers 2–6 (Fig. 1A). Subsequent quantitative analysis of eGFP+ and eGFP+ tdT+ cells showed that 82.8 ± 1.1% of cortical astroglia coexpress tdT and eGFP reporters whereas 17.2 ± 2.1% of cortical astroglia only express the eGFP reporter. To further determine the specificity of the cortical tdT reporter expression, we performed immunostaining with cell type-specific markers on cortical sections of EAAT2 tdT mice. We found that tdT+ cells colocalize well with GFAP immunoreactivity (Fig. 1Be), but not with markers for neurons (NeuN), oligodendrocytes (Olig2), microglia (Iba1), or NG2 cells (PDGFRα) in the cortex (Fig. 1Ba–Bd), confirming that the tdT reporter expression is restricted to astroglia.
Figure 1.

In vivo and in situ illustration of cortical protoplasmic astroglial domains using EAAT2 tdT reporter mice A, Coexpression of tdT and eGFP reporters in cortical astroglia of EAAT2 tdT+ GLT1 eGFP+ transgenic mice. Scale bar, 100 μm. Cortical layers (I–VI) were labeled on the image. B, Immunostaining of CNS cell-type-specific markers on cortical sections of EAAT2 tdT reporter mice. Arrows point to colocalization of tdT expression with GFAP immunoreactivity. Scale bar, 20 μm. C, Illustration of astroglial major and fine processes by tdT reporter, GFAP immunostaining, and filament tracing in Imaris software. Scale bar, 10 μm. D, Representative confocal and 3D images of cortical astroglia revealed by the tdT reporter. Astroglial domain was color-coded based on the size in Imaris. Scale bar, 30 μm. E, Astroglial domain revealed by both tdT reporter and LY dye-filling in mouse cortical slices. Scale bar, 20 μm. F, Quantification of astroglial domains using the tdT reporter and LY dye-filling. N = 9–20; n.s., Not significant as determined in Student's t test. G, Induced expression of the membrane-targeted eGFP reporter in cortex of GFAP CreERT2 × Rosa-mT/mG double-positive mice (P40) following 4-OHT injection. Scale bar, 100 μm. H, A magnified view of astroglial morphology illustrated with membrane-targeted eGFP. Scale bar, 10 μm.
Interestingly, the tdT reporter is able to label the distal GFAP− fine processes (Fig. 1C), unlike the soma labeling of the eGFP reporter in BAC GLT1 eGFP mice, thus conveniently illustrating the full morphology of mature cortical astroglia. A representative image of multiple tdT+ astroglia is shown in Figure 1Da. The morphology of these tdT+ astroglia is highly comparable to that revealed by the conventional dye-filling approach (Fig. 1E,F) and also form nonoverlapping domains, as previously observed (Bushong et al., 2002; Halassa et al., 2007). A quantitative measurement of the astroglial morphological arborization has been difficult, largely due to the very small diameter (50–80 nm) of astroglial fine processes, which is beyond the resolution of light microscopy. To quantitatively measure the morphological arborization of individual astroglia, we generated the 3D image of individual cortical astroglia from the original confocal image stacks (see experimental procedures) using the Imaris 3D software package (Fig. 1Db). The astroglial domain in the 3D image faithfully preserves the morphological arborization of corresponding astroglia in the original confocal image and represents a 3D view of astroglia in situ. The generation of 3D images also allows direct measurement of the volume of individual astroglia, facilitating the quantitative comparison of astroglial domain sizes in different physiological and pathological conditions.
We have also used the recently developed membrane-targeted Rosa reporter (Rosa-mT/mG) mice (Muzumdar et al., 2007) to illustrate the astroglial morphology in vivo. We bred the GFAP CreERT2 mice (Ganat et al., 2006) with the Rosa-mT/mG mice, the membrane-targeted eGFP is induced in multiple cortical astroglia following 4-OHT administration (Fig. 1G). However, membrane-targeted eGFP reveals very distinct astroglial morphology compared with the dye-filling approach in that the cell soma is not evident. In addition, multiple nuclei counterstained by DAPI were found overlapping with the eGFP fluorescence (Fig. 1H), making it ambiguous whether the morphology revealed by the eGFP fluorescence represents a single astroglia.
VGluT1+ neuronal glutamatergic synapses are closely associated with the developmental growth of astroglial domains
By using the EAAT2 tdT reporter mice and the Imaris software, we acquired confocal images of cortical astroglia at multiple developmental time points (P7, P14, P26, and P50) and generated corresponding 3D images. The characteristic astroglial morphology and corresponding domain sizes from each developmental time point are shown in Figure 2A. Although confocal microscopy is unable to completely resolve PAPs, their dramatic growth was still clearly observed (Fig. 2A). We noticed in particular that PAPs branch out from major cellular processes and fill in the astroglial domain throughout early postnatal development. These observations suggest that the domain illustrated with the tdT reporter and measured by the Imaris software reflects dynamic growth of PAPs in astroglia during development, thus providing a parameter to quantitatively characterize the branching and arborization of astroglial fine processes. We measured a number of astroglia from each developmental time point and generated the cumulative frequency (CF) curves for the domain size. As shown in Figure 2B, 5% of astroglia have domain sizes >5000 μm3 at P7, suggesting that the astroglial domain is largely underdeveloped at P7. In striking contrast, 53 and 70% of astroglia have domain sizes >5000 μm3 at P14 and P26, indicating a rapid growth of the astroglial domain from P7 to P26. The average domain size of astroglia at P7, P14, and P26 is 1097 ± 240 μm3, 6662 ± 673 μm3, and 13597 ± 1155 μm3, respectively (Fig. 2B, inset). Interestingly, the growth of astroglial domain sizes appears to peak at P26, as the percentage (62%) of astroglia with a domain >5000 μm3 at P50 is decreased from that at P26 (70%), and the average astroglial domain size decreases from 13,597 ± 1155 μm3 to 10,939 ± 1021 μm3. Although a significant growth of astroglial domains was found from P7 to P50, there are still 30 and 38% of astroglia that have domain sizes <5000 μm3 at P26 and P50, respectively. It is possible that not all astroglia undergo the same morphological maturation process, which could result in the coexistence of heterogeneous astroglial subpopulations in adult cortex.
Figure 2.
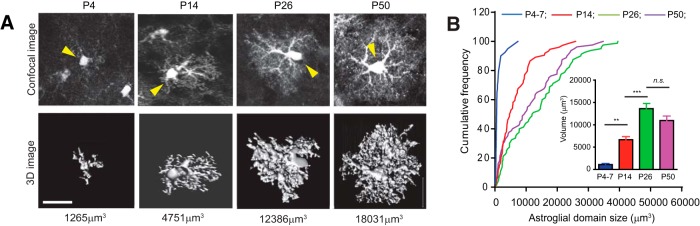
Developmental arborization of cortical astroglial processes revealed by EAAT2 tdT reporter mice A, Representative confocal and 3D images of cortical astroglia from cortex of EAAT2 tdT mice at each developmental time point. Yellow arrow points to the soma of converted astroglia. Quantitative measurement of domain size from Imaris is shown underneath each image. Scale bar, 10 μm. B, Cumulative frequency curve of astroglial domain size at each developmental time point. The inset bar graph represents the average domain size at each time point. N = 74–80 astroglia/group from multiple mice.
How the astroglial domain size increases during postnatal development is unknown. The direct application of glutamate induces rapid astroglial filopodia motility in culture (Lavialle et al., 2011), implicating a role for glutamatergic activity in regulating the dynamics of astroglial processes. Glutamatergic synapses rely on vesicular glutamate transporters (VGluTs) to pack glutamate into vesicles for synaptic release and transmission. The expression patterns of two major vesicular glutamate transporters, VGluT1 and VGluT2, are temporally and spatially complementary (Fremeau et al., 2001). VGluT2 mRNA and protein expression reaches its peak ∼P7 in the cortex and gradually decreases later on, while VGluT1 expression is strongly induced and becomes physiologically dominant from P7 to adulthood in the cortex (Gras et al., 2005). In addition, VGluT2 is abundantly expressed in subcortical regions (Fremeau et al., 2001; Varoqui et al., 2002), including the thalamus, brainstem, and deep cerebellar nuclei. In contrast, VGluT1 is highly expressed in the cerebral cortex, hippocampus, and cerebellar cortex. In the cortex, VGluT3 is expressed only in a small subset of cell populations (Fremeau et al., 2001; Varoqui et al., 2002).
As the postnatal induction of VGluT1 expression correlates with the significant increase in the astroglial domain size during development, we decided to focus on the role of VGluT1+ neuronal glutamatergic synapses in the developmental growth of astroglial domain. We performed double immunostaining of VGluT1 and PSD95 on EAAT2 tdT cortical sections to identify VGluT1+ glutamatergic synapses, as shown in representative images in Figure 3A. We then generated individual 3D images of tdT-labeled astroglia and masked the staining signals outside the selected astroglial 3D domain so that we could specifically quantify the number of VGluT1+ neuronal glutamatergic synapses that are closely associated with processes from individual astroglia (Fig. 3Ba,Bb). We then used the ImageJ colocalization plugin to filter out VGluT1 and PSD95 puncta that were not in close proximity (Fig. 3Bc,Bd), based on the colocalization color-map algorithm (Jaskolski et al., 2005). The remaining proximal VGluT1/PSD95 puncta were counted as the number of VGluT1+ synapses that are closely associated with processes from individual astroglia (Fig. 3Be). By using this approach, we quantified the number of VGluT1+ synapses that are closely associated with individual developing astroglia at multiple developmental time points and plotted them in Figure 3C. Overall, we observed a positive correlation between the number of VGluT1+ synapses that are closely associated with individual astroglia and the astroglial domain size. A particularly high increase in the number of VGluT1+ synapses was found from P14 to P26 (Fig. 3C,D), when the astroglial domain size grows most significantly. These quantification hints that significantly increased VGluT1+ inputs are likely to facilitate the dramatic changes of developing astroglia from P14 to P26. Interestingly, the number of VGluT1+ synapses that are closely associated with individual astroglial domain also reaches its peak at P26 (Fig. 3D), when astroglia have established their full morphology.
Figure 3.

Developmental changes of VGluT1+ neuronal glutamatergic synapses within individual astroglial domain A, Representative confocal images of VGluT1 and PSD95 immunostaining on a cortical section from EAAT2 tdT mice. Scale bar, 30 μm. B, Mask of VGluT1/PSD95 puncta within a single astroglial domain and generation of colocalization color map. Ba, 3D image of single astroglial domain. Scale bar, 20 μm. Bb, VGluT1/PSD95 puncta within the masked single astroglial domain. Bc, Magnified view of the VGluT1/PSD95 puncta within the masked single astroglial domain. Scale bar, 5 μm. Bd, Colocalization color map of VGluT1/PSD95 puncta. Be, Colocalized VGluT1/PSD95 puncta. C, Scatter plot of the number of VGluT1+ synapses within a single astroglial domain at each developmental time point. N = 22–34 astroglia/group from multiple mice. D, Quantitative analysis of the average number of VGluT1+ synapses per astroglial domain at each developmental time point. **p < 0.01; ***p < 0.001 as determined in one-way ANOVA analysis with Tukey's multiple-comparisons test.
VGluT1+ neuronal glutamatergic signaling regulates developmental arborization of astroglial processes and the developmental induction of GLT1 in vivo
To determine the role of VGluT1+ glutamatergic synapses in the developmental maturation of astroglia, we perturbed VGluT1+ glutamatergic synaptic activity and examined its effect on the maturation of astroglia using the VGluT1 KO (VGluT1−/−) mice (Fremeau et al., 2004). VGluT1−/− mice can be produced from VGluT1+/− mice and are indistinguishable from the wild-type littermates at birth (Fremeau et al., 2004), though they feed poorly once reaching P10–P14 and must be maintained separately from littermates to survive. We performed mEPSC recordings on VGluT1−/− cortical slices and found that 40% (8 of 20) of recorded cells were silent during a 2 min recording period. The other 12 recorded cells from VGluT1−/− slices also showed 85% decrease in mEPSC frequency compared with that of wild-type cortical slices (Fig. 4A,B). As mEPSC frequency represents the probability of transmitter release from synaptic vesicles, the significant reduction of mEPSC frequency suggests that the loss of VGluT1 silences the vast majority of glutamatergic synaptic activity in the cortex, which is in line with previous histological analysis showing that the VGluT1 protein is highly induced in the cortex and only weak-to-moderate VGluT2 immunostaining signals were found in neocortex layer VI or IV after P7 (Varoqui et al., 2002). Although the excitatory neuronal activity is largely silenced (85%) in the cortex of VGluT1−/− mice, previous Nissl staining found that the overall cytoarchitecture was indistinguishable from that of wild-type mice (Fremeau et al., 2004). The silencing of vast majority of glutamatergic synapses without apparent neuronal structure changes in VGluT1−/− cortex provides unique advantages to specifically probe the role of glutamatergic activity in postnatal maturation of cortical astroglia.
Figure 4.

VGluT1+ glutamatergic synaptic signaling regulates developmental arborization of astroglial processes in vivo A, Representative mEPSC recording from cortical slices of VGluT1+/+ and VGluT1−/− mice. B, The frequency of mEPSC from cortical slices of VGluT1+/+ and VGluT1−/− mice. N = 13–20 neurons/group; p value was determined using the Student's t test. C, Representative images of astroglial domain and VGluT1 immunostaining in VGluT1−/− tdT+ and VGluT1+/+ tdT+ cortical sections. Scale bar, 40 μm. D–G, Cumulative frequency curve of P14 cortical (D), P26 cortical (E), P14 hypothalamic (F), and P26 hypothalamic (G) astroglial domain size in VGluT1−/− tdT+ and VGluT1+/+ tdT+ mice. The inset bar graph represents the average astroglial domain size. N = 75–135 astroglia/group from multiple mice; p values were determined using the Kolmogorov–Smirnov test. H, Electron micrograph of perisynaptic astroglial processes in VGluT1+/+ and VGluT1−/− mice. Perisynaptic astroglial processes were highlighted in light purple. Red arrows point to glycogen granules; yellow arrows point to the synapse, indicated with postsynaptic density; D., Dendrite; T., terminal; As., astroglial processes; Mt., mitochondria. Scale bar, 100 nm. I, Percentage of synapses that are in direct contact with astroglial processes in VGluT1+/+ and VGluT1−/− mice. N = 24–56 synapses. p value was determined using the Student's t test.
We generated VGluT1−/− EAAT2 tdT+ mice and carefully maintained these mice through weaning age. Representative images of VGluT1 staining and tdT labeling from VGluT1−/− EAAT2 tdT+ and littermate VGluT1+/+ EAAT2 tdT+ cortices are shown in Figure 4C. We subsequently measured the domain size of developing cortical astroglia from VGluT1−/− tdT+ and littermate VGluT1+/+ tdT+ mice at both P14 and P26 using the Imaris software. As shown in the CF curves in Figure 4D,E, VGluT1−/− tdT+ astroglia are 15% (Kolmogorov–Smirnov test) less likely to have domain sizes >5000 μm3 compared with that of VGluT1+/+ tdT+ astroglia at P14, during which astroglial domains are still growing, and are still 11% less likely to have domain sizes >5000 μm3 at P26, when astroglial domain sizes reach peak. The overall average domain size of VGluT1−/− tdT+ astroglia (11,384 ± 939 μm3) is also significantly smaller than that of VGluT1+/+ tdT+ astroglia (16,030 ± 1272 μm3) at P26 (Fig. 4E, inset). To determine whether the alteration of cortical astroglial domain size in VGluT1−/− mice is indeed the result of a loss of VGluT1, we next examined astroglial domain size in the ventromedial and dorsomedial nuclei of hypothalamus in VGluT1−/− tdT+ mice. In these regions, the GABAergic and VGluT2+ synaptic inputs, but not VGluT1+ synaptic inputs, are dominant (Decavel and Van den Pol, 1990; Varoqui et al., 2002). Interestingly, we observed no significant difference in astroglial domain size in the hypothalamus at both P14 and P26 (Fig. 4F,G) between VGluT1+/+ tdT+ and VGluT1−/− tdT+ mice, suggesting that the loss of VGluT1 has no effect on astroglial domain size in the hypothalamus during development. We also noticed that the overall average domain size of hypothalamic astroglia (5149 ± 564 μm3; Fig. 4G, inset) is significantly smaller than that of cortical astroglia (16,030 ± 1272 μm3; Fig. 4E, inset) at P26, correlating with the anatomical distribution of VGluT1+ glutamatergic synapses in these regions. We further acquired the EM image of the “tripartite” synapse from VGluT1+/+ and VGluT1−/− cortex. While we clearly observed characteristic perisynaptic astroglial process (indicated by the abundant glycogen granules; Fig. 4Ha, red arrows) between two synapses (yellow arrows) in VGluT1+/+ cortex, synapses tend to group together with less or no clear coverage from astroglial processes in VGluT1−/− samples (Fig. 4Hb). Subsequent quantification found 40% fewer synapses that are in direct contact with astroglial processes in VGluT1−/− cortex (Fig. 4I). These results suggest that the loss of VGluT1+ glutamatergic activity to developing astroglia results in significantly reduced enshealthing of astroglial fine processes on synapses in cortex.
Active uptake of extracellular glutamate is primarily performed by two astroglial glutamate transporters, GLAST and GLT1 (Danbolt, 2001). Previous studies have found that cortical GLT1 expression is developmentally upregulated and becomes the physiologically dominant glutamate transporter in adult CNS (Furuta et al., 1997; Holmseth et al., 2012). As GLT1-mediated glutamate uptake represents one of the most important functions for astroglia in the CNS, developmental induction of GLT1 therefore indicates the functional maturation of astroglia, along with the induction of other important astroglial genes. Although in vitro studies have suggested that astroglial expression of GLT1 depends upon neuronal signaling and that GLT1 expression is often decreased in neural injuries or during neurodegeneration (Yang et al., 2009), scientists still do not know whether neuronal activity regulates physiological and developmental induction of GLT1 in vivo. We therefore collected somatomotor cortex tissue from VGluT1−/− mice and examined GLT1 mRNA and protein expression levels. As shown in Figure 5A, GLT1 mRNA levels are significantly decreased in VGluT1−/− cortex at P26. GLT1 protein levels are also significantly decreased in VGluT1−/− cortex at P26 (Fig. 5B,C), though its expression in the VGluT1−/− cortex is comparable to that from the wild-type cortex at P14 (Fig. 5D). We have also determined expression levels of other glutamate transporters GLAST and EAAC1, but found no significant difference between VGluT1+/+ and VGluT1−/− mice (Fig. 5E,F). Together with the domain analysis, our results using VGluT1−/− mice suggest that VGluT1+ glutamatergic synaptic activity regulates both the morphological and molecular (GLT1) maturation of cortical astroglia in vivo.
Figure 5.

The loss of VGluT1+ neuronal glutamatergic synaptic activity significantly decreases developmental induction of GLT1 in vivo. A, Representative GLT1 immunoblot in sensory-motor cortex of VGluT1−/−, VGluT1+/−, and VGluT1+/+ mice at P14. B, GLT1 mRNA expression levels in sensory-motor cortex of VGluT1−/− and VGluT1+/+ mice at P26. N = 4 mice/group; p = 0.019 as determined using the Student's t test. C, D, Representative GLT1 immunoblot (C) and quantification of GLT1 protein expression levels (D) in sensory-motor cortex of VGluT1−/−, VGluT1+/−, and VGluT1+/+ mice at P26. N = 3–4 mice/group. *p < 0.05; **p < 0.01 as determined in one-way ANOVA analysis with Tukey's multiple-comparisons test. E, F, Expression levels of GLAST (E) and EAAC1 (F) in sensory-motor cortex of VGluT1−/− and VGluT1+/+ mice at P26. N = 4 mice/group. p value was determined using the Student's t test;.
Astroglial mGluR5 receptor mediates glutamatergic signaling that regulates the developmental maturation of cortical astroglia
Astroglia are known to express various glutamate receptors, especially mGluRs, to respond to synaptically released glutamate. To specifically measure developmental changes of mGluR expressions in cortical astroglia, we used the TRAP approach and the BAC ALDH1L1 TRAP transgenic mice (Doyle et al., 2008). We have previously validated the specificity of the TRAP isolation of astroglial-translating mRNAs (Higashimori et al., 2013). As shown in Figure 6A, translating mGluR5 mRNA levels in cortical astroglia increase significantly from P7 to P21, but decrease to barely detectable levels at P40, suggesting that mGluR5 mRNA in cortical astroglia is translationally active within 3 weeks postnatally. Our results are not entirely consistent with those of a recent study that found that mGluR5 mRNA in astroglia is highest at P7 and declines as the mice age (Sun et al., 2013). This discrepancy is likely due to the different approaches used in these studies, particularly the differences in measuring mGluR5 mRNA: we only measured the translating mGluR5 mRNA associated with ribosome; in the other study, total mGluR5 mRNA was measured (Sun et al., 2013). In contrast, astroglial mGluR1 translating mRNA levels are barely detectable during development, though overall mGluR1 mRNA levels from the cortex increase over time (Fig. 6B), suggesting that mGluR1 mRNA is unlikely to be translationally active in astroglia. In addition, translating mGluR3 mRNA levels are four times higher than mGluR3 mRNA levels in the total cortex at P7 (Fig. 6C). The translating mGluR3 mRNA levels are constant throughout development from P7 to P40 and are comparable to mGluR3 mRNA levels from the total cortex from P21 to P40 (Fig. 6C). Since the number of astroglia is roughly half of the total number of cells in the mammalian CNS (Azevedo et al., 2009), similar mGluR3 mRNA levels in astroglia versus the total cortex (P21/P40) suggests that mGluR3 is highly expressed in cortical astroglia, as previously reported (Sun et al., 2013). However, as translating mGluR5 mRNA levels in cortical astroglia are selectively increased from P7 to P21, we decided to focus primarily on the roles of astroglial mGluR5 in the developmental maturation of cortical astroglia.
Figure 6.

Developmental growth of cortical astroglial domain is inhibited by in vivo MPEP administration. A–C, Relative ribosome-bound translating mGluR5 (A), mGluR1 (B), and mGluR3 (C) mRNA levels in cortical astroglia compared with corresponding mRNA levels in the total cortex during development. N = 3–4 mice/group. p value was determined in Student's t test. Ribosome-bound translating mRNAs were isolated using TRAP approach. D, Representative images of cortical astroglial domains in EAAT2 tdT reporter mice following MPEP administration. Astroglial domain is color-coded based on the volume size. Scale bar, 40 μm, E, Cumulative frequency curve of cortical astroglial domain size in EAAT2 tdT reporter mice following MPEP administration. The inset bar graph represents the average astroglial domain size. N = 159–173 astroglia/group from multiple mice. p value was determined using the Kolmogorov–Smirnov test.
To investigate whether neuronal activity-dependent release of glutamate and activation of group I mGluRs are involved in the developmental growth of astroglial domains, we administered MPEP, a selective mGluR5 antagonist, into EAAT2 tdT reporter mice (10 mg/kg) from P14 to P26, based on our observation that astroglial domain sizes grow significantly from P14 to P26 (Fig. 2B). Following MPEP injections, we analyzed astroglial domains and found that the average domain size of astroglia decreases from 12,043 ± 874 μm3 (sham) to 7852 ± 592 μm3 (MPEP; Fig. 6E, inset). Representative confocal and 3D images are shown in Figure 6D, in which the domain sizes were color-coded to indicate a decrease of larger domain (warmer color) in MPEP-injected samples. MPEP injections especially decrease the probability of having a larger domain size (>10,000 μm3), without significantly affecting the smaller domains (Fig. 6E).
Encouraged by the pharmacological results, we further took a genetic approach to specifically investigate the role of astroglial mGluR5 in the developmental maturation of cortical astroglia. To generate inducible astroglia-specific mGluR5 conditional KO mice, we bred mGluR5f/f mice (Xu et al., 2009) with BAC GLAST CreER transgenic mice (Kang et al., 2010), which are more efficient in Cre-dependent recombination and more specific to astroglia than the conventional GFAP Cre transgenic mice (Mori et al., 2006). We generated CreER+ mGluR5f/f tdT+ mice and the littermate control CreER+ mGluR5+/+ tdT+ or CreER− mGluR5f/f tdT+ mice. To monitor specific Cre-dependent recombination in cortical astroglia in situ, we intracranially injected EF1α-DIO-eYFP AAV into P0–P3 pups. The eYFP open reading frame (ORF) is inverted and double floxed on the EF1α-DIO-eYFP construct (Addgene plasmid: 27056) and eYFP expression can only be induced following Cre-dependent recombination and ORF rearrangement. Thus the eYFP expression indicates the positive Cre-dependent recombination in eYFP+ cells. As shown in Figure 7A, we observed a strong induction of eYFP expression in CreER+ mGluR5f/f tdT+ and CreER+ mGluR5+/+ tdT+ mice at P21, but not in CreER− mGluR5f/f tdT+ mice following 4-OHT administration, suggesting that Cre-dependent recombination occurred specifically in Cre-expressing astroglia without noticeable leaking activity. The expression of eYFP is mostly overlapped with tdT reporter expression; however, since the tdT reporter labels ∼80% but not all of cortical astroglia (Fig. 1B), it is occasionally noticeable that the eYFP reporter is expressed in the tdT− astroglia (Fig. 7Ai). We also examined mGluR5 protein expression levels in cultured astroglia prepared from CreER− mGluR5f/f, CreER+ mGluR5+/+, and CreER+ mGluR5f/f pups following 4-OHT exposure using mGluR5 immunobloting. As shown in Figure 7B, mGluR5 expression levels in CreER+ mGluR5f/f astroglia were reduced >80% compared with that in CreER− mGluR5f/f or CreER+ mGluR5+/+ astroglia.
Figure 7.

Selective deletion of astroglial mGluR5 receptor reduces developmental growth of astroglial domain and early postnatal induction of GLT1 in vivo. A, Representative images of cortical tdT+ astroglia and induction of eYFP reporter in CreER− mGluR5f/f tdT+, CreER+ mGluR5f/f tdT+, and CreER+ mGluR5+/+ tdT+ mice. Scale bar, 50 μm. B, mGluR5 immunoblot in CreER− mGluR5f/f and CreER+ mGluR5f/f primary astroglia following 4-OHT treatment. N = 4 replicates/group. C, A representative image of rhodamine 2-AM-loaded astroglia (white arrows) in cortical slices from CreER+ mGluR5f/f and CreER+ mGluR5+/+ mice received AAV and 4-OHT. Scale bar, 50 μm. D, A representative DHPG-induced Ca2+ trace from CreER+ mGluR5f/f and CreER+ mGluR5+/+ cortical slices. E, Quantitative analysis of DHPG-induced Ca2+ response in astroglia from CreER+ mGluR5f/f and CreER+ mGluR5+/+ cortical slices. N = 11–12 astroglia from 3 mice/group. ***p < 0.001 from one-way ANOVA with Bonferroni post-test. F, Cumulative frequency curve of cortical astroglial domain size in CreER+ mGluR5+/+ tdT+ and CreER+ mGluR5f/f tdT+ mice. The inset bar graph represents the average astroglial domain size. N = 60–63 astroglia/group from multiple mice. p value was determined using the Kolmogorov–Smirnov test. G, GLT1 mRNA expression levels in sensory-motor cortex of CreER− mGluR5f/f and CreER+ mGluR5f/f mice. N = 3–4 mice/group. p = 0.017 as determined in the Student's t test. H, I, Representative GLT1 immunoblot (H) and quantification of GLT1 protein expression levels (I) in sensory-motor cortex of CreER− mGluR5f/f and CreER+ mGluR5f/f mice at P26. N = 4 mice/group. p = 0.001 as determined in the Student's t test.
Group I mGluRs, including mGluR5, are Gq-coupled receptors whose activation leads to elevated intracellular Ca2+ levels. Previous in vivo Ca2+ imaging showed that mGluR5 is functionally active in developing (P12–P15) but not in adult astroglia (10–12 weeks; Sun et al., 2013). To confirm that mGluR5 is indeed deleted in CreER+ mGluR5f/f developing astroglia, we measured the astroglial mGluR1/5-dependent Ca2+ response in acute cortical slices (P15–P17) prepared from CreER+ mGluR5f/f and CreER+ mGluR5+/+ mice. We intracranially injected the EF1α-DIO-eYFP AAV into CreER+ mGluR5f/f and CreER+ mGluR5+/+ mice to selectively label cortical astroglia. Acute cortical slices were prepared from CreER+ mGluR5f/f and CreER+ mGluR5+/+ mice following AAV injection and 4-OHT administration, and bulk-loaded with the Ca2+ indicator rhodamine 2-AM. NPEC-caged DHPG was bath-applied (100 μm) and flash-photolyzed to uncage the DHPG with a UV beam (5 μm diameter for 5 ms) on a single astroglia identified by eYFP and rhodamine 2-AM fluorescence (Fig. 7C, white arrows). High-speed time-lapse images of astroglial Ca2+ responses were collected during photolysis. In CreER+ mGluR5+/+ cortical slices, uncaging DHPG elicited robust increases in intracellular Ca2+ (Fig. 7D,E) in the soma of astroglia. In contrast, uncaging DHPG induces significantly reduced Ca2+ increases in CreER+ mGluR5f/f cortical astroglia (Fig. 7D,E). Interestingly, pharmacological blockade of mGluR5 with its specific inhibitor MTEP in wild-type mouse cortical slices in our previous study (Higashimori et al., 2013) showed highly similar reduction of DHPG-induced somatic Ca2+ increase as observed in mGluR5-deficient astroglia (Fig. 7D), indicating a minimum remaining mGluR5 activity in CreER+ mGluR5f/f cortical astroglia. Together with our in vitro Western and in vivo validation of Cre recombination using EF1α-DIO-eYFP AAV, we are confident that mGluR5 is efficiently deleted in developing astroglia of CreER+ mGluR5f/f mice.
We then analyzed astroglial domain size in CreER+ mGluR5f/f tdT+ and CreER+ mGluR5+/+ tdT+ mice at P21 following 4-OHT injection. We particularly focused on eYFP+ tdT+ astroglia as they underwent Cre-dependent recombination (eYFP+) and mGluR5 deletion. Although 40% of eYFP+ tdT+ astroglia possess similar domain size from both CreER+ mGluR5f/f tdT+ (2004 ± 218 μm3) and CreER+ mGluR5+/+ tdT+ mice (2536 ± 294 μm3), a large portion (>40%, according to the CF curve) of astroglia from CreER+ mGluR5f/f tdT+ mice has significantly smaller domain sizes (12,072 ± 1474 μm3) than those (18,961 ± 1750 μm3) in CreER+ mGluR5+/+ tdT+ mice (Fig. 7F). Interestingly, both pharmacological inhibition of mGluR1/5 and genetic deletion of astroglial mGluR5 have a similar influence on astroglial domain sizes, i.e., the selective reduction of the domain on larger (>10,000 μm3) size astroglia. These pharmacological and genetic analyses suggest that early postnatal activation of astroglial mGluR5 plays an important role in mediating glutamatergic signaling during the developmental growth of the astroglial domain.
We have previously shown, using in vitro mismatched astroglia and neuron cocultures, that astroglial mGluR5 is involved in neuron-dependent GLT1 expression (Higashimori et al., 2013). Our results above have found that VGluT1+ glutamatergic synaptic activity regulates the developmental induction of GLT1. To investigate whether astroglial mGluR5 mediates VGluT1+ neuronal glutamatergic synaptic activity in the developmental induction of GLT1 in vivo, we further examined GLT1 mRNA and protein expression levels in the cortical tissue of CreER− mGluR5f/f and CreER+ mGluR5f/f mice. We found a 40% decrease in GLT1 mRNA levels (Fig. 7G) and a 45% decrease in GLT1 protein levels (Fig. 7H,I) in CreER+ mGluR5f/f cortex. These results provide convincing in vivo evidence that the activation of astroglial mGluR5 receptor regulates developmental induction of GLT1.
Discussion
Despite significant progress in understanding the early glial specification in recent years, how astroglia become functionally mature remains essentially unknown. Our current study provides new mechanistic insights for understanding the postnatal developmental maturation of astroglia. We used a new in vivo approach to quantitatively measure the developmental growth and arborization of astroglial fine processes. We found that the number of VGluT1+ neuronal glutamatergic synaptic inputs that are closely associated with individual astroglia is positively correlated with the developmental growth of astroglial domain in vivo. Subsequent genetic analysis further demonstrates that synaptically released glutamate serves as a maturation signal to promote the postnatal developmental maturation of cortical astroglia by activating the astroglial mGluR5. Although astroglial mGluR5 is downregulated in adult astroglia (Fig. 6A; Sun et al., 2013), our results show an important function of its activation in the developmental growth of astroglial processes and early postnatal induction of functional astroglial genes, such as GLT1. In addition, our results suggest a new mechanism to regulate the developmental formation of functional neuron-glia synaptic units. We point out in particular that the region-specific regulatory role of VGluT1+ synaptic activity in cortical astroglia maturation suggests that developmental maturation and functional diversification of astroglia may largely depend on localized neuronal signals. As cultured astroglia (even with the presence of neurons) are limited by their drastically different morphology and molecular profile from in vivo astroglia (Cahoy et al., 2008), our in vivo approach provides a more physiologically relevant dissection of the mechanisms involved in the developmental maturation of astroglia. Moreover, the selective silencing of VGluT1+ synapses in VGluT1−/− mice allows for direct probing of the roles for glutamatergic neuronal activity without perturbing potential membrane (contact) signaling between neuron and astroglia.
The developmental growth of astroglial domain (arborization and branching of fine processes) and molecular changes are critically essential for astroglial functions in the CNS. Early EM and dye-filling studies showed that astroglial fine processes are closely adjacent to the neuronal terminals and participate in the formation of functional synapses (Bushong et al., 2002). Recent compartmental Ca2+ imaging studies using genetically encoded Ca2+ indicator further showed that astroglial fine processes or “branchlets” are primary sites for astroglia to respond to synaptic signaling (Shigetomi et al., 2012, 2013). Therefore, proper arborization and growth of these fine processes in astroglia during postnatal development provide an important structural foundation for proper astroglia-synaptic signaling. Our results showing that synapses from VGluT1−/− cortex are largely devoid of perisynaptic astroglial processes (Fig. 4H,I) indicate that the VGluT1+ glutamatergic signaling is essential for normal enshealthing of astroglial fine processes on synapses and subsequent formation of functional astroglia-synaptic units. Currently very little is known about the biochemical mechanisms that regulate the dynamics of astroglial fine processes. In vitro studies showed that the actin-binding protein ezrin is involved in glutamate-induced filopodia motility in cultured astroglia (Lavialle et al., 2011). Studies are needed to investigate how neuronal activity and the activation of the astroglial mGluR5 alters downstream biochemical events to regulate the dynamic growth of astroglial fine processes.
Adult astroglia are historically characterized by forming extensive networks through gap-junctions, by rapidly removing extracellular glutamate, and by buffering synaptically released K+. Interestingly, proteins that mediate these functions, such as connexin 43/30, glutamate transporter GLT1, and potassium channel Kir4.1, are all developmentally upregulated and are highly localized on the membrane surface of fine processes (Furuta et al., 1997; Nagy et al., 1999; Seifert et al., 2009). In addition, recent studies have shown that only immature, but not mature, astroglia secrete synaptogenic molecules TSP 1 and 2 to induce the structural formation of excitatory synapses (Christopherson et al., 2005). Astroglial-derived glypican 4, which promotes the formation of functional excitatory synapses by clustering glutamate receptors, is also highly expressed from P6 to P14, but decreases once reaching maturation (P21; Allen et al., 2012). It remains unexplored whether neuronal activity modulates the expression or secretion of immature astroglia-derived synaptogenic proteins, as a feedback mechanism, to optimize neuronal synaptogenesis and circuitry formation during early postnatal development.
Abnormal synaptogenesis or synapse elimination and the imbalance of excitatory versus inhibitory activity have been implicated as primary pathogenic mechanisms for various neurodevelopmental disorders (Rubenstein and Merzenich, 2003; Clarke and Barres, 2013). Although astroglia are known to regulate synaptogenesis by secreting various extracellular matrix proteins (Clarke and Barres, 2013) and modulate neuronal excitability through uptake of extracellular glutamate (Tzingounis and Wadiche, 2007), and these synaptogenic and glutamate uptake functions are developmentally regulated, it remains essentially unexplored whether these important astroglial functions are altered in neurodevelopmental disorders, and whether that alteration potentially contributes to the abnormal synaptogenesis (or synapse elimination) and the imbalance of excitatory versus inhibitory activity in neurodevelopmental disorders. Indeed, recent mismatched coculture studies begin to show that developing astroglia derived from mouse models (MeCP2−/− and fmr1−/− mice) of Rett syndrome and fragile X syndrome alter dendritic morphology of hippocampal neurons (Ballas et al., 2009; Jacobs and Doering, 2010). Decreased developmental induction of GLT1 has also been observed in fmr1−/− mice (Higashimori et al., 2013). Further characterization of the alterations of astroglial development in neurodevelopmental disorders may shed new light on the pathogenesis of these disorders.
Footnotes
This work was supported by the National Institutes of Health (NIH; Grant MH 099554 to Y.Y.). We thank Dr. Moritz Armbruster and Dr. Chris Dulla for their technical help on slice Ca2+ imaging and analysis, Dr. Robert Edwards for providing VGluT1−/− mice, Dr. Anis Contractor for providing mGluR5f/f mice, and Tufts Center for Neuroscience Research (NIH P30 NS047243) for providing valuable core facilities.
The authors declare no competing financial interests.
References
- Allen NJ, Bennett ML, Foo LC, Wang GX, Chakraborty C, Smith SJ, Barres BA. Astrocyte glypicans 4 and 6 promote formation of excitatory synapses via GluA1 AMPA receptors. Nature. 2012;486:410–414. doi: 10.1038/nature11059. [DOI] [PMC free article] [PubMed] [Google Scholar]
- Azevedo FA, Carvalho LR, Grinberg LT, Farfel JM, Ferretti RE, Leite RE, Jacob Filho W, Lent R, Herculano-Houzel S. Equal numbers of neuronal and nonneuronal cells make the human brain an isometrically scaled-up primate brain. J Comp Neurol. 2009;513:532–541. doi: 10.1002/cne.21974. [DOI] [PubMed] [Google Scholar]
- Ballas N, Lioy DT, Grunseich C, Mandel G. Non-cell autonomous influence of MeCP2-deficient glia on neuronal dendritic morphology. Nat Neurosci. 2009;12:311–317. doi: 10.1038/nn.2275. [DOI] [PMC free article] [PubMed] [Google Scholar]
- Barnabé-Heider F, Wasylnka JA, Fernandes KJ, Porsche C, Sendtner M, Kaplan DR, Miller FD. Evidence that embryonic neurons regulate the onset of cortical gliogenesis via cardiotrophin-1. Neuron. 2005;48:253–265. doi: 10.1016/j.neuron.2005.08.037. [DOI] [PubMed] [Google Scholar]
- Bonaguidi MA, McGuire T, Hu M, Kan L, Samanta J, Kessler JA. LIF and BMP signaling generate separate and discrete types of GFAP-expressing cells. Development. 2005;132:5503–5514. doi: 10.1242/dev.02166. [DOI] [PubMed] [Google Scholar]
- Bonni A, Sun Y, Nadal-Vicens M, Bhatt A, Frank DA, Rozovsky I., Stahl N., Yancopoulos G.D., Greenberg M.E. Regulation of gliogenesis in the central nervous system by the JAK-STAT signaling pathway. Science. 1997;278:477–483. doi: 10.1126/science.278.5337.477. [DOI] [PubMed] [Google Scholar]
- Broekman ML, Comer LA, Hyman BT, Sena-Esteves M. Adeno-associated virus vectors serotyped with AAV8 capsid are more efficient than AAV-1 or -2 serotypes for widespread gene delivery to the neonatal mouse brain. Neuroscience. 2006;138:501–510. doi: 10.1016/j.neuroscience.2005.11.057. [DOI] [PubMed] [Google Scholar]
- Bushong EA, Martone ME, Jones YZ, Ellisman MH. Protoplasmic astrocytes in CA1 stratum radiatum occupy separate anatomical domains. J Neurosci. 2002;22:183–192. doi: 10.1523/JNEUROSCI.22-01-00183.2002. [DOI] [PMC free article] [PubMed] [Google Scholar]
- Cahoy JD, Emery B, Kaushal A, Foo LC, Zamanian JL, Christopherson KS, Xing Y, Lubischer JL, Krieg PA, Krupenko SA, Thompson WJ, Barres BA. A transcriptome database for astrocytes, neurons, and oligodendrocytes: a new resource for understanding brain development and function. J Neurosci. 2008;28:264–278. doi: 10.1523/JNEUROSCI.4178-07.2008. [DOI] [PMC free article] [PubMed] [Google Scholar]
- Christopherson KS, Ullian EM, Stokes CC, Mullowney CE, Hell JW, Agah A, Lawler J, Mosher DF, Bornstein P, Barres BA. Thrombospondins are astrocyte-secreted proteins that promote CNS synaptogenesis. Cell. 2005;120:421–433. doi: 10.1016/j.cell.2004.12.020. [DOI] [PubMed] [Google Scholar]
- Clarke LE, Barres BA. Emerging roles of astrocytes in neural circuit development. Nat Rev Neurosci. 2013;14:311–321. doi: 10.1038/nrn3484. [DOI] [PMC free article] [PubMed] [Google Scholar]
- Danbolt NC. Glutamate uptake. Prog Neurobiol. 2001;65:1–105. doi: 10.1016/S0301-0082(00)00067-8. [DOI] [PubMed] [Google Scholar]
- Decavel C, Van den Pol AN. GABA: a dominant neurotransmitter in the hypothalamus. J Comp Neurol. 1990;302:1019–1037. doi: 10.1002/cne.903020423. [DOI] [PubMed] [Google Scholar]
- Deneen B, Ho R, Lukaszewicz A, Hochstim CJ, Gronostajski RM, Anderson DJ. The transcription factor NFIA controls the onset of gliogenesis in the developing spinal cord. Neuron. 2006;52:953–968. doi: 10.1016/j.neuron.2006.11.019. [DOI] [PubMed] [Google Scholar]
- Derouiche A, Frotscher M. Peripheral astrocyte processes: monitoring by selective immunostaining for the actin-binding ERM proteins. Glia. 2001;36:330–341. doi: 10.1002/glia.1120. [DOI] [PubMed] [Google Scholar]
- Derouiche A, Anlauf E, Aumann G, Mühlstädt B, Lavialle M. Anatomical aspects of glia-synapse interaction: the perisynaptic glial sheath consists of a specialized astrocyte compartment. J Physiol Paris. 2002;96:177–182. doi: 10.1016/S0928-4257(02)00004-9. [DOI] [PubMed] [Google Scholar]
- Doyle JP, Dougherty JD, Heiman M, Schmidt EF, Stevens TR, Ma G, Bupp S, Shrestha P, Shah RD, Doughty ML, Gong S, Greengard P, Heintz N. Application of a translational profiling approach for the comparative analysis of CNS cell types. Cell. 2008;135:749–762. doi: 10.1016/j.cell.2008.10.029. [DOI] [PMC free article] [PubMed] [Google Scholar]
- Freeman MR. Specification and morphogenesis of astrocytes. Science. 2010;330:774–778. doi: 10.1126/science.1190928. [DOI] [PMC free article] [PubMed] [Google Scholar]
- Fremeau RT, Jr, Troyer MD, Pahner I, Nygaard GO, Tran CH, Reimer RJ, Bellocchio EE, Fortin D, Storm-Mathisen J, Edwards RH. The expression of vesicular glutamate transporters defines two classes of excitatory synapse. Neuron. 2001;31:247–260. doi: 10.1016/S0896-6273(01)00344-0. [DOI] [PubMed] [Google Scholar]
- Fremeau RT, Jr, Kam K, Qureshi T, Johnson J, Copenhagen DR, Storm-Mathisen J, Chaudhry FA, Nicoll RA, Edwards RH. Vesicular glutamate transporters 1 and 2 target to functionally distinct synaptic release sites. Science. 2004;304:1815–1819. doi: 10.1126/science.1097468. [DOI] [PubMed] [Google Scholar]
- Furuta A, Rothstein JD, Martin LJ. Glutamate transporter protein subtypes are expressed differentially during rat CNS development. J Neurosci. 1997;17:8363–8375. doi: 10.1523/JNEUROSCI.17-21-08363.1997. [DOI] [PMC free article] [PubMed] [Google Scholar]
- Ganat YM, Silbereis J, Cave C, Ngu H, Anderson GM, Ohkubo Y, Ment LR, Vaccarino FM. Early postnatal astroglial cells produce multilineage precursors and neural stem cells in vivo. J Neurosci. 2006;26:8609–8621. doi: 10.1523/JNEUROSCI.2532-06.2006. [DOI] [PMC free article] [PubMed] [Google Scholar]
- Genoud C, Quairiaux C, Steiner P, Hirling H, Welker E, Knott GW. Plasticity of astrocytic coverage and glutamate transporter expression in adult mouse cortex. PLoS Biol. 2006;4:e343. doi: 10.1371/journal.pbio.0040343. [DOI] [PMC free article] [PubMed] [Google Scholar]
- Gras C, Vinatier J, Amilhon B, Guerci A, Christov C, Ravassard P, Giros B, El Mestikawy S. Developmentally regulated expression of VGLUT3 during early post-natal life. Neuropharmacology. 2005;49:901–911. doi: 10.1016/j.neuropharm.2005.07.023. [DOI] [PubMed] [Google Scholar]
- Halassa MM, Fellin T, Takano H, Dong JH, Haydon PG. Synaptic islands defined by the territory of a single astrocyte. J Neurosci. 2007;27:6473–6477. doi: 10.1523/JNEUROSCI.1419-07.2007. [DOI] [PMC free article] [PubMed] [Google Scholar]
- Higashimori H, Morel L, Huth J, Lindemann L, Dulla C, Taylor A, Freeman M, Yang Y. Astroglial FMRP-dependent translational down-regulation of mGluR5 underlies glutamate transporter GLT1 dysregulation in the fragile X mouse. Hum Mol Genet. 2013;22:2041–2054. doi: 10.1093/hmg/ddt055. [DOI] [PMC free article] [PubMed] [Google Scholar]
- Holmseth S, Dehnes Y, Huang YH, Follin-Arbelet VV, Grutle NJ, Mylonakou MN, Plachez C, Zhou Y, Furness DN, Bergles DE, Lehre KP, Danbolt NC. The density of EAAC1 (EAAT3) glutamate transporters expressed by neurons in the mammalian CNS. J Neurosci. 2012;32:6000–6013. doi: 10.1523/JNEUROSCI.5347-11.2012. [DOI] [PMC free article] [PubMed] [Google Scholar]
- Jacobs S, Doering LC. Astrocytes prevent abnormal neuronal development in the fragile X mouse. J Neurosci. 2010;30:4508–4514. doi: 10.1523/JNEUROSCI.5027-09.2010. [DOI] [PMC free article] [PubMed] [Google Scholar]
- Jaskolski F, Mulle C, Manzoni OJ. An automated method to quantify and visualize colocalized fluorescent signals. J Neurosci Methods. 2005;146:42–49. doi: 10.1016/j.jneumeth.2005.01.012. [DOI] [PubMed] [Google Scholar]
- Kang SH, Fukaya M, Yang JK, Rothstein JD, Bergles DE. NG2+ CNS glial progenitors remain committed to the oligodendrocyte lineage in postnatal life and following neurodegeneration. Neuron. 2010;68:668–681. doi: 10.1016/j.neuron.2010.09.009. [DOI] [PMC free article] [PubMed] [Google Scholar]
- Koulakoff A, Ezan P, Giaume C. Neurons control the expression of connexin 30 and connexin 43 in mouse cortical astrocytes. Glia. 2008;56:1299–1311. doi: 10.1002/glia.20698. [DOI] [PubMed] [Google Scholar]
- Lavialle M, Aumann G, Anlauf E, Pröls F, Arpin M, Derouiche A. Structural plasticity of perisynaptic astrocyte processes involves ezrin and metabotropic glutamate receptors. Proc Natl Acad Sci U S A. 2011;108:12915–12919. doi: 10.1073/pnas.1100957108. [DOI] [PMC free article] [PubMed] [Google Scholar]
- Mori T, Tanaka K, Buffo A, Wurst W, Kühn R, Götz M. Inducible gene deletion in astroglia and radial glia–a valuable tool for functional and lineage analysis. Glia. 2006;54:21–34. doi: 10.1002/glia.20350. [DOI] [PubMed] [Google Scholar]
- Muzumdar MD, Tasic B, Miyamichi K, Li L, Luo L. A global double-fluorescent Cre reporter mouse. Genesis. 2007;45:593–605. doi: 10.1002/dvg.20335. [DOI] [PubMed] [Google Scholar]
- Nagy JI, Patel D, Ochalski PA, Stelmack GL. Connexin30 in rodent, cat and human brain: selective expression in gray matter astrocytes, co-localization with connexin43 at gap junctions and late developmental appearance. Neuroscience. 1999;88:447–468. doi: 10.1016/S0306-4522(98)00191-2. [DOI] [PubMed] [Google Scholar]
- Nakashima K, Takizawa T, Ochiai W, Yanagisawa M, Hisatsune T, Nakafuku M, Miyazono K, Kishimoto T, Kageyama R, Taga T. BMP2-mediated alteration in the developmental pathway of fetal mouse brain cells from neurogenesis to astrocytogenesis. Proc Natl Acad Sci U S A. 2001;98:5868–5873. doi: 10.1073/pnas.101109698. [DOI] [PMC free article] [PubMed] [Google Scholar]
- Olsen ML, Higashimori H, Campbell SL, Hablitz JJ, Sontheimer H. Functional expression of Kir4.1 channels in spinal cord astrocytes. Glia. 2006;53:516–528. doi: 10.1002/glia.20312. [DOI] [PMC free article] [PubMed] [Google Scholar]
- Palma-Cerda F, Auger C, Crawford DJ, Hodgson AC, Reynolds SJ, Cowell JK, Swift KA, Cais O, Vyklicky L, Corrie JE, Ogden D. New caged neurotransmitter analogs selective for glutamate receptor sub-types based on methoxynitroindoline and nitrophenylethoxycarbonyl caging groups. Neuropharmacology. 2012;63:624–634. doi: 10.1016/j.neuropharm.2012.05.010. [DOI] [PubMed] [Google Scholar]
- Rubenstein JL, Merzenich MM. Model of autism: increased ratio of excitation/inhibition in key neural systems. Genes Brain Behav. 2003;2:255–267. doi: 10.1034/j.1601-183X.2003.00037.x. [DOI] [PMC free article] [PubMed] [Google Scholar]
- Sauvageot CM, Stiles CD. Molecular mechanisms controlling cortical gliogenesis. Curr Opin Neurobiol. 2002;12:244–249. doi: 10.1016/S0959-4388(02)00322-7. [DOI] [PubMed] [Google Scholar]
- Seifert G, Hüttmann K, Binder DK, Hartmann C, Wyczynski A, Neusch C, Steinhäuser C. Analysis of astroglial K+ channel expression in the developing hippocampus reveals a predominant role of the Kir4.1 subunit. J Neurosci. 2009;29:7474–7488. doi: 10.1523/JNEUROSCI.3790-08.2009. [DOI] [PMC free article] [PubMed] [Google Scholar]
- Shigetomi E, Tong X, Kwan KY, Corey DP, Khakh BS. TRPA1 channels regulate astrocyte resting calcium and inhibitory synapse efficacy through GAT-3. Nat Neurosci. 2012;15:70–80. doi: 10.1038/nn.3000. [DOI] [PMC free article] [PubMed] [Google Scholar]
- Shigetomi E, Bushong EA, Haustein MD, Tong X, Jackson-Weaver O, Kracun S, Xu J, Sofroniew MV, Ellisman MH, Khakh BS. Imaging calcium microdomains within entire astrocyte territories and endfeet with GCaMPs expressed using adeno-associated viruses. J Gen Physiol. 2013;141:633–647. doi: 10.1085/jgp.201210949. [DOI] [PMC free article] [PubMed] [Google Scholar]
- Song MR, Ghosh A. FGF2-induced chromatin remodeling regulates CNTF-mediated gene expression and astrocyte differentiation. Nat Neurosci. 2004;7:229–235. doi: 10.1038/nn1192. [DOI] [PubMed] [Google Scholar]
- Sun W, McConnell E, Pare JF, Xu Q, Chen M, Peng W, Lovatt D, Han X, Smith Y, Nedergaard M. Glutamate-dependent neuroglial calcium signaling differs between young and adult brain. Science. 2013;339:197–200. doi: 10.1126/science.1226740. [DOI] [PMC free article] [PubMed] [Google Scholar]
- Swanson RA, Liu J, Miller JW, Rothstein JD, Farrell K, Stein BA, Longuemare MC. Neuronal regulation of glutamate transporter subtype expression in astrocytes. J Neurosci. 1997;17:932–940. doi: 10.1523/JNEUROSCI.17-03-00932.1997. [DOI] [PMC free article] [PubMed] [Google Scholar]
- Theodosis DT, Poulain DA, Oliet SH. Activity-dependent structural and functional plasticity of astrocyte-neuron interactions. Physiol Rev. 2008;88:983–1008. doi: 10.1152/physrev.00036.2007. [DOI] [PubMed] [Google Scholar]
- Tien AC, Tsai HH, Molofsky AV, McMahon M, Foo LC, Kaul A, Dougherty JD, Heintz N, Gutmann DH, Barres BA, Rowitch DH. Regulated temporal-spatial astrocyte precursor cell proliferation involves BRAF signalling in mammalian spinal cord. Development. 2012;139:2477–2487. doi: 10.1242/dev.077214. [DOI] [PMC free article] [PubMed] [Google Scholar]
- Tzingounis AV, Wadiche JI. Glutamate transporters: confining runaway excitation by shaping synaptic transmission. Nat Rev Neurosci. 2007;8:935–947. doi: 10.1038/nrn2274. [DOI] [PubMed] [Google Scholar]
- Varoqui H, Schäfer MK, Zhu H, Weihe E, Erickson JD. Identification of the differentiation-associated Na+/PI transporter as a novel vesicular glutamate transporter expressed in a distinct set of glutamatergic synapses. J Neurosci. 2002;22:142–155. doi: 10.1523/JNEUROSCI.22-01-00142.2002. [DOI] [PMC free article] [PubMed] [Google Scholar]
- Xu J, Zhu Y, Contractor A, Heinemann SF. mGluR5 has a critical role in inhibitory learning. J Neurosci. 2009;29:3676–3684. doi: 10.1523/JNEUROSCI.5716-08.2009. [DOI] [PMC free article] [PubMed] [Google Scholar]
- Yang Y, Gozen O, Watkins A, Lorenzini I, Lepore A, Gao Y, Vidensky S, Brennan J, Poulsen D, Won Park J, Li Jeon N, Robinson MB, Rothstein JD. Presynaptic regulation of astroglial excitatory neurotransmitter transporter GLT1. Neuron. 2009;61:880–894. doi: 10.1016/j.neuron.2009.02.010. [DOI] [PMC free article] [PubMed] [Google Scholar]
- Yang Y, Vidensky S, Jin L, Jie C, Lorenzini I, Frankl M, Rothstein JD. Molecular comparison of GLT1+ and ALDH1L1+ astrocytes in vivo in astroglial reporter mice. Glia. 2011;59:200–207. doi: 10.1002/glia.21089. [DOI] [PMC free article] [PubMed] [Google Scholar]