

Abstract
We report on how a dimer of the cell-penetrating peptide TAT, dfTAT, penetrates live cells by escaping from endosomes with a particularly high efficiency. By mediating endosomal leakage, dfTAT also delivers proteins into cultured cells after a simple co-incubation procedure. Cytosolic delivery is achieved in most cells in a culture and only a relatively small amount of material remains trapped inside endosomes. Delivery does not require binding interactions between dfTAT and a protein, multiple molecules can be delivered at once, and delivery can be repeated. Remarkably, dfTAT-mediated delivery does not noticeably impact cell viability, proliferation, or gene expression. This new delivery strategy should be extremely useful for cell-based assays, cellular imaging applications, and the ex vivo manipulation of cells.
Keywords: Cell-penetrating peptide, cytosolic protein delivery, transcription factors
Protein transduction strategies are extremely useful for the investigation and manipulation of cellular processes. Proteins labeled with fluorophores or radioisotopes and delivered into live cells can be used for imaging applications or in cellulo structure determination, respectively1, 2. Furthermore, transcription factors that are rendered cell-permeable by tagging with cell-penetrating peptides (CPPs) or protein transduction domains (PTDs) have emerged as potential tools for ex-vivo tissue regeneration applications3. For instance, the transcription factors Oct4, Sox2, and Klf4 labeled with 11R or 9R reprogram fibroblasts into induced pluripotent stem cells4. The transcription factor HoxB4 tagged with the PTD TAT can also be used to expand hematopoietic stems cells in vitro and potentially increase the success rate of cell transplantation procedures5. These protein delivery approaches are thought to represent a safer alternative than DNA-based strategies because proteins presumably do not alter the genomic integrity of cells and because their activity is lost upon proteolysis6.
While these exciting proof-of-concept studies illustrate the unique opportunities provided by protein transduction technologies, current protocols are often suboptimal7, 8. PTD-proteins typically utilize the endocytic pathway as a route of cellular entry9. However, the majority of PTD–proteins endocytosed by cells typically remain trapped inside endosomes10. As a result, the level of protein that reaches the cytosol of cells is low and the biological outcomes achieved are poor10. A possible solution to this problem is to increase the ability with which proteins escape from the endocytic pathway. This is possible with membrane-destabilizing agents that disrupt endosomes. 11,12 To date, the efficiencies of available reagents remain nonetheless low 13, 14.
Ideally, a delivery strategy should combine efficient endosomal escape, low toxicity, and convenience in protocols. With this in mind, our aim was to develop an innocuous endosomolytic agent that efficiently delivers protein cargos in trans. Our working hypothesis was that dimerization of TAT labeled with the fluorophore tetramethylrhodamine (TMR) might enhance the endosomolytic activity of this CPP conjugate (fTAT). We show that formation of a disulfide bridge between two fTAT copies generates a reagent (dfTAT) that delivers proteins and small molecules into live cells extremely efficiently without affecting cell viability and proliferation.
Results
dfTAT penetrates the cytosol of live cells efficiently
TAT was used as a template for the design of a dimeric delivery vehicle. A lysine modified with TMR was introduced for fluorescence imaging and a cysteine was added at the N-terminus of TAT to permit dimerization by disulfide bond formation (Supplementary Fig. 1-2). Disulfide bonds are relatively stable inside endosomes, but are cleaved following endosomal escape and upon entry into the reducing cytosol7, 15, 16. The fluorescent peptide, CK(ε-NH-TMR)-TAT (fTAT) was purified as a reduced monomer. Incubation in oxygenated media and oxidation of the free cysteine thiol of fTAT generated the dimer (CK(ε-NH-TMR)TAT)2 (dfTAT) (Supplementary Fig. 3). Alternatively, the thiol of CK(ε-NH-TMR)TAT was acetamidated to obtain a peptide (acfTAT) which cannot dimerize or reacted with bismaleimidoethane to obtain a non-reducible dimer (nrdfTAT) (Supplementary Fig. 4-6). fTAT, acfTAT, dfTAT, and nrdfTAT were incubated for 1 h with HeLa, the mouse neuroblastoma cell line Neuro-2a, and human primary dermal fibroblasts (HDF). Internalization was first assessed by fluorescence microscopy. acfTAT (1-20 μM) localized in a punctate distribution consistent with accumulation of the peptide inside endosomes17 (Fig. 1a). The fluorescence signal of dfTAT was also punctate below 2 μM but became distributed in the cytosol and nucleus of an increasing number of cells at higher concentrations (Fig. 1b, Supplementary Fig. 7-10). The overall amount of dfTAT inside cells (cytosol+endosomes), also increased with the concentration of dfTAT administered extracellularly (Fig. 1c). In all cases, cells were not stained with SYTOX Blue, indicating that their plasma membrane is not compromised and that the cells imaged are alive. Similar to acfTAT, fTAT was localized inside endosomes at up to 10 μM. However, at 20 μM, many cells display cytosolic fluorescence, indicating that fTAT reproduces some of the activity of dfTAT by possibly dimerizing in situ (Supplementary Fig. 11). Finally, nrdfTAT displayed a cytosolic distribution similar to that obtained with dfTAT (Supplementary Fig. 6c), indicating that the disulfide bond present in dfTAT is not required for cytosolic penetration.
Figure 1.
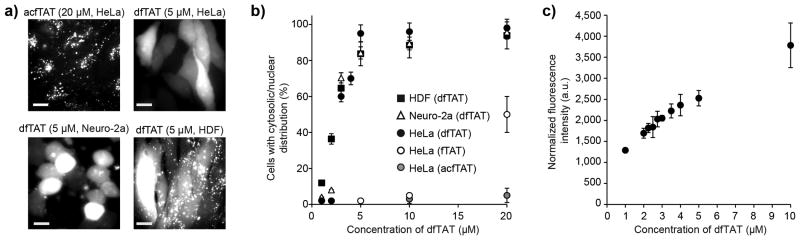
Cytosolic delivery of dfTAT in live cells is efficient and exceeds its monomeric counterparts. (a) Cellular localization of acfTAT and dfTAT assessed by fluorescence microscopy. Cells were incubated for 1 h with either acfTAT (20 μM) or dfTAT (5 μM), washed, and imaged with a 100x objective. Monochrome images represent the emission of TMR at 560 nm. Scale bars, 10 μm. (b) Comparison of the cytosolic delivery efficiency of acfTAT, fTAT, and dfTAT. Cells were incubated with acfTAT, fTAT, and dfTAT (1-20 μM) for 1 h. The number of cells with detectable cytosolic and nuclear fluorescence distribution in microcopy images was counted and divided by the total number of cells present (%) (1,000 cells/experiment). (c) dfTAT overall uptake in HeLa cells as a function of the concentration of dfTAT present in the incubation media. Cells were incubated with dfTAT (1-10 μM) for 1h and relative uptake was assessed quantitatively by measuring the bulk fluorescence of cell lysates (300,000 cells/experiment). The data shown in b and c represent the mean of triplicate experiments and the corresponding standard deviations.
dfTAT penetrates cells in a two-step process
To test whether endosomal escape is involved in delivery of dfTAT, the effects of molecules that affect endocytosis were assessed18-21. While filipin and chlorpromazine had little effect, amiloride and bafilomycin inhibited the delivery of dfTAT, suggesting that macropinocytosis and endosomal acidification are important for cytosolic penetration (Fig. 2a). To assess whether endosomal escape could be visualized, dfTAT was incubated with cells for 5 min to permit endocytic uptake, cells were washed and then imaged in a pulse-chase experiment. dfTAT was initially localized in a punctate distribution consistent with endosomes (100X objective, data not shown). Yet, an increasing number of cells displayed a cytosolic distribution at later time intervals. When imaged with a 20X objective, cells with a cytosolic distribution were brighter than cells with a punctate distribution (Supplementary Fig. 12) and this was used to quantify dfTAT's cytosolic penetration as a function of time (Fig. 2b). Consistent with the notion that dfTAT penetrates the cytosol after endocytic uptake, the percentage of cells with cytosolic fluorescence increased from 4.3 % to 76.9 % over a period of 40 min. To further test whether dfTAT escapes from endocytic organelles, cells were first incubated with DEAC-K9, a fluorescent peptide (Supplementary Fig. 13) that accumulates inside endosomes22. After washing, cells were incubated with dfTAT (Fig. 2c). While only a punctate distribution of fluorescence was observed with cells incubated with DEAC-K9 alone, subsequent addition of dfTAT led to a bafilomycin-dependent redistribution of the DEAC signal throughout the cytosol and nucleus. Together, these data indicate that dfTAT accumulates inside endosomes already containing DEAC-K9 and that dfTAT endosomal escape is also accompanied by the leakage of luminal DEAC-K9.
Figure 2.

dfTAT penetrates the cytosol by escaping from the endocytic pathway. (a) Assay showing the effect of endocytosis inhibitors on the cellular distribution of dfTAT. HeLa cells were pre-treated with each inhibitor for 20 min, washed, and incubated with 5 μM dfTAT and inhibitor for 1h. The percentage of cells displaying a cytosolic fluorescence distribution was quantified as in Fig. 1. Insert: image showing a punctate distribution of dfTAT in the presence of bafilomycin (1,000 cells/experiment, experiments were performed in triplicates, mean and corresponding standard deviations represented). Scale bar, 10 μm. (b) Pulse-chase experiment showing the progressive cytosolic penetration of dfTAT. HeLa cells were incubated with dfTAT (5μM) for 5 min, washed and imaged with a 20X objective (TMR fluorescence images are represented as inverted monochrome). The imaging intervals and corresponding percentages of cells with a cytosolic signal are represented. (c) Microscopy images showing that dfTAT causes the cytosolic release of molecules trapped inside endosomes. Hela cells were incubated with 5 μM DEAC-K9 for 1 h and washed. Cells were subsequently incubated with 5 μM dfTAT for 1 h. Images are represented as inverted monochromes. Scale bars, 10 μm. (d) Assay establishing the endosomolytic efficiency of dfTAT. HeLa cells expressing SNAP-H2B were incubated with 5 μM dfTAT and 5 μM SNAP-Surface 488. Representative fluorescence images of SNAP-Surface are shown (dfTAT is in insert). The SNAP-Surface 488 signal present in the nucleus is indicated as a % of the total signal. Scale bars, 10 μm.
dfTAT-mediated endosomal leakage is efficient
When endocytosed at similar levels, dfTAT escaped endosomes when acfTAT did not, indicating that dfTAT is greatly more endosomolytic than acfTAT and active inside endosomes as a dimer rather than a reduced monomer (Supplementary Fig. 14,15). However, the cytosolic fluorescence of dfTAT possibly obscures the signal that remains inside endosomes (fluorescence is also dimer inside endosomes than in the cytosol, Supplementary Fig. 12). Under such scenario, dfTAT endosomal escape would appear more dramatic than it really is. To establish more precisely the efficiency with which dfTAT mediates endosomal leakage, dfTAT was co-incubated with SNAP-Surface 488, a cell-impermeable green fluorophore that can react with the SNAP protein fusion tag23. The experiment was performed in cells expressing a SNAP-H2B histone construct so that SNAP-Surface 488 would label the nucleus of cells upon delivery, deplete the cytosolic signal, and reveal the amount of probe remaining trapped inside endosomes. Cells incubated with dfTAT and SNAP-Surface 488 displayed a nuclear staining (Fig. 2d) while cells incubated with SNAP-Surface 488 alone did not (Supplementary Fig. 16a). Cells with a brightly labeled nucleus also contained only few dim endosomes. Analysis of the fluorescence signal indicated that 50% to 90% of the fluorophore escaped endosomes.
dfTAT-mediated delivery is not deleterious to cells
By inducing efficient endosomal leakage, dfTAT might negatively impact cell physiology. In addition, endosomal leakage has been previously observed in cells undergoing apoptosis24. Endosomal leakage could therefore be either a cause or a consequence of cell death. To address these issues, viability of HeLa, MCH58, HDF and Neuro-2a cells treated with dfTAT for 1h was established 1 and 24 h after incubation using a SYTOX green exclusion assay (Supplementary Fig. 17 a and b). Viability was more than 95% after treating cells with 5 μM dfTAT for 1h, conditions required to achieve cytosolic distribution of dfTAT in >80%. Cell morphology was also unaffected by dfTAT incubation (Supplementary Fig. 18). Likewise, dfTAT incubation did not impact the proliferation rates of HDF, HeLa or Neuro-2a (Fig. 3a) and cells containing a cytosolic fluorescence signal indicative of efficient dfTAT endosomal escape were observed to divide normally by microscopy (Fig. 3b).
Figure 3.

dfTAT-mediated delivery does not significantly affect cell proliferation and transcription. (a) Proliferation assay. HeLa, Neuro-2a and HDF cells were incubated with 5 μM dfTAT for 1 h or left untreated. Proliferation was assessed using a MTT assay (150,000 cells/experiment, experiments in triplicates, mean and standard deviations represented). (b) Microscopy imaging showing that cells containing cytosolic dfTAT divide. HeLa cells were incubated with 5 μM dfTAT for 1 h, washed and imaged in a time-lapse experiment. Scale bars, 10 μm (c) Whole-genome microarray analysis of HDF cells treated with dfTAT. HDF cells were treated with 5 μM dfTAT for 1h and transcriptome analysis was performed immediately, 1h, or 24h after dfTAT treatment. The plot displays microarray intensity values of treated vs. untreated (same incubation steps but without peptide) samples. The red lines represent 2-fold intensity change cut-offs and transcripts up or down-regulated above these cut-offs are circled for clarity. (d) Microscopy imaging showing that dfTAT-mediated endosomal escape can be repeated. HeLa cells were co-incubated with dfTAT (5 μM) and DEAC-K9 (5 μM) for 1 h (step1) (images not shown). After washing, dfTAT (5 μM) and SNAP-Surface 488 (5 μM) were co-incubated in the absence (top panel) or presence (bottom panel) of bafilomycin (200 nM) (step 3). Scale bars, 10 μm.
To characterize the physiological impact of dfTAT cytosolic penetration in greater detail, transcriptome analysis was performed on HDF cells incubated for 1 h in L-15 media with or without 5 μM dfTAT. Cells harvested immediately after dfTAT incubation show 11 transcripts up or down-regulated more than 2-fold when compared to untreated cells (2-fold is used as a significance threshold, 47321 total transcripts detected, Fig. 3c). Only 2 transcripts were dysregulated in cells incubated in DMEM for an additional 1 h and 24 h after treatment with dfTAT (Fig. 3c, Supplementary Fig. 19). Together, these results indicate that dfTAT has a minimal impact on mRNA expression and that cells recover rapidly from dfTAT-mediated endosomal leakage (corroborated by quantitative proteomic profile experiments, Supplementary Fig. 20).
If dfTAT perturbs many endosomes during a delivery step, we envision that endocytic trafficking might be a cellular process likely to be negatively affected following peptide incubation. In particular, we reasoned that dfTAT could cause endosomal leakage after an initial treatment but fail to be endocytosed or remain trapped inside damaged endocytic organelles after a second dfTAT incubation. To test this idea, the step-wise delivery of two different molecules (DEAC-K9 and SNAP-Surface 488) was assessed. Cells were first incubated with dfTAT (5 μM) and DEAC-K9 (5 μM) for 1 h. As expected, this incubation resulted in the cytosolic distribution of both dfTAT and DEAC-K9 (data not shown). Twenty minutes later cells were incubated with dfTAT (5 μM) and SNAP-Surface 488 (5 μM) for 1 h. Cells treated with this two-step protocol displayed cytosolic and nuclear fluorescence of both DEAC-K9 and SNAP-Surface 488 (Fig. 3d and Supplementary Fig. 21). Delivery of SNAP-Surface 488 did not occur in the absence of dfTAT (Supplementary Fig. 16a) and was inhibited by bafilomycin, consistent with the notion that the second delivery step is also mediated by the endosomolytic activity of dfTAT. Moreover, the fluorescence of SNAP-Surface 488 examined was comparable to that obtained if SNAP-Surface 488 was delivered into untreated cells (one step delivery) or simultaneously with DEAC-K9 (Supplementary Fig. 22). Together these results establish that dfTAT-mediated delivery can be repeated. This, in turn, suggests that the endocytic route employed by dfTAT is not dramatically compromised after dfTAT-mediated endosomal leakage.
dfTAT delivers proteins inside live cells by simple co-incubation
To determining whether dfTAT could deliver large proteins into the cytosol of cells, EGFP (26 kDa) was first chosen as a model. Cells were incubated with EGFP and dfTAT for 1 h and examined by microscopy. EGFP was distributed into the cytosol and nucleus in more than 90% of cells without observable toxicity (Fig. 4a and Supplementary Fig. 23, 24). To estimate how much fluorescent and folded protein is delivered, cells were counted, harvested and lysed. The lysate was analyzed by PAGE and the fluorescence of EGFP was quantified. Based on this analysis, approximately 34 μM and 23 μM of EGFP is present per HDF and Neuro-2a cell, respectively (Supplementary Fig. 25, 26). As imaging confirms that a large fraction of EGFP escapes endosomes (Fig 4a), one can expect micromolar concentrations of proteins to be delivered in the cytosol of cells.
Figure 4.

Delivery of intact and functional proteins using co-incubation with dfTAT. (a) Microscopy imaging showing that dfTAT delivers EGFP into the cytosol of live cells. HeLa, Neuro-2a and HDF cells were co-incubated with EGFP (10 μM) and dfTAT (5 μM) for 1 h. Scale bars, 100X objective: 10 μm, 20X objective: 100 μm. (b) Assay showing that dfTAT improves the delivery of TAT-Cre. HeLa cells transfected with a plasmid containing egfp upstream of a loxP-STOP-loxP sequence were incubated for 1 h with either fTAT (5 μM) or dfTAT (5 μM) in the presence of TAT-Cre (1 μM). EGFP+ cells that result from successful TAT-Cre delivery were visualized and counted by microscopy (confirmed by flow cytometry). Scale bars, 100 μM. (c) Microscopy imaging showing that dfTAT mediates the delivery of an antibody. HeLa cells were co-incubated with FITC-anti-ATP5A (20 μg/mL) and dfTAT (5 μM) for 1 h. FITC-anti-ATP5A (green) is delivered in the cytosol of cells and stains tubular mitochondria (more clearly visible in zoomed-in image). Absence of SYTOX Blue staining indicates that the cells imaged do not have a compromised plasma membrane. Black arrows point to tubular mitochondria. Scale bars, 100X objective: 10 μm, zoomed-in image: 2 μm.
To determine whether dfTAT needs to interact with a particular protein in order to successfully deliver it, the binding of dfTAT to EGFP was characterized. No Förster resonance energy transfer (FRET) between dfTAT and EGFP could be detected under conditions used for cellular incubation assays (Supplementary Fig. 27). Similarly, no interaction between dfTAT and EGFP could be detected by native gel electrophoresis (Supplementary Fig. 28). In contrast, dfTAT and BSA were found to interact in this assay (presumably through electrostatic interactions). Interestingly, addition of BSA (or FBS or heparin) to cell incubation media reduced the cytosolic penetration of dfTAT in a concentration dependent manner (Supplementary Fig. 29).
To further confirm that functional proteins can penetrate cells upon incubation with dfTAT, delivery of Cre recombinase was tested. In this assay, Cre induces recombination of a loxP-STOP-loxP sequence upstream of the egfp gene of a reporter plasmid25. Therefore, cells transfected with the reporter plasmid express EGFP when Cre recombinase penetrates cells and excises the STOP signal sequence. Cells treated with TAT-Cre (1 μM) and dfTAT (5 μM) expressed EGFP (Fig. 4b). Moreover, the percentage of EGFP+ cells was greater in the presence of dfTAT (47%) than in the presence of fTAT or when TAT-Cre was incubated alone (< 5%). Next, the delivery of FITC-anti-ATP5A, a fluorescently labeled antibody that recognizes the alpha subunit of the mitochondrial ATP synthase, was examined. Cells treated with FITC-anti-ATP5A (20 μg/mL) and dfTAT (5 μM) contained green-fluorescent tubular structures (Fig. 4c). Co-localization with the blue-fluorescent mitochondrial marker pTagCFP-mito confirmed that these structures are mitochondria (Supplementary Fig. 30a). Cells treated with FITC-anti-IgG, an antibody that does not target mitochondria, did not stain tubular structures (Supplementary Fig. 30b). Together, these experiments confirm that dfTAT can deliver a functional antibody into live cells.
The transcription factor HoxB4 can penetrate cells and activate transcription, either by itself or when fused to TAT. 5, 26, 27We were therefore interested in determining whether dfTAT, by promoting cytosolic delivery, would enhance the transcriptional activity of the protein. NIH 3T3 cells were transfected with a vector containing the luciferase gene under a HoxB4-inducible promoter and with a β-galactosidase reporter as internal control. Cells were incubated with HoxB4 or TAT-HoxB4, in the absence or presence of dfTAT for 1.5 h. The expression of luciferase was assessed by measuring the luminescence of cell lysates (normalized to β-galactosidase activity, luciferase induction represents a ratio of treated versus untreated cells). HoxB4 and TAT-HoxB4 (200 nM) alone induced a 2.2 and 5.0-fold increase in luciferase activity, respectively (Fig. 5a). In contrast, addition of dfTAT (3 μM), led to 53.1 and 307.4-fold luciferase induction, respectively. Neither dfTAT alone nor dfTAT incubated with TAT-mCherry led to the induction of luciferase, indicating that luciferase expression is dependent on the presence of HoxB4.
Figure 5.
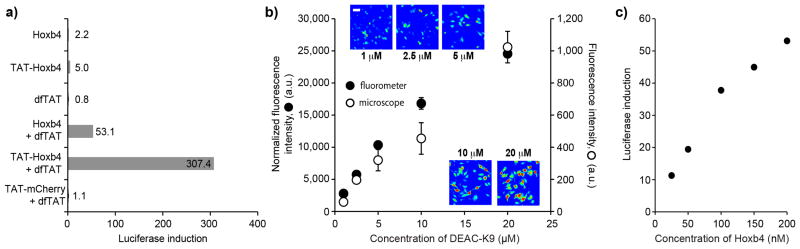
dfTAT-mediated delivery improves the delivery and transcriptional output of a transcription factor. (a) Assay showing that dfTAT mediated delivery of HoxB4 and TAT-HoxB4 improves the expression of a luciferase reporter. NIH 3T3 transfected with a HoxB4-dependent luciferase reporter were incubated for 1.5 h with either HoxB4 or TAT-HoxB4 (200 nM) in presence or absence of dfTAT (3 μM). TAT-mCherry (200 nM) and dfTAT (3 μM) serve as negative controls (400,000 cells/experiment, experiments in duplicate). (b) The amount of DEAC-K9 delivered in the cytosol and nucleus of live cells can be titrated. HeLa cells were incubated with dfTAT (5 μM) and increasing amounts of DEAC-K9 (1, 2.5, 5, 10, 20 μM). The fluorescence intensity of cells displaying cytosolic release was assessed by microscopy (representative 20X images are shown using a pseudocolored colorscale: blue=lowest intensity, red=highest intensity) and by measuring to the bulk fluorescence of cell lysates (microscope: 1,000 cells/experiment, fluorometer: 300,000 cells/experiment; experiments in triplicates, average and standard deviations represented). Scale bars, 10 μm (c) Assay showing that the induction of luciferase expression by dfTAT-mediated delivery of HoxB4 can be titrated. NIH 3T3 cells were co-incubated with HoxB4 (25-200 nM) and dfTAT (3 μM) and luciferase induction was measured as described in a (400,000 cells/experiment, experiments in duplicate).
While increasing the transcriptional output of HoxB4 is valuable, precisely controlling the level and activity of HoxB4 inside cells is therefore important to achieve desirable biological outcomes.28 Because dfTAT appears to act independently of the molecules used for co-incubation in our assays, we hypothesized that it might be possible to titrate the amount of protein that penetrate cells by varying the protein concentration in the media while keeping dfTAT concentration constant. Under this scenario, the efficiency of endosomal escape should remain unaffected but the amount of material released from endosomes should change. Initial experiments with DEAC-K9 showed that the amount of fluorescent peptide delivered inside cells could be titrated using this protocol (Fig. 5b and Supplementary Fig. 26). Consistent with these results, luciferase induction was proportional to the concentration of HoxB4 in the media, (Fig. 5c).
Discussion
By mediating endosomal leakage, dfTAT is remarkably efficient at delivering proteins, peptides, or small molecules into the cytosol of cells. Delivery is efficient because the amount of material that reaches the cytosol is substantial, the amount trapped inside endosomes is relatively low, and because cytosolic delivery occurs in most cells present in a sample. Endosomal escape appears to take place in most cells once dfTAT, which is intrinsically more endosomolytic than its monomeric counterpart, reaches a threshold concentration within endosomes. Future studies aimed at establishing the roles played by the two copies of the peptide TAT and of the fluorophore TMR, as well as their respective arrangement, should provide more molecular details about the activity of dfTAT. Establishing where dfTAT escapes from the endocytic pathway should also provide valuable insights on its endosomolytic activity.
A remarkable aspect of dfTAT-mediated delivery is the minimal cellular responses associated with the efficient endosomal leakage observed. This is surprising because light-induced endosomal lysis has been shown to be extremely toxic by causing the rapid release of calcium into the cytosol of cells29. In addition, the leakage of endolysosomal proteases could contribute to toxicity. Yet, cells are not only viable but also healthy. These results are presumably only valid for the 1 h dfTAT incubation used in our assays. Continous endosomal leakage induced by particulate wear debris induces inflammatory responses and apoptosis30. dfTAT could therefore promote similar effects if administered to cells for long incubation times. Notably, membrane repair mechanisms have also been shown to mask the effect of debris-induced endosomal leakage30. This, in turn, could also explain why dfTAT-mediated delivery is relatively innocuous under the conditions tested
dfTAT delivers cell-impermeable molecules displaying diverse structures and properties. DEAC-K9, like dfTAT, is highly positively charged and the pI of Cre (9.4), and HoxB4 (9.8) are also not suggestive of favorable electrostatic interactions with dfTAT. EGFP, a protein with a lower pI (6.2), does not significantly interact with dfTAT in vitro. It is therefore likely that dfTAT does not need to interact with a given protein outside the cell or within the lumen of endosomes to achieve cytosolic delivery of that protein. Instead, interactions that occur between dfTAT and a protein with low pI such as BSA are inhibitory. Interestingly, similar inhibitory effects between arginine-rich CPPs and negatively-charged species have been observed31, 32.
The co-incubation protocol used herein allows several cargos to be incubated and delivered at once. Alternatively, delivery can be performed in successive steps, without complex sample preparations and, as exemplified by the delivery of SNAP-surface 488 or FITC-anti-ATP5A, it is ideally suited for imaging applications. In addition, co-incubation provides the opportunity to titrate the extracellular concentration of target molecules independently of dfTAT. The amount of protein delivered to the cytosol and the biological output achieved can in turn be modulated. While this approach is presumably not optimal for in vivo delivery of biologics, it offers several advantages in the context of tissue cultures and ex vivo manipulation of cells. For instance, continuous overexpression of HoxB4 after retroviral delivery, in addition to promoting hematopoietic stem cell expansion, can lead to malignant transformation or sensitize cells to apoptosis in a dose-dependent manner.28 dfTAT-mediated delivery, by permitting HoxB4 levels and activity to be precisely controlled without genetic alterations, could provide cells that are safer for transplantation into patients.
Online Methods
Peptides design, synthesis, and purification
All peptides were synthesized in-house on the rink amide MBHA resin (Novabiochem) by SPPS using standard Fmoc protocols. Fmoc-Lys(Mtt)-OH, Fmoc-Lys(Boc)-OH, Fmoc-Gly-OH, Fmoc-Arg(Pbf)-OH, Fmoc-Gln(Trt)-OH, and Fmoc-Cys(Trt)-OH (Novabiochem) were used to assemble the peptides. Reactions were carried out in a SPPS vessel at room temperature using a stream of dry N2 to provide agitation. Fmoc deprotection was performed by addition of piperidine in dimethylformamide (DMF) (Fisher) (20%, 10 mL) to the Fmoc-peptide resin (0.30 mmol). Deprotection reactions were carried out for 1 × 5 min and 1 × 15 min with a washing step in between reactions. Amino acid coupling reactions were carried out for 4 h with a mixture of Fmoc-amino acid (1.2 mmol), HBTU (Novabiochem) (0.44 g, 1.1 mmol), and diisopropylethylamine (DIEA) (Sigma, St. Louis, MO) (0.51 mL, 3.0 mmol) in DMF. Upon completion of the reactions, the resin was washed with DMF and dichloromethane (DCM) (Fisher). For DEAC-K9, the DEAC fluorophore (AnaSpec) was coupled to the N-terminus of the peptide after coupling of the ninth Fmoc-Lys(Boc)-OH using a mixture of DEAC, HBTU, and DIEA (4, 3.9 and 10 eq in respect to the peptide) in DMF. The reaction was carried out overnight using a stream of dry N2 to provide agitation. For CK(ε-NH-TMR)TATG (fTAT), the Mtt protecting group at the ε-amino group of Lys on CK(ε-NH-Mtt)TATG was cleaved with 2% trifluoroacetic acid (TFA) (Fisher) and 2% triisopropylsilane (TIS) (Sigma) in DCM, and the resin was washed with DCM and DMF. A mixture of TMR, HBTU, and DIEA (4, 3.9 and 10 equiv in respect to the peptide) in DMF was added to the resin and the reaction was carried out overnight using dry N2 to provide agitation. Following Fmoc-deprotection and peptide assembly, the resin was washed with DCM and dried in vacuo. The resin was then treated with TFA containing 2.5% H2O, 2.5%, TIS, and 2.5% ethanedithiol (EDT) (Sigma) for 3 h at room temperature to achieve global deprotection and cleavage from the resin. The crude peptide products were precipitated and washed with cold anhydrous Et2O (Fisher). The precipitates were resuspended in water and lyophilized. The products obtained were then resuspended in 0.1% aqueous TFA/acetonitrile. The peptides were analyzed and purified by reverse-phase HPLC. HPLC analysis was performed on a Hewlett- Packard 1200 series instrument and an analytical Vydac C18 column (5 μm, 4 × 150 mm). The flow rate was 1 mL/min, and detection was at 214 nm and 550 nm. Semi-preparative HPLC was performed on a Vydac C18 10 × 250 mm column. The flow rate was 4 mL/min, and detection was at 214 nm and 550 nm. All runs used linear gradients of 0.1% aqueous TFA (solvent A) and 90% acetonitrile, 9.9% water, and 0.1% TFA (solvent B). The correct identity of the peptides was confirmed by MALDI-TOF performed with a Shimadzu/Kratos instrument (AXIMA- CFR). fTAT, expected mass: 2041.17, observed mass: 2040.66. DEAC-K9, expected mass: 1412.97, observed mass: 1415.59.
Synthesis of acetamidated C(S-CH2CONH2)K(ε-NH-TMR)TATG (acfTAT)
C(S-CH2CONH2)K(ε-NH-TMR)TATG was formed after addition of iodoacetamide (Sigma) (0.275 mg, 1.49 μmol) to CK(ε-NH-TMR)TATG (148 μg, 0.074 μmol) in 25 mM HEPES pH 7.5 under an atmosphere of N2. The product was purified using analytical reverse-phase HPLC. Expected mass (MALDI-TOF): 2098.19, observed mass: 2096.31.
Generation of dfTAT by dimerization of CK(TMR)TATG (fTAT)
dfTAT was formed by dissolving (0.3 mg, 1.5×10⁻⁴ mmol) fTAT in aerated phosphate buffer saline (PBS) pH 7.4 (5 mL). Oxygen dissolved in the buffer act to oxidize the thiol groups on the peptides and form a disulfide bond. The reaction was allowed to react overnight until completion (100% yield based on HPLC analysis). The product was purified using analytical reverse-phase HPLC. Expected mass (MALDI-TOF): 4080.34, observed mass: 4084.21.
Generation of nrdfTAT using fTAT
Two fTAT peptides linked by the Bismaleimidoethame (BMOE) (Pierce) linker (nrdfTAT) was formed by reacting pure fTAT (0.202 mg, 0.099 μmol) with BMOE (0.011 mg, 0.0496 μmol) for 3h in PBS buffer pH7.2 under an atmosphere of N2. The product was purified using analytical reverse-phase HPLC. Expected mass (MALDI-TOF): 4313.39, observed mass: 4303.
Cloning, overexpression and purification of TAT-Cre, TAT-mCherry, HoxB4, and TAT-HoxB4
The pTriEx-HTNC plasmid encoding His-tagged TAT-NLS-Cre (TAT-Cre) protein was purchased from Addgene (Cambridge). The TAT-Cre gene was then cloned into pTXB1 vector and transformed into E. coli BL21 (DE3) cells (Agilent Technologies). The protein was expressed and purified as described33. Briefly, TAT-Cre was expressed with 1 mM IPTG at 37 °C for 3 h. TAT-Cre was then purified to homogeneity using a Ni-NTA resin (Qiagen) and cation exchange chromatography (HiTrap SP HP)(GE Healthcare). pTXB1-TAT-mCherry was obtained by inserting the TAT DNA sequence into the pTXB1-mCherry plasmid. The oligonucleotides with sequences 5′-TAT GGG TCG TAA AAA ACG TCG TCA GCG TCG TCG TGG TCA-3′ and 3′-ACC CAG CAT TTT TTG CAG CAG TCG CAG CAG CAC CAG TAT-5′ (Integrated DNA Technologies) coding for the TAT sequence, which contain NdeI sites, were annealed to generate dsDNA. The pTXB1-mCherry plasmid was cut with NdeI (New England BioLabs) and ligated with TAT dsDNA. The pTXB1-TAT-mCherry plasmid was transformed into BL21 (DE3) cells and protein expression was induced with 1 mM IPTG at 16 °C for 24 h. Cells were harvested and resuspended in lysis buffer containing 20 mM Tris-Cl (pH 7.5) and 200 mM NaCl. After cell lysis by sonication and high-speed centrifugation at 15K RPM for 1 h, the soluble fraction was applied to chitin resin (New England BioLabs) pre-equilibrated with lysis buffer and incubated overnight at 4°C (the protein contains a C-terminal intein-chitin binding domain purification tag). The resin was washed with 10 column volumes of lysis buffer. The protein was cleaved from the resin by incubating the beads with 1 column volume of cleavage buffer supplemented with 100 mM 2-mercaptoethanesulfonic acid and for 24 hr at 4°C. The protein was further purified using cation exchange chromatography. EGFP was cloned, expressed and purified as previously described. The double mutant EGFP (dmEGFP) was obtained by introducing the mutations (C49S, C71V) in the EGFP plasmid using site directed mutagenesis Because dmEGFP does not contain any Cys residue, this protein is unable to form a disulfide bond with fTAT. In all assays, results obtained with EGFP were similar to those obtained with dmEGFP. In the text both EGFP and dmEGFP are therefroe referred to as EGFP for simplicity. The pTAT-HA-HoxB4 vector was generously provided by G. Sauvageau, Montreal University, Montreal, Quebec, Canada. His(6)-HoxB4 was produced by cloning the HoxB4 gene into pET-28a. Briefly, the HoxB4 cDNA was first amplified from pTAT-HA-HOXB4 by using primers designed to introduce the NdeI & XhoI sites, at the 5′ and 3′ ends, respectively (5′-GGC ATT CAT ATG GCT ATG AGT TCT TTT TTG ATC AAC TCA- 3′; 5′-GGT CAG TCT CGA GCT AGA GCG CGC GGG G-3′) (IDT). The PCR fragment was then inserted into the corresponding NdeI & XhoI sites of the 6xHis-tag vector, pET-28a. The fidelity of the reading frame was confirmed by sequencing. The procedure for the purification of both TAT-HoxB4 and HoxB4 is similar and has been previously described5. Briefly, BL21 (DE3) cells were transformed with either pTAT-HA-HoxB4 or pET28a-HoxB4 and induced at 37 °C for 5 hours with 1 mM IPTG. The pelleted cells were lysed by sonication in Buffer A (8 M Urea, 20 mM HEPES, 200 mM NaCl, pH 8.0). Lysates, which were obtained via high-speed centrifugation (14K RPM, 30 minutes at 22 °C), were then adjusted to 10 mM imidazole and incubated with Ni-NTA Agarose beads for 60 minutes at room temperature. The nickel beads were then washed with Buffer A containing 20 mM and 40 mM imidazole to eliminate the presence of any non-specific products and bound proteins were subsequently eluted with 100 mM and 250 mM imidazole in Buffer A. Eluates from both concentrations of imidazole containing the proteins of interest (i.e., TAT-HoxB4 or HoxB4) were loaded on a HiTrap SP HP column at 4 °C in Buffer B (4 M Urea, 20 mM HEPES, 50 mM NaCl, pH 6.5) and eluted on the FPLC in a single-step at 4 °C with Buffer C (20 mM HEPES, 1 M NaCl, pH 8.0). Both proteins were immediately desalted by diluting with 20 mM HEPES (pH 8.0) and concentrated using centrifugal filter units with 10K MWCO (EMD Millipore), aliquoted and flash-frozen at -80 °C. Protein concentrations were determined using the Bradford protein assay (Bio-Rad).
Delivery of peptides inside live cells
Live cells from different lines (HeLa, HaCat, NIH 3T3, COLO 316, HDF, Neuro-2a and MCH58) were grown in Dulbecco's Minimum Essential Media (DMEM) (Fisher) supplemented with 10% fetal bovine serum (FBS) (Fisher) and 1X penicillin/streptomycin (P/S) (Fisher) and kept at 37 °C in a humidified atmosphere containing 5% CO2. Intestinal Porcine epithelial cells (IPEC-1) were cultured in growth medium, containing DMEM, 10% FBS, insulin (5μg/ml; Sigma), hydrocortisone (1μg/ml; Sigma), EGF (5ng/ml; BD Biosciences), and 1X P/S and kept at 37 °C in a humidified atmosphere containing 5% CO234. Cells were then seeded in 8-well dishes so that the cells were 80%-90% confluent after 48 h. Each well was washed 3 times with PBS and Leibovitz's L-15 medium that did not contain the amino acid cysteine (non-reducing L-15, nrL-15). The media (nrL-15) used for incubation lacks cysteine to avoid reduction of the disulfide bond of dfTAT. Cells were then incubated with different concentrations of the acfTAT, fTAT, dfTAT or nrdfTAT at 37 °C for 5 to 60 min. Cells were washed 3 times with PBS and nrL-15 and placed on an inverted epifluorescence microscope (Model IX81, Olympus) equipped with a heating stage maintained at 37 °C. Images were collected using a Rolera-MGI Plus back-illuminated EMCCD camera (Qimaging, Surrey). Images were acquired using bright field imaging and three standard fluorescence filter sets: CFP (Ex = 436 ± 10 nm / Em= 480 ± 20 nm), RFP (Ex = 560 ± 20 nm / Em= 630 ± 35 nm), and FITC (Ex = 488 ± 10 nm / Em= 520 ± 20 nm). The fluorescence intensities of different cells were measured with the SlideBook 4.2 software (Olympus) and the average fluorescence intensity was determined for each condition. We have previously reported that CPPs labeled with fluorophores such as TMR can photosensitize membranes and cause endosomal leakage upon light irradiation22, 35. Light exposure of dfTAT trapped inside endosomes (e.g. after incubation at 2 μM) can also cause endosomal leakage (not shown). However, several pieces of evidence indicate that light does not play a significant role in the activity of dfTAT reported herein. First, all delivery experiments were performed under conditions of minimal light irradiation (dark room with dim red light). When fluorescence imaging is required, probes (e.g. SNAP surface 488, EGFP) are imaged before dfTAT is, thereby minimizing the possible effect of light on endosomal release. For experiments performed with Cre and Hoxb4, cells are not imaged and not exposed to light (not at all for Hoxb4, 12h after incubation for Cre). In addition, the light dose required to observe light-induced endosomal leakage is typically 10 to 20 fold greater than that used for imaging.
Delivery of small molecules, peptides and proteins inside live cells by co-incubation with dfTAT
HeLa, HDF and Neuro-2a cells were seeded in 8-well dishes, grown and washed as described in the prior section. Cells were then co-incubated with 5 μM delivery peptide and with the cargo at the corresponding concentration for 1 h at 37 °C. Cells were washed 3 times with PBS and nrL-15 and placed on the microscope. Images were acquired as described before. For transfection and expression of SNAP-H2B and TagCFP-mito, plasmids were mixed with Lipofectamine™ 2000 reagent in opti-MEM media and incubated at room temperature for 30 min. The DNA complex was added to previously seeded HeLa cells (80% confluent) on an 8-well dish and cells were kept at 37 °C for 24 h. After 24 h, the wells were washed 3 times with PBS and nrL-15 prior to performing the delivery experiments using the SNAP-Surface 488 or FITC-anti-ATP5A. As should be noted that SNAP-Surface 488 fluorescence is quenched (80%) before it reacts with the SNAP fusion tag23.
Quantitative determination of peptide and macromolecule uptake inside cells
HeLa cells were seeded in a 48 well dish, grown and washed as described above. For the peptide uptake experiment, each well was incubated for 1 h with varying concentration of acfTAT, fTAT or dfTAT (range: 5-25 μM peptide concentration). For the titration experiment, cells were incubated with dfTAT (5 μM) and varying concentration of DEAC-K9 (range: 1-20 μM) or EGFP (10 μM) for 1h. Cells were then washed with PBS with heparin (1 mg/mL) and nrL-15 and imaged. To lyse cells, nrL-15 was removed from the wells and a total of 100 μL of lysis buffer (50 mM Tris pH 7.5, 2 mM EDTA, 2 mM DTT, 0.1% TritonX-100) was incubated with cells for 5 min (alternatively, cells were trypsinized and counted as described in the flow cytometry section). Cells were scraped off the dish and the cell lysate was pipetted into a 1.5 mL microcentrifuge tube and centrifuged at 13k RPM for 25 min. For uptake measurement (Supplementary Fig. 15), 70 μl of supernatant were collected and placed in a 96 well plate. The fluorescence emission intensity was measured using a plate reader equipped with a fluorescence module (Ex=525, Em=580-640 nm) (GloMax®-Multi+ Detection System, Promega). Alternatively (Fig. 5b), 80 μL of supernatant was diluted to a total volume of 100 μL and the bulk fluorescence was measured using a SLM-8000C fluorometer (Ex=435 nm, Em=465-475 nm) (SLM Instruments). Fluorescence intensities were normalized to total protein concentration in each well (determined by Bradford Protein Assay where 10 μL of each cell lysate is added to 200 μL of a 1x protein assay reagent, incubated at room temperature for 30 min; absorbance at 600 nm is measured using the plate reader). To determine the amount of EGFP uptake (Supplementary Fig. 24), cell lysates (27 μl) were mixed with 3 μL of 5x SDS-PAGE loading buffer lacking DTT and analyzed by SDS-PAGE (the sample is not boiled so as to avoid EGFP unfolding; SDS-PAGE does not unfold EGFP as described in36 DTT is not included to avoid cleavage of the disulfide bond that might form between fTAT and EGFP. Calibration curves were established for EGFP and DEAC-K9 by analyzing samples of know concentrations using SDS-PAGE gel and fluorescence, respectively. All experiments were performed in triplicate.
Quantitative analysis of TAT-HoxB4 & HoxB4 delivery with fTAT and dfTAT using a luciferase reporter
The murine fibroblast cell line (NIH-3T3, stably transfected with the E2A-PBX vector), the luciferase reporter vector, pML (5xHOX/PBX; contains a promoter with binding sites for HOXB4 and PBX) and the β-gal internal control vector used in the following studies were kindly provided by P. Zandstra (University of Toronto, Ontario, Canada). The cells were initially cultured in 100 mm dishes at 37 °C with 5% CO2 in DMEM supplemented with 10% FBS. For experimental purposes, however, cells were seeded in 24-well plates at a density of 5-6×10⁴ cells/ well for 24 hours. Subsequently, cells were co-transfected with 0.8 μg/mL of pML (5xHOX/PBX) and of the β-gal internal control vector using Lipofectamine 2000. Twelve hours post-transfection, cells were washed and incubated with TAT-HoxB4 or HoxB4 (both at 200 nM, unless, otherwise noted; see below) with or without fTAT or dfTAT in nrL-15 for 90 min. Some cells were also incubated with TAT-mCherry (200 nM) with and without the peptides. After incubation, all cells were washed with PBS and lysed according to the manufacturer's protocol for the reporter lysis buffer (RLB) (Promega). For titration experiments, the same protocol was followed, with the exception that HoxB4 concentrations were varied (25, 50, 100, 150 and 200 nM). In order to quantitate the luciferase reporter activity, 100 μL of luciferase assay reagent (Promega) was added to 20 μL of cell lysate and bioluminescence was immediately measured using a SpectraMaxL luminometer (Molecular Devices). For the purposes of measuring transfection efficiency, 180 μL of β-gal assay buffer was mixed with 20 μL of cell lysate in a 96-well plate and incubated at 37 °C for 30 min. The β-gal assay buffer is comprised of 75% 0.1 M sodium phosphate, pH 7.5, 24% o-nitrophenyl β-D-galactopyranoside (ONPG made at a concentration of 4 mg/mL in 0.1 M sodium phosphate) (Sigma) and 1% 100-fold solution (10% 1 M magnesium chloride solution, 32% β-mercaptoethanol, and 58% distilled water). Absorbance was then measured at 450 nm using the plate reader. Since the absorption spectrum of the chromophore (TMR) conjugated to the peptide used in this study overlaps with that of β-gal, 20 μL of cell lysate containing the peptide was also diluted with 180 μL of the lysis buffer and absorbance values obtained at 450 nm were subtracted from that of the β-gal absorbance values. The luciferase activity of all samples was determined as a ratio of the luciferase activity to the β-gal activity and the fold-increase in luciferase activity was established by normalizing the luciferase activity of each sample to that of cells, which were transfected, but had no protein delivered.
Cell viability assays
In order to determine cells that had compromised plasma membranes, cells were treated with SYTOX Green (SYTOX Blue in some cases) and Hoechst (Invitrogen). SYTOX dyes are cell-impermeable and stain the DNA of cells with compromised plasma membranes. The Hoechst dye is cell-permeable and stains the DNA of all cells. Images were acquired using the green and blue filter. The green and blue images were used to count cells with a blue or green stained nucleus. Image J was used to count the dead (green) and total cells (blue). Cytotoxicity was determined from the ratio of SYTOX Green positive cells/total number of cells. An MTT-assay was performed to determine the effect of the peptide on cell proliferation. Cells were seeded in a 6-well dish, grown and washed as described above. One well from the dish was incubated with 5 μM dfTAT at 37 °C for 1 h. A second well was left untreated and served as control. Cells were wash 3 times with PBS and nrL-15. Cells were trypsinized and seeded into 96-well dishes containing 200 μL of DMEM. The cells were then allowed to attach to the bottom of the dish for 12 h. The MTT assay was then performed at specific time points to measure cell proliferation. The DMEM was removed, replaced with 100 μL of nrL-15, and 10 μL of a 12 mM MTT stock solution was added to the wells. The 96-well dish was incubated at 37 °C for 4 h. After the incubation 100 μL of a 10 mM SDS-HCl solution was added to each well. The solution was mixed thoroughly by pipetting up and down and incubated for 13 h. After the incubation each sample was mixed and the absorbance at 600 nm was measured. Controls included a negative control where 10 μL MTT was added to 100 μL of nrL-15 alone (no cells). A second control consisted of cells treated with the delivery peptide but to which no MTT was added to subtract the contribution of TMR from the measured absorbance. The absorbance of the negative control was subtracted from all samples. The final time point measurement for each cell type corresponded to 100% cell confluency.
Whole-genome microarray analysis
HDF cells were cultured in 24-well dishes and incubated with L-15 (untreated cells), L15 supplemented with dfTAT (5 μM, treated cells), or L15 supplemented with staurosporine (0.1 μM) for 1h. Cells were trypsinized immediately after washing with PBS or L-15 (1h time point). Alternatively, cells were trypsinized after 1h (1h+1h) and 24h (1h+24h) incubation in 10% FBS/DMEM. Cells were removed from each well by gentle pipetting. and spun down at 12k RPM for 4 min at 4°C. The cell pellets were preserved in 1 ml TRIzol (Ambion, Life Technology) and shipped frozen to the UTsouthwestern microarray facility where total RNA was extracted and analyzed a Illumina Human HT-12 v4 sequencer and reported protocols (https://microarray.swmed.edu/protocols/protocol/illumina-gene-expression-probe-labeling/).
DIGE proteomic analysis
HDF cells were treated with or without dfTAT as described in the whole-genome microarray analysis. assay. A volume of 150 μL of lysis buffer (10mM Tris pH7.5, 1% CHAPS and 1X protease inhibitor cocktail) was added to each well. After 5 min, the solution was transferred to an eppendorf tube and 20 μL nuclease cocktail was added to the cell lysates and incubated on ice for 30 min. The lysate was spun down at 13k RPM for 10 min at 4°C. The supernatant was saved and an aliquot was used in BioRad protein assay for quantification of total protein in the cell lysates. Methanol/chloroform precipitation was performed on the remaining sample. All DIGE were performed with pH3-10NL gradients. Each sample (˜ 50μg of protein) was resuspended in 30 μl labeling buffer (7 M urea, 2 m thiourea, 4% CHAPS, 30 mM Tris, 5 mM magnesium acetate). All samples were individually labeled with Cy3 or Cy5 (GE Healthcare) for 30 min on ice and in the dark (200 pmol) after which the reaction was quenched by the addition of 10 mM lysine for 10 min followed by the addition of an equal volume of 2X rehydration buffer (7 M urea, 2 M thiourea, 4% CHAPS, 4 mg/ml DTT. The combined sample were brought up to 250 μl with 1× rehydration buffer (7 M urea, 2 M thiourea, 4% CHAPS, 2 mg/ml DTT, 0.5% IPG buffer pH 3-10). All strips were subjected to isoelectric focusing for 25000 vHr, according to manufacturers recommendations. DIGE-associated instrumentation was manufactured by GE Healthcare. Electrophoresis instrumentation was from Hoefer. Cy2/3/5-specific 16-bit data files were acquired at 100-μm resolution separately by dye-specific excitation and emission wavelengths using a Typhoon Trio Variable Mode Imager in a manner that greater than 90% of the proteins were in the linear range of detection.
Determination of dfTAT and EGFP interaction by FRET
Fluorescence emission spectra were obtained using an SLM-8000C fluorometer upgraded with the phoenix package (ISS) and Vinci v.1.6 PC software (ISS). The experiments were conducted using a quartz cuvette at room temperature. The samples were excited at 488nm (slit width=1 mm) and the fluorescence emission was scanned from 500 to 650 nm (slit width = 1mm). All samples (1 μM EGFP or dmEGFP) and 5 μM dfTAT) were prepared using nrL-15. A 12% native gel was run using Tris/Glycine running buffer at 100mV for 2h. Samples containing dfTAT (5 or 10 μM) were co-incubated with either varying concentration of dmEGFP (10-20 μM) or BSA (10μM) in nrL-15 (pH 5.0 and 7.0) for 30 min at 37°C prior to gel loading.-1 Fluorescent images of dfTAT and EGFP bands on the gel were detected using a fluorescence scanner (Typhoon, GE healthcare) (dfTAT fluorescence detection: Ex 568nm, Em 620nm; EGFP fluorescence detection: Ex 488 nm, Em 525 nm). Gels were then stained with coomassie blue according to protocol.
Supplementary Material
Figure S1. Structure and expected mass of fTAT.
Figure S2. Structure and expected mass of dfTAT.
Figure S3. Characterization of fTAT and dfTAT (a) HPLC analysis and MALDI-TOF MS spectrum of purified CK(ε-NH-TMR)TATG (fTAT) (retention time (rt): 14.2 min) (fTAT, expected mass = 2041.17, observed mass = 2040.66) (b) HPLC analysis and MALDI-TOF MS spectrum of purified dfTAT. dfTAT was obtained by incubating fTAT in oxygenated buffer overnight. After HPLC purification, dfTAT shows a single peak with a rt = 22.7 min. (dfTAT, expected mass = 4080.34, observed mass: M+1/1H+ = 4084.21 Da M+2/2H+ = 2041.32) (c) HPLC analysis of reduction reaction of dfTAT after addition of the reducing agent tris(2-carboxyethyl)phosphine (TCEP). Pure dfTAT was mixed with a solution of TCEP (50 mM) in water and allowed to react for 15 min. The HPLC chromatogram show a peak with rt = 14.3 min and is identical to the retention time of pure fTAT.
Figure S4. Structure and expected mass of acfTAT.
Figure S5. Characterization of acfTAT. HPLC analysis and MALDI-TOF MS spectrum of pure acfTAT (rt = 8.93 min) (expected mass: 2098.19, observed mass: 2096.31).
Figure S6. Characterization and delivery of nrdfTAT (a) Structure and expected mass of nrdfTAT (b) HPLC analysis and MALDI-TOF mass spectrum of purified nrdfTAT (rt: 13.9min, expected mass = 4313.39, observed mass= 4303) (d) Cytosolic delivery of nrdfTAT into live cells. HeLa cells were incubated with nrdfTAT ((i) 2.5-5 μM and (ii) 5-10 μM *) for 1h. Fluorescence images (monochrome (white=fluorescence signal, black=no signal) 20X image, center panel) show cytosolic delivery of nrdfTAT into HeLa cells at both concentrations. SYTOX Blue (2 μM) was used as an indicator of cell death. Scale bars, 50 μm (Inverted monochrome 20X image).
* The concentration of nrdfTAT was estimated by measuring the absorbance of TMR using a spectrophotometer, as described with other peptides. However, nrdfTAT has two TMR spaced by a 8.0 Å BMOE linker and such close proximity might affect the extinction coefficient of TMR. In order to take this effect into account, a concentration range for nrdfTAT was calculated based on the extinction coefficient of free TMR (91,500 mol-1cm-1) and that of dfTAT (45,500 mol-1cm-1) (dfTAT also has two TMR in close proximity).
Figure S7. Cytosolic and nuclear fluorescence distribution of dfTAT is concentration dependent. HeLa cells were incubated with varying concentration of dfTAT (1, 2, 2.5, 2.25, 2.5, 2.75, 3, 4, 5 μM). Cells were washed and imaged. Inverted monochrome images (20X objective) show a dramatic increase in the cytosolic delivery of the peptide between 2-5 μM. Although not shown here, the number of cells in each image is approximately the same as determined by bright field imaging. Cells that display a fluorescence punctate distribution are not clearly visible under these imaging conditions. Further analysis of these cells using a 100X objective clearly show a fluorescence punctate distribution indicative of peptide trapped in endosomes. Scale bars, 50 μm.
Figure S8. Delivery of dfTAT into the cytosol and nucleus of live cells was achieved in multiple cell lines. The cell lines HeLa, NIH 3T3, COLO 316 and HaCaT were incubated with 5 μM dfTAT for 1 h, washed and imaged. The fluorescence signal detected was in the cytosol and nucleus of cells (top panel: 20X objective, bottom panel: 100X objective). After imaging, cells were incubated at 37 °C in a humidified atmosphere containing 5% CO2 for 24 h, washed and imaged again (top panel: 20X objective, bottom panel: 100X objective). The cell morphology did not change after 24 h. Cell viability is assessed by exclusion of the cell-impermeable nuclear stain SYTOX Blue at both 1h and 24 h time point. The TMR fluorescence at the 24 h time point is different to that obtained at the 1 h time point presumably because of the intracellular degradation of the peptide. Scale bars, 20X objective: 50 μm; 100X objective: 10 μm.
Figure S9. Delivery of dfTAT into the cytosol and nucleus of live cells was achieved in multiple cell lines. (a) The cell lines Neuro-2a, HDF and MCH58 were incubated with 5 μM dfTAT for 1 h, washed and imaged. The fluorescence signal detected was in the cytosol and nucleus of cells (top panel: 100X objective, bottom panel: 20X objective). After imaging, cells were incubated at 37 °C in a humidified atmosphere containing 5% CO2 for 24 h, washed and imaged (20X objective). Bright field images show that the morphology of cells 24 h after incubation is identical to that of cells imaged immediately after incubation. Cell viability is assessed by exclusion of the cell-impermeable nuclear stain SYTOX Blue at both 1h and 24 h time point. The TMR fluorescence at the 24 h time point is different to that obtained at the 1 h time point presumably because of the intracellular degradation of the TAT peptide and release of the TMR fluorophore. Scale bars, 20X objective: 50 μm; 100X objective: 10 μm. (b) Histogram of flow cytometry data. HeLa cells were incubated with 5 μM dfTAT or no peptide (control) for 1h. Cells were then trypsinized for 5 min, resuspended in a total of 200 μl of nrL-15, and analyzed by flow cytometry (BD Accuri C6 Flow Cytometer). Histograms show that 99.7 % of cells contained red fluorescence.
Figure S10. Delivery of dfTAT into the cytosol and nucleus of primary intestinal porcine epithelial cells (IPEC-1). Cells were incubated with 5 μM dfTAT for 1h, washed and then imaged. Fluorescence (monochrome) images show cytosolic and nuclear distribution of dfTAT in IPEC-1 cells. Scale bars: 10 μm.
Figure S11. fTAT cellular localization after incubation with live cells depends on its concentration in the extracellular media. Inverted monochrome (black=fluorescence signal, white=no signal) fluorescence images of HeLa cells incubated with 10 or 20 μM of fTAT for 1 h. fTAT displays at fluorescence punctate distribution at 10 μM fTAT (left panel) while at 20 μM fTAT shows a significant increase in the population of cells displaying cytosolic and nuclear fluorescence distribution. Scale bars, 50 μm.
Figure S12. Fluorescence emission spectra of dfTAT (5 μM) before and after reduction with the reducing agent TCEP (50 mM). The sample was excited at 556 nm and the emission was recorded between 570-750nm. The emission spectra show that the fluorescence emission of dfTAT increases upon reduction of its disulfide bond. This is indicative of TMR self-quenching in the context of dfTAT.
Figure S13. Structure and characterization of DEAC-K9.(a) Structure and expected mass of DEAC-K9. (b) Characterization of DEAC-K9. HPLC analysis and MALDI-TOF MS spectrum of pure DEAC-K9 (rt = 14.40 min) (expected mass: 1412.97, observed mass: 1415.59)
Figure S14. dfTAT displays a high endosomolytic activity when compared to acfTAT. HeLa cells were incubated with dfTAT (5 μM) for 5 min and acfTAT (50 μM) for 1 h. After 1 h, the cells were washed with PBS/heparin, imaged and lysed. The lysis buffer used in this experiment contains 2 mM DTT. The bulk fluorescence of cell lysates on a 96-well plate was measured using a plate reader. The fluorescence of each sample was normalized to total protein content in the cell lysate, as determined by a Bradford protein assay. Similarly, the fluorescence of solutions of acfTAT at different concentrations (0.1, 0.5, 1, 5 and 10 μM) was measured using a plate reader. A calibration curve of the peptide fluorescence intensity v.s. peptide concentration was established. These data was used to estimate the average concentration of acfTAT and dfTAT inside cells. Data shows higher fluorescence intensity for acfTAT than dfTAT inside cells. These data suggests that dfTAT is a dimer inside endosomes and that this peptide is more endosomolytic than acfTAT (Model 1).
Figure S15. Peptide overall uptake in HeLa cells as a function of the concentration of peptide present in the media. The uptake of the three peptides by HeLa cells was measured as a function of concentration (μM). Cells were incubated with either acfTAT (5-25 μM), fTAT(5-25 μM) or dfTAT (1-10 μM) and the bulk fluorescence of cell lysates on a 96-well plate was measured using a plate reader. The fluorescence of each sample was normalized to total protein content in the cell lysate, as determined by a Bradford protein assay. Data shows a linear increase in the fluorescence uptake of cells incubated with dfTAT. The lysis buffer used in this experiment contains 2 mM DTT. dfTAT is reduced to the monomeric fTAT upon this treatment. Consequently, the normalized fluorescence of dfTAT was divided by two (dfTAT/2) to compare the uptake of dfTAT to that of fTAT (the signal of one molecule of dfTAT gives a signal twice that of a molecule of internalized fTAT in this assay).
Figure S16. SNAP-Surface 488 enters cells via endocytosis. (a) HeLa cells were incubated with 5 μM SNAP-Surface 488 for 1 h, washed and imaged. Inverted monochrome image shows a punctate fluorescence distribution from SNAP-Surface 488 (right panel). (b) HeLa cells were incubated with 5 μM SNAP-Surface 488 and 2.5 μM dfTAT (a concentration in which dfTAT incubation does not result in significant cytosolic release) for 1 h, washed and imaged. Inverted monochrome image shows SNAP-Surface 488 accumulation in endocytic organelles (punctate distribution) (right panel) and colocalization with TMR signal. Bright field images show HeLa cells morphology did not change after uptake of SNAP-Surface 488 and/or dfTAT (right panels). Scale bars, 10 μm.
Figure S17. dfTAT is not toxic to cells under conditions where efficient endosomal escape is achieved. (a) HeLa, MCH58, HDF and Neuro-2a cells were incubated with (1-50 μM) dfTAT for 1 h. Cell viability was assessed by a SYTOX Green exclusion assay 1, 24, and 48 h (for HeLa) after incubation (1,000 cells/experiment, experiments in triplicates, average and standard deviations represented). (b) Histogram of flow cytometry data. HeLa cells were incubated with 5 μM dfTAT or no peptide (control) for 1h, washed and then incubated in SYTOX Green (1 μM) for 15 min. Cells were then trypsinized for 5 min, resuspended in a total of 200 μl of nrL-15, and analyzed by flow cytometry (BD Accuri C6 Flow Cytometer). Histograms show that only 2% and 7.5% of cells are stained with the cell impermeable dye SYTOX Green for untreated and treated cells, respectively. (c) HeLa cells were incubated with 5 μM dfTAT for 1h in the presence of regular-L15, washed and then incubated in SYTOX Green (2 μM) for 15 min. Cells were imaged using fluorescence microscopy to determined the amount of cells stained with SYTOX Green. Bar graph shows that 1 hr and 24 hr after incubation only 3.1 % and 1.4 % of the cell population was stained with the dye, respectively.
Figure S18. The cellular localization of acfTAT and dfTAT is different after incubation with live cells. (a) Fluorescence (monochrome) and bright field images (100X objective) of HeLa cells incubated with 20 μM acfTAT (left panel) and 5 μM dfTAT (right panel). The acfTAT peptide displays a fluorescence punctate distribution while dfTAT exhibits a cytosolic and nuclear fluorescence distribution. Bright field images show no change in HeLa cell morphology upon peptide delivery. Scale bar, 10 μm.
Figure S19. mRNA expression analysis in the presence of staurosporine (a) In order to establish a positive control for the microarray analysis, staurosporin was used to induce apoptosis in HDF cells. Cells were treated with staurosporine (0.1 μM) for 1h and mRNA levels were analyzed as described in Figure 3. The identity of transcripts related to apoptosis that were up-regulated (highlighted in red) and down-regulated (highlighted in green) upon treatment with staurosporin are listed. Notably, a total of 1830 transcripts were found to be up- or down-regulated out of 47321 transcripts detected. (b) Analysis of the microarray intensities of untreated HDF cells vs. those of HDF cells treated with staurosporine (0.1 μM) for 1h. The red lines represent the 2-fold cut-offs. (c) Table listing the identity of transcripts that are up-regulated (highlighted in red) and down-regulated (highlighted in green) in HDF cells incubated with dfTAT (5 μM) and analyzed immediately after incubation (1h), or 1h (1h+1h) and 24 h (1h+24h) after incubation. The 11, 2, and 2 transcripts listed represent the total number of transcripts up or down-regulated in the 1h, 1h+1h, and 1h+24h samples, respectively.
Figure S20. DIGE proteomic analysis of HDF cells treated with dfTAT (5 μM) for 1 h. (a) Representative green and red fluorescence overlay of 2D gel of cells treated with or without dfTAT for 1h and incubated in fresh media for an additional 1h (1+1h samples, treated sample is labeled with Cy3 and untreated with Cy5). Green and red were used as pseudo colors for Cy3 and Cy5 dyes, respectively, and a yellow color is indicative of equal fluorescence intensities. (b) Table summarizing analysis results obtained from the DIGE using the DeCyder v6.5 suite of software tools (GE Healthcare). Data was obtained using a 2 standard deviation model (95% confidence). Each pair (treated vs. untreated) were individually analyzed based on the normalized volume ratio of each individual protein spot from Cy3- or Cy5- labeled sample.
Figure S21. dfTAT mediates delivery of two cargos simultaneously inside live cells. (a) HeLa cells expressing SNAP-H2B were incubated with 5 μM dfTAT, 5 μM SNAP-Surface 488 and 5 μM DEAC-K9. Fluorescence images (RGB and inverted monochrome) show cytosolic and nuclear localization of dfTAT (red fluorescence), DEAC-K9 (blue fluorescence) and SNAP-Surface 488 (green fluorescence). Moreover, the SNAP-Surface signal accumulated in the nucleus as shown in Figure 2c. (b) HeLa cells were incubated with 5 μM dfTAT, 5 μM SNAP-Surface 488 and 5 μM DEAC-K9. Fluorescence and inverted monochrome images show cytosolic and nuclear fluorescence localization of dfTAT (red fluorescence), DEAC-K9 (blue fluorescence) and SNAP- Surface 488 (green fluorescence). Scale bars, 10μm.
Figure S22. Delivery of SNAP-Surface 488 did not occur in the absence of dfTAT during the two-step delivery protocol. HeLa cells were first incubated with 5 μM dfTAT and 5 μM DEAC-K9 for 1 h. Cells were then washed, incubated with 5 μM SNAP-Surface 488 for 1 h and imaged. In one hand, inverted monochrome images show cytosolic and nuclear localization of TMR and DEAC but, in the other hand, SNAP-Surface 488 display a fluorescence punctate distribution. Scale bar, 10μm.
Figure S23. dfTAT mediated delivery of intact EGFP into different cell lines. HeLa (top panel) and NIH 3T3 (bottom panel) cells were incubated with EGFP (10 μM) and dfTAT (5 μM) for 1 h, washed and imaged. Images show a homogenous cytosolic fluorescence distribution of EGFP in HeLa and NIH 3T3 cells. Scale bars, 10 μm.
Figure S24. dfTAT mediated delivery of intact EGFP into HeLa and primary HDF cells. HeLa and primary HDF cells were incubated with EGFP (10 μM) and dfTAT (5 μM) for 1 h, washed and imaged. Images show a homogenous cytosolic fluorescence distribution of EGFP and dfTAT in HeLa and primary HDF cells. Scale bars, 50 μm.
Figure S25. Quantitation of the concentration of EGFP delivered into the cytosol of HDF and Neuro-2a. HDF and Neuro-2a cells were co-incubated with dfTAT (5 μM) and EGFP (10 μM) for 1 h. After 1 h, cells were wash with PBS/heparin and lysed. The cell lysate was treated with nucleases and an aliquot of 27 μL was analyzed by PAGE (top right panel). Similarly, samples of known EGFP concentrations (determined by measuring absorbance at 488 nm and using an extinction coefficient of 55,000 mol-1cm-1) were analyzed by PAGE (top left panel). A fluorescence imager was used to measure the EGFP fluorescence intensity from the cell lysates and EGFP calibration samples. Silver staining was used to detect all proteins in the lysate. A calibration curve of EGFP fluorescence intensity vs. EGFP concentration was established and used to estimate the average concentration of EGFP in the cell lysates. The data obtained was used to calculate the concentration of EGFP per cell. Important numbers: Cell number on well: 79,600 (determined by flow cytometry); Cell volume: 2000 μm3 (bionumbers.hms.harvard.edu.)
Figure S26. The amount of DEAC-K9 delivered into cells can be titrated. HeLa cells were incubated with dfTAT (5 μM) and different concentrations of DEAC-K9 (1, 2.5, 5, 10 and 20 μM) for 1 h. Cells were wash with PBS/heparin, imaged and lysed. The bulk fluorescence of cell lysates containing DEAC-K9 was measured using a fluorometer. Similarly, the fluorescence of solutions of DEAC-K9 at different concentrations (0.01. 0.1, 1, 10 and 100 μM) was measured using a fluorometer. A calibration curve of DEAC-K9 intensity vs. DEAC-K9 concentration was established. These data was used to estimate the average concentration of DEAC-K9 inside cells. Data shows a linear increase in the amount of DEAC-K9 delivered inside cells (top right panel). Consistent with these data, fluorescence images that show an increase in the fluorescence signal in the cytosol cells with increasing concentrations o DEAC-K9 incubated in the media (top left panel, and Figure 5).
Figure S27. dfTAT and EGFP do not interact when co-incubated. (a) Fluorescence emission spectrum of EGFP (1 μM) (donor FRET pair) (EGFP, Ex/Em 488/508 nm) excited at 488 nm. The spectrum show an intense emission peak at around 510 nm and a small shoulder peak around 548 nm (b) Fluorescence emission spectrum of a solution of EGFP (1 μM) and dfTAT (5 μM) (acceptor FRET pair) (TMR, Ex/Em 556/580 nm) excited at 488 nm. The spectrum shows an intense emission peak at around 510 nm and a small shoulder peak around 548 nm. The contribution of TMR to the EGFP fluorescence spectrum (crossover fluorescence) was determined by measuring the fluorescence emission of a solution of dfTAT (5 μM) excited at 488 nm (not shown). The spectrum of the solution with EGFP and dfTAT is almost identical to the spectrum of EGFP alone (TMR fluorescence crossover signal was subtracted). (c) Fluorescence emission spectrum of ligated EGFP-CK(TMR). Using expressed protein ligation, EGFP was chemically ligated to CK(TMR) as described to produce EGFP-CK(TMR)7. EGFP-CK(TMR) was used a positive control for the FRET signal. Upon excitation at 488 nm, a dramatic increase in fluorescence between 560-630nm is observed (fluorescence max approximately 580 nm), indicative of a FRET signal due the close proximity between fluorophores. This increase in fluorescence intensity was not observed in the spectrum in part b) (indicative of no interactions between EGFP and dfTAT). Emission of all samples was scanned from 500 to 650 nm.
Figure S28. dfTAT does not interact with EGFP. (a) Native gel electrophoresis was used to determine binding interaction between dfTAT and EGFP. Samples were prepared by incubating dfTAT (5 μM) with either EGFP (10 μM) or BSA (10 μM, protein with a pI = 4.7, used as a positive control) in nrL-15 for 30 min at 37 °C (pH 7.0, representing the pH of the extracellular milieu of the cell and pH 5.0 representing the lower pH that exists along the endocytic pathway). dfTAT alone, EGFP alone and BSA alone at the same concentration and pH were loaded on the same gel as controls. Fluorescence Images of the gel were acquire using a Typhoon scanner. Green fluorescent bands correspond to EGFP and red fluorescence band correspond to dfTAT fluorescence. Red fluorescent bands corresponding to both dfTAT and BSA indicate binding between peptide and protein. In contrast, dfTAT fluorescence is not detected in bands corresponding to EGFP, indicating absence of binding. An image of the commassie stained native gel is also shown (top left corner). (b) Coomassie staining, red fluorescence, and green fluorescence images of samples of dfTAT and EGFP at varying concentration and analyzed by native gel electrophoresis. Similar results were obtained with dmEGFP (EGFP not containing cysteine residues, data not shown).
Figure S29. Effect of BSA, heparin and FBS on dfTAT cell penetration (a) Co-incubation of dfTAT with BSA results in a decrease in the percentage of cells displaying cytosolic release of dfTAT. HeLa cells were co-incubated with 5 μM dfTAT and 10 μM BSA for 1h. Cells show a punctate distribution of the peptide (monochrome 100X image) indicative of peptide being trapped in endocytic vesicles. In comparison, HeLa cells incubated with dfTAT (5 μM) alone show a homogenous cytosolic and nuclear distribution of peptide in a majority of cells. (b) Effect of FBS and heparin on dfTAT mediated cellular. HeLa cells were incubated with 5 μM dfTAT and heparin (1-100 μg/mL) or FBS (0.1-10%) for 1 h. Cells were washed and imaged. The % cells with cytosolic and nuclear distribution was calculated as described in Figure 1(b). Scale bars: 10 μm.
Figure S30. The FITC-anti-ATP5a antibody co-localizes with a fluorescently labeled mitochondrial protein expressed in live cells after dfTAT-mediated delivery. (a) Cells expressing TagCFP-mito (left) were imaged using the FITC and CFP filters. Tubular mitochondria were clearly observed only in the CFP channel. In a separate experiment, dfTAT (5 μM) and FITC-anti-ATP5A (20 μg/mL) were incubated for 1 h with cells expressing TagCFP-mito. The inverted monochrome images show co-localization of FITC-anti-ATP5A (FITC channel) and TagCFP-mito (CFP channel). Scale bars, 2 μm. (b) To confirm that the mitochondrial staining is specific to FITC-anti-ATP5A, an antibody without an intracellular epitope, FITC-anti-IgG, was delivered with dfTAT. FITC-anti-IgG (20 μg/mL) and dfTAT (5 μM) were incubated with cells for 1 h. Inverted monochrome images show a homogenous cytosolic fluorescence distribution (top). In contrast, cells that were incubated with FITC-anti-ATP5A show fluorescence in tubular structures (bottom). Scale bars, zoom-in image: 2 μm, 100X objective: 10 μm.
Acknowledgments
This article was supported by Award Number R01GM087227 and R01GM087981 from the National Institute of General Medical Sciences, the Norman Ackerman Advanced Research Program, and the Robert A. Welch foundation (Grant A-1769). We are grateful to Dr. Mauricio Lasagna (Texas A&M University, College Station, TX) for technical assistance with FRET assay as well as Dr. Robert Chapkin (Texas A&M University, College Station, TX) for access to the luminometer and flow cytometer in his laboratory. We thank Dr. Connie Cepko (Harvard Medical School, Boston, MA) for pCALNL-GFP, Dr. Klaus Rajewsky (MDC, Berlin, Germany) for pTriEx-HTNC, Dr. Guy Sauvageau (Montreal University, Montreal, Quebec, Canada) for pTAT-HA-HoxB4, Dr. Peter Zandstra (University of Toronto, Ontario, Canada) for the HoxB4 luciferase reporter, engineered 3T3 cells, and β-gal vectors and Dr. Ivan R. Correa (New England Biolabs, Ipswich, MA) for pSNAP-H2B and SNAP-Surface 488. We also thank Dr. James Sacchettinni (Texas A&M University, College Station, TX) for providing HDF and Neuro-2a cells, Dr. Eric Shoubridge (Montreal Neurological Institute and Hospital, Montreal, Quebec, Canada) for MCH58 cells and Dr. Guoyao Wu (Texas A&M University, College Station, TX) for primary intestinal porcine epithelial cells.
Footnotes
Author contributions: A.E.-O., K.N., L.D. and J.-P.P. designed experiments. A.E.O., K.N., L.D. generated and processed data. A.E.-O., K.N., L.D., T.-Y.W and G.J. contributed reagents. A.E.-O., K.N. and J.P.P. wrote, edited and approved the final manuscript.
Declaration of competing financial interests: We declare that the authors have no competing interests as defined by Nature Publishing Group, or other interests that might be perceived to influence the results and/or discussion reported in this article.
References
- 1.Takeuchi T, et al. Direct and rapid cytosolic delivery using cell-penetrating peptides mediated by pyrenebutyrate. ACS Chemical Biology. 2006;1:299–303. doi: 10.1021/cb600127m. [DOI] [PubMed] [Google Scholar]
- 2.Sakakibara D, et al. Protein structure determination in living cells by in-cell NMR spectroscopy. Nature. 2009;458:102–105. doi: 10.1038/nature07814. [DOI] [PubMed] [Google Scholar]
- 3.Kim D, et al. Generation of human induced pluripotent stem cells by direct delivery of reprogramming proteins. Cell stem cell. 2009;4:472–476. doi: 10.1016/j.stem.2009.05.005. [DOI] [PMC free article] [PubMed] [Google Scholar]
- 4.Krosl J, et al. In vitro expansion of hematopoietic stem cells by recombinant TAT-HOXB4 protein. Nat Med. 2003;9:1428–1432. doi: 10.1038/nm951. [DOI] [PubMed] [Google Scholar]
- 5.Maherali N, Hochedlinger K. Guidelines and techniques for the generation of induced pluripotent stem cells. Cell stem cell. 2008;3:595–605. doi: 10.1016/j.stem.2008.11.008. [DOI] [PubMed] [Google Scholar]
- 6.Lee YJ, Datta S, Pellois JP. Real-time fluorescence detection of protein transduction into live cells. Journal of the American Chemical Society. 2008;130:2398–2399. doi: 10.1021/ja7102026. [DOI] [PubMed] [Google Scholar]
- 7.Schwarze SR, Hruska KA, Dowdy SF. Protein transduction: unrestricted delivery into all cells? Trends in Cell Biology. 2000;10:290–295. doi: 10.1016/s0962-8924(00)01771-2. [DOI] [PubMed] [Google Scholar]
- 8.Dietz GPH, Bδhr M. Delivery of bioactive molecules into the cell: the Trojan horse approach. Molecular and Cellular Neuroscience. 2004;27:85–131. doi: 10.1016/j.mcn.2004.03.005. [DOI] [PubMed] [Google Scholar]
- 9.Pan C, Lu B, Chen H, Bishop C. Reprogramming human fibroblasts using HIV-1 TAT recombinant proteins OCT4, SOX2, KLF4 and c-MYC. Mol Biol Rep. 2010;37:2117–2124. doi: 10.1007/s11033-009-9680-6. [DOI] [PMC free article] [PubMed] [Google Scholar]
- 10.Erazo-Oliveras A, Muthukrishnan N, Baker R, Wang TY, Pellois JP. Improving the endosomal escape of cell-penetrating peptides and their cargos: strategies and challenges. Pharmaceuticals. 2012;5:1177–1209. doi: 10.3390/ph5111177. [DOI] [PMC free article] [PubMed] [Google Scholar]
- 11.Gratton JP, et al. Cell-permeable peptides improve cellular uptake and therapeutic gene delivery of replication-deficient viruses in cells and in vivo. Nat Med. 2003;9:357–362. doi: 10.1038/nm835. [DOI] [PubMed] [Google Scholar]
- 12.Hoyer J, Schatzschneider U, Schulz-Siegmund M, Neundorf I. Dimerization of a cell-penetrating peptide leads to enhanced cellular uptake and drug delivery. Beilstein Journal of Organic Chemistry. 2012;8:1788–1797. doi: 10.3762/bjoc.8.204. [DOI] [PMC free article] [PubMed] [Google Scholar]
- 13.Eguchi A, et al. Efficient siRNA delivery into primary cells by a peptide transduction domain-dsRNA binding domain fusion protein. Nat Biotech. 2009;27:567–571. doi: 10.1038/nbt.1541. [DOI] [PMC free article] [PubMed] [Google Scholar]
- 14.Austin CD, et al. Oxidizing potential of endosomes and lysosomes limits intracellular cleavage of disulfide-based antibody–drug conjugates. Proceedings of the National Academy of Sciences of the United States of America. 2005;102:17987–17992. doi: 10.1073/pnas.0509035102. [DOI] [PMC free article] [PubMed] [Google Scholar]
- 15.Dominska M, Dykxhoorn DM. Breaking down the barriers: siRNA delivery and endosome escape. Journal of Cell Science. 2010;123:1183–1189. doi: 10.1242/jcs.066399. [DOI] [PubMed] [Google Scholar]
- 16.Puri V, et al. Cholesterol modulates membrane traffic along the endocytic pathway in sphingolipid-storage diseases. Nat Cell Biol. 1999;1:386–388. doi: 10.1038/14084. [DOI] [PubMed] [Google Scholar]
- 17.Koivusalo M, et al. Amiloride inhibits macropinocytosis by lowering submembranous pH and preventing Rac1 and Cdc42 signaling. The Journal of Cell Biology. 2010;188:547–563. doi: 10.1083/jcb.200908086. [DOI] [PMC free article] [PubMed] [Google Scholar]
- 18.Johnson LS, Dunn KW, Pytowski B, McGraw TE. Endosome acidification and receptor trafficking: bafilomycin A1 slows receptor externalization by a mechanism involving the receptor's internalization motif. Molecular Biology of the Cell. 1993;4:1251–1266. doi: 10.1091/mbc.4.12.1251. [DOI] [PMC free article] [PubMed] [Google Scholar]
- 19.Vercauteren D, et al. The use of inhibitors to study endocytic pathways of gene carriers: optimization and pitfalls. Mol Ther. 2010;18:561–569. doi: 10.1038/mt.2009.281. [DOI] [PMC free article] [PubMed] [Google Scholar]
- 20.Rejman J, Bragonzi A, Conese M. Role of clathrin- and caveolae-mediated endocytosis in gene transfer mediated by lipo- and polyplexes. Mol Ther. 2005;12:468–474. doi: 10.1016/j.ymthe.2005.03.038. [DOI] [PubMed] [Google Scholar]
- 21.Srinivasan D, et al. Conjugation to the cell-penetrating peptide TAT potentiates the photodynamic effect of carboxytetramethylrhodamine. PloS one. 2011;6:e17732. doi: 10.1371/journal.pone.0017732. [DOI] [PMC free article] [PubMed] [Google Scholar]
- 22.Sun X, et al. Development of SNAP-Tag fuorogenic probes for wash-free fluorescence imaging. Chembiochem. 2011;12:2217–2226. doi: 10.1002/cbic.201100173. [DOI] [PMC free article] [PubMed] [Google Scholar]
- 23.Johnson JR, Kocher B, Barnett EM, Marasa J, Piwnica-Worms D. Caspase-activated cell-penetrating peptides reveal temporal coupling between endosomal release and apoptosis in an RGC-5 cell model. Bioconjugate chemistry. 2012;23:1783–1793. doi: 10.1021/bc300036z. [DOI] [PMC free article] [PubMed] [Google Scholar]
- 24.Kazantsev A, Preisinger E, Dranovsky A, Goldgaber D, Housman D. Insoluble detergent-resistant aggregates form between pathological and nonpathological lengths of polyglutamine in mammalian cells. Proceedings of the National Academy of Sciences. 1999;96:11404–11409. doi: 10.1073/pnas.96.20.11404. [DOI] [PMC free article] [PubMed] [Google Scholar]
- 25.Csaszar E, et al. An automated system for delivery of an unstable transcription factor to hematopoietic stem cell cultures. Biotechnology and bioengineering. 2009;103:402–412. doi: 10.1002/bit.22297. [DOI] [PubMed] [Google Scholar]
- 26.Amsellem S, et al. Ex vivo expansion of human hematopoietic stem cells by direct delivery of the HOXB4 homeoprotein. Nat Med. 2003;9:1423–1427. doi: 10.1038/nm953. [DOI] [PubMed] [Google Scholar]
- 27.Will E, et al. HOXB4 inhibits cell growth in a dose-dependent manner and sensitizes cells towards extrinsic cues. Cell Cycle. 2006;5:14–22. doi: 10.4161/cc.5.1.2304. [DOI] [PubMed] [Google Scholar]
- 28.Muthukrishnan N, Johnson GA, Lim J, Simanek EE, Pellois JP. TAT-mediated photochemical internalization results in cell killing by causing the release of calcium into the cytosol of cells. Biochimica et biophysica acta. 2012;1820:1734–1743. doi: 10.1016/j.bbagen.2012.06.020. [DOI] [PMC free article] [PubMed] [Google Scholar]
- 29.Scharf B, et al. Annexin A2 binds to endosomes following organelle destabilization by particulate wear debris. Nat Commun. 2012;3:755. doi: 10.1038/ncomms1754. [DOI] [PMC free article] [PubMed] [Google Scholar]
- 30.Tung CH, Mueller S, Weissleder R. Novel Branching Membrane Translocational Peptide as Gene Delivery Vector. Bioorganic and Medicinal Chemistry. 2002;10:3609–3614. doi: 10.1016/s0968-0896(02)00248-1. [DOI] [PubMed] [Google Scholar]
- 31.Jiang T, et al. Tumor imaging by means of proteolytic activation of cell-penetrating peptides. Proceedings of the National Academy of Sciences of the United States of America. 2004;101:17867–17872. doi: 10.1073/pnas.0408191101. [DOI] [PMC free article] [PubMed] [Google Scholar]
- 32.Peitz M, Pfannkuche K, Rajewsky K, Edenhofer F. Ability of the hydrophobic FGF and basic TAT peptides to promote cellular uptake of recombinant Cre recombinase: A tool for efficient genetic engineering of mammalian genomes. Proceedings of the National Academy of Sciences. 2002;99:4489–4494. doi: 10.1073/pnas.032068699. [DOI] [PMC free article] [PubMed] [Google Scholar]
- 33.Gonzalez-Vallina R, W H, Zhan R, Berschneider HM, Lee RM, Davidson NO, Black DD. Lipoprotein and apolipoprotein secretion by a newborn piglet intestinal cell line (IPEC-1) Am J Physiol. 1996;271:249–259. doi: 10.1152/ajpgi.1996.271.2.G249. [DOI] [PubMed] [Google Scholar]
- 34.Muthukrishnan N, Johnson GA, Erazo-Oliveras A, Pellois JP. Synergy between cell-penetrating peptides and singlet oxygen generators leads to efficient photolysis of membranes. Photochemistry and photobiology. 2012 doi: 10.1111/php.12036. [DOI] [PMC free article] [PubMed] [Google Scholar]
- 35.Hunt ME, Scherrer MP, Ferrari FD, Matz MV. Very bright green fluorescent proteins from the pontellid copepod Pontella mimocerami. PloS one. 2010;5:e11517. doi: 10.1371/journal.pone.0011517. [DOI] [PMC free article] [PubMed] [Google Scholar]
Associated Data
This section collects any data citations, data availability statements, or supplementary materials included in this article.
Supplementary Materials
Figure S1. Structure and expected mass of fTAT.
Figure S2. Structure and expected mass of dfTAT.
Figure S3. Characterization of fTAT and dfTAT (a) HPLC analysis and MALDI-TOF MS spectrum of purified CK(ε-NH-TMR)TATG (fTAT) (retention time (rt): 14.2 min) (fTAT, expected mass = 2041.17, observed mass = 2040.66) (b) HPLC analysis and MALDI-TOF MS spectrum of purified dfTAT. dfTAT was obtained by incubating fTAT in oxygenated buffer overnight. After HPLC purification, dfTAT shows a single peak with a rt = 22.7 min. (dfTAT, expected mass = 4080.34, observed mass: M+1/1H+ = 4084.21 Da M+2/2H+ = 2041.32) (c) HPLC analysis of reduction reaction of dfTAT after addition of the reducing agent tris(2-carboxyethyl)phosphine (TCEP). Pure dfTAT was mixed with a solution of TCEP (50 mM) in water and allowed to react for 15 min. The HPLC chromatogram show a peak with rt = 14.3 min and is identical to the retention time of pure fTAT.
Figure S4. Structure and expected mass of acfTAT.
Figure S5. Characterization of acfTAT. HPLC analysis and MALDI-TOF MS spectrum of pure acfTAT (rt = 8.93 min) (expected mass: 2098.19, observed mass: 2096.31).
Figure S6. Characterization and delivery of nrdfTAT (a) Structure and expected mass of nrdfTAT (b) HPLC analysis and MALDI-TOF mass spectrum of purified nrdfTAT (rt: 13.9min, expected mass = 4313.39, observed mass= 4303) (d) Cytosolic delivery of nrdfTAT into live cells. HeLa cells were incubated with nrdfTAT ((i) 2.5-5 μM and (ii) 5-10 μM *) for 1h. Fluorescence images (monochrome (white=fluorescence signal, black=no signal) 20X image, center panel) show cytosolic delivery of nrdfTAT into HeLa cells at both concentrations. SYTOX Blue (2 μM) was used as an indicator of cell death. Scale bars, 50 μm (Inverted monochrome 20X image).
* The concentration of nrdfTAT was estimated by measuring the absorbance of TMR using a spectrophotometer, as described with other peptides. However, nrdfTAT has two TMR spaced by a 8.0 Å BMOE linker and such close proximity might affect the extinction coefficient of TMR. In order to take this effect into account, a concentration range for nrdfTAT was calculated based on the extinction coefficient of free TMR (91,500 mol-1cm-1) and that of dfTAT (45,500 mol-1cm-1) (dfTAT also has two TMR in close proximity).
Figure S7. Cytosolic and nuclear fluorescence distribution of dfTAT is concentration dependent. HeLa cells were incubated with varying concentration of dfTAT (1, 2, 2.5, 2.25, 2.5, 2.75, 3, 4, 5 μM). Cells were washed and imaged. Inverted monochrome images (20X objective) show a dramatic increase in the cytosolic delivery of the peptide between 2-5 μM. Although not shown here, the number of cells in each image is approximately the same as determined by bright field imaging. Cells that display a fluorescence punctate distribution are not clearly visible under these imaging conditions. Further analysis of these cells using a 100X objective clearly show a fluorescence punctate distribution indicative of peptide trapped in endosomes. Scale bars, 50 μm.
Figure S8. Delivery of dfTAT into the cytosol and nucleus of live cells was achieved in multiple cell lines. The cell lines HeLa, NIH 3T3, COLO 316 and HaCaT were incubated with 5 μM dfTAT for 1 h, washed and imaged. The fluorescence signal detected was in the cytosol and nucleus of cells (top panel: 20X objective, bottom panel: 100X objective). After imaging, cells were incubated at 37 °C in a humidified atmosphere containing 5% CO2 for 24 h, washed and imaged again (top panel: 20X objective, bottom panel: 100X objective). The cell morphology did not change after 24 h. Cell viability is assessed by exclusion of the cell-impermeable nuclear stain SYTOX Blue at both 1h and 24 h time point. The TMR fluorescence at the 24 h time point is different to that obtained at the 1 h time point presumably because of the intracellular degradation of the peptide. Scale bars, 20X objective: 50 μm; 100X objective: 10 μm.
Figure S9. Delivery of dfTAT into the cytosol and nucleus of live cells was achieved in multiple cell lines. (a) The cell lines Neuro-2a, HDF and MCH58 were incubated with 5 μM dfTAT for 1 h, washed and imaged. The fluorescence signal detected was in the cytosol and nucleus of cells (top panel: 100X objective, bottom panel: 20X objective). After imaging, cells were incubated at 37 °C in a humidified atmosphere containing 5% CO2 for 24 h, washed and imaged (20X objective). Bright field images show that the morphology of cells 24 h after incubation is identical to that of cells imaged immediately after incubation. Cell viability is assessed by exclusion of the cell-impermeable nuclear stain SYTOX Blue at both 1h and 24 h time point. The TMR fluorescence at the 24 h time point is different to that obtained at the 1 h time point presumably because of the intracellular degradation of the TAT peptide and release of the TMR fluorophore. Scale bars, 20X objective: 50 μm; 100X objective: 10 μm. (b) Histogram of flow cytometry data. HeLa cells were incubated with 5 μM dfTAT or no peptide (control) for 1h. Cells were then trypsinized for 5 min, resuspended in a total of 200 μl of nrL-15, and analyzed by flow cytometry (BD Accuri C6 Flow Cytometer). Histograms show that 99.7 % of cells contained red fluorescence.
Figure S10. Delivery of dfTAT into the cytosol and nucleus of primary intestinal porcine epithelial cells (IPEC-1). Cells were incubated with 5 μM dfTAT for 1h, washed and then imaged. Fluorescence (monochrome) images show cytosolic and nuclear distribution of dfTAT in IPEC-1 cells. Scale bars: 10 μm.
Figure S11. fTAT cellular localization after incubation with live cells depends on its concentration in the extracellular media. Inverted monochrome (black=fluorescence signal, white=no signal) fluorescence images of HeLa cells incubated with 10 or 20 μM of fTAT for 1 h. fTAT displays at fluorescence punctate distribution at 10 μM fTAT (left panel) while at 20 μM fTAT shows a significant increase in the population of cells displaying cytosolic and nuclear fluorescence distribution. Scale bars, 50 μm.
Figure S12. Fluorescence emission spectra of dfTAT (5 μM) before and after reduction with the reducing agent TCEP (50 mM). The sample was excited at 556 nm and the emission was recorded between 570-750nm. The emission spectra show that the fluorescence emission of dfTAT increases upon reduction of its disulfide bond. This is indicative of TMR self-quenching in the context of dfTAT.
Figure S13. Structure and characterization of DEAC-K9.(a) Structure and expected mass of DEAC-K9. (b) Characterization of DEAC-K9. HPLC analysis and MALDI-TOF MS spectrum of pure DEAC-K9 (rt = 14.40 min) (expected mass: 1412.97, observed mass: 1415.59)
Figure S14. dfTAT displays a high endosomolytic activity when compared to acfTAT. HeLa cells were incubated with dfTAT (5 μM) for 5 min and acfTAT (50 μM) for 1 h. After 1 h, the cells were washed with PBS/heparin, imaged and lysed. The lysis buffer used in this experiment contains 2 mM DTT. The bulk fluorescence of cell lysates on a 96-well plate was measured using a plate reader. The fluorescence of each sample was normalized to total protein content in the cell lysate, as determined by a Bradford protein assay. Similarly, the fluorescence of solutions of acfTAT at different concentrations (0.1, 0.5, 1, 5 and 10 μM) was measured using a plate reader. A calibration curve of the peptide fluorescence intensity v.s. peptide concentration was established. These data was used to estimate the average concentration of acfTAT and dfTAT inside cells. Data shows higher fluorescence intensity for acfTAT than dfTAT inside cells. These data suggests that dfTAT is a dimer inside endosomes and that this peptide is more endosomolytic than acfTAT (Model 1).
Figure S15. Peptide overall uptake in HeLa cells as a function of the concentration of peptide present in the media. The uptake of the three peptides by HeLa cells was measured as a function of concentration (μM). Cells were incubated with either acfTAT (5-25 μM), fTAT(5-25 μM) or dfTAT (1-10 μM) and the bulk fluorescence of cell lysates on a 96-well plate was measured using a plate reader. The fluorescence of each sample was normalized to total protein content in the cell lysate, as determined by a Bradford protein assay. Data shows a linear increase in the fluorescence uptake of cells incubated with dfTAT. The lysis buffer used in this experiment contains 2 mM DTT. dfTAT is reduced to the monomeric fTAT upon this treatment. Consequently, the normalized fluorescence of dfTAT was divided by two (dfTAT/2) to compare the uptake of dfTAT to that of fTAT (the signal of one molecule of dfTAT gives a signal twice that of a molecule of internalized fTAT in this assay).
Figure S16. SNAP-Surface 488 enters cells via endocytosis. (a) HeLa cells were incubated with 5 μM SNAP-Surface 488 for 1 h, washed and imaged. Inverted monochrome image shows a punctate fluorescence distribution from SNAP-Surface 488 (right panel). (b) HeLa cells were incubated with 5 μM SNAP-Surface 488 and 2.5 μM dfTAT (a concentration in which dfTAT incubation does not result in significant cytosolic release) for 1 h, washed and imaged. Inverted monochrome image shows SNAP-Surface 488 accumulation in endocytic organelles (punctate distribution) (right panel) and colocalization with TMR signal. Bright field images show HeLa cells morphology did not change after uptake of SNAP-Surface 488 and/or dfTAT (right panels). Scale bars, 10 μm.
Figure S17. dfTAT is not toxic to cells under conditions where efficient endosomal escape is achieved. (a) HeLa, MCH58, HDF and Neuro-2a cells were incubated with (1-50 μM) dfTAT for 1 h. Cell viability was assessed by a SYTOX Green exclusion assay 1, 24, and 48 h (for HeLa) after incubation (1,000 cells/experiment, experiments in triplicates, average and standard deviations represented). (b) Histogram of flow cytometry data. HeLa cells were incubated with 5 μM dfTAT or no peptide (control) for 1h, washed and then incubated in SYTOX Green (1 μM) for 15 min. Cells were then trypsinized for 5 min, resuspended in a total of 200 μl of nrL-15, and analyzed by flow cytometry (BD Accuri C6 Flow Cytometer). Histograms show that only 2% and 7.5% of cells are stained with the cell impermeable dye SYTOX Green for untreated and treated cells, respectively. (c) HeLa cells were incubated with 5 μM dfTAT for 1h in the presence of regular-L15, washed and then incubated in SYTOX Green (2 μM) for 15 min. Cells were imaged using fluorescence microscopy to determined the amount of cells stained with SYTOX Green. Bar graph shows that 1 hr and 24 hr after incubation only 3.1 % and 1.4 % of the cell population was stained with the dye, respectively.
Figure S18. The cellular localization of acfTAT and dfTAT is different after incubation with live cells. (a) Fluorescence (monochrome) and bright field images (100X objective) of HeLa cells incubated with 20 μM acfTAT (left panel) and 5 μM dfTAT (right panel). The acfTAT peptide displays a fluorescence punctate distribution while dfTAT exhibits a cytosolic and nuclear fluorescence distribution. Bright field images show no change in HeLa cell morphology upon peptide delivery. Scale bar, 10 μm.
Figure S19. mRNA expression analysis in the presence of staurosporine (a) In order to establish a positive control for the microarray analysis, staurosporin was used to induce apoptosis in HDF cells. Cells were treated with staurosporine (0.1 μM) for 1h and mRNA levels were analyzed as described in Figure 3. The identity of transcripts related to apoptosis that were up-regulated (highlighted in red) and down-regulated (highlighted in green) upon treatment with staurosporin are listed. Notably, a total of 1830 transcripts were found to be up- or down-regulated out of 47321 transcripts detected. (b) Analysis of the microarray intensities of untreated HDF cells vs. those of HDF cells treated with staurosporine (0.1 μM) for 1h. The red lines represent the 2-fold cut-offs. (c) Table listing the identity of transcripts that are up-regulated (highlighted in red) and down-regulated (highlighted in green) in HDF cells incubated with dfTAT (5 μM) and analyzed immediately after incubation (1h), or 1h (1h+1h) and 24 h (1h+24h) after incubation. The 11, 2, and 2 transcripts listed represent the total number of transcripts up or down-regulated in the 1h, 1h+1h, and 1h+24h samples, respectively.
Figure S20. DIGE proteomic analysis of HDF cells treated with dfTAT (5 μM) for 1 h. (a) Representative green and red fluorescence overlay of 2D gel of cells treated with or without dfTAT for 1h and incubated in fresh media for an additional 1h (1+1h samples, treated sample is labeled with Cy3 and untreated with Cy5). Green and red were used as pseudo colors for Cy3 and Cy5 dyes, respectively, and a yellow color is indicative of equal fluorescence intensities. (b) Table summarizing analysis results obtained from the DIGE using the DeCyder v6.5 suite of software tools (GE Healthcare). Data was obtained using a 2 standard deviation model (95% confidence). Each pair (treated vs. untreated) were individually analyzed based on the normalized volume ratio of each individual protein spot from Cy3- or Cy5- labeled sample.
Figure S21. dfTAT mediates delivery of two cargos simultaneously inside live cells. (a) HeLa cells expressing SNAP-H2B were incubated with 5 μM dfTAT, 5 μM SNAP-Surface 488 and 5 μM DEAC-K9. Fluorescence images (RGB and inverted monochrome) show cytosolic and nuclear localization of dfTAT (red fluorescence), DEAC-K9 (blue fluorescence) and SNAP-Surface 488 (green fluorescence). Moreover, the SNAP-Surface signal accumulated in the nucleus as shown in Figure 2c. (b) HeLa cells were incubated with 5 μM dfTAT, 5 μM SNAP-Surface 488 and 5 μM DEAC-K9. Fluorescence and inverted monochrome images show cytosolic and nuclear fluorescence localization of dfTAT (red fluorescence), DEAC-K9 (blue fluorescence) and SNAP- Surface 488 (green fluorescence). Scale bars, 10μm.
Figure S22. Delivery of SNAP-Surface 488 did not occur in the absence of dfTAT during the two-step delivery protocol. HeLa cells were first incubated with 5 μM dfTAT and 5 μM DEAC-K9 for 1 h. Cells were then washed, incubated with 5 μM SNAP-Surface 488 for 1 h and imaged. In one hand, inverted monochrome images show cytosolic and nuclear localization of TMR and DEAC but, in the other hand, SNAP-Surface 488 display a fluorescence punctate distribution. Scale bar, 10μm.
Figure S23. dfTAT mediated delivery of intact EGFP into different cell lines. HeLa (top panel) and NIH 3T3 (bottom panel) cells were incubated with EGFP (10 μM) and dfTAT (5 μM) for 1 h, washed and imaged. Images show a homogenous cytosolic fluorescence distribution of EGFP in HeLa and NIH 3T3 cells. Scale bars, 10 μm.
Figure S24. dfTAT mediated delivery of intact EGFP into HeLa and primary HDF cells. HeLa and primary HDF cells were incubated with EGFP (10 μM) and dfTAT (5 μM) for 1 h, washed and imaged. Images show a homogenous cytosolic fluorescence distribution of EGFP and dfTAT in HeLa and primary HDF cells. Scale bars, 50 μm.
Figure S25. Quantitation of the concentration of EGFP delivered into the cytosol of HDF and Neuro-2a. HDF and Neuro-2a cells were co-incubated with dfTAT (5 μM) and EGFP (10 μM) for 1 h. After 1 h, cells were wash with PBS/heparin and lysed. The cell lysate was treated with nucleases and an aliquot of 27 μL was analyzed by PAGE (top right panel). Similarly, samples of known EGFP concentrations (determined by measuring absorbance at 488 nm and using an extinction coefficient of 55,000 mol-1cm-1) were analyzed by PAGE (top left panel). A fluorescence imager was used to measure the EGFP fluorescence intensity from the cell lysates and EGFP calibration samples. Silver staining was used to detect all proteins in the lysate. A calibration curve of EGFP fluorescence intensity vs. EGFP concentration was established and used to estimate the average concentration of EGFP in the cell lysates. The data obtained was used to calculate the concentration of EGFP per cell. Important numbers: Cell number on well: 79,600 (determined by flow cytometry); Cell volume: 2000 μm3 (bionumbers.hms.harvard.edu.)
Figure S26. The amount of DEAC-K9 delivered into cells can be titrated. HeLa cells were incubated with dfTAT (5 μM) and different concentrations of DEAC-K9 (1, 2.5, 5, 10 and 20 μM) for 1 h. Cells were wash with PBS/heparin, imaged and lysed. The bulk fluorescence of cell lysates containing DEAC-K9 was measured using a fluorometer. Similarly, the fluorescence of solutions of DEAC-K9 at different concentrations (0.01. 0.1, 1, 10 and 100 μM) was measured using a fluorometer. A calibration curve of DEAC-K9 intensity vs. DEAC-K9 concentration was established. These data was used to estimate the average concentration of DEAC-K9 inside cells. Data shows a linear increase in the amount of DEAC-K9 delivered inside cells (top right panel). Consistent with these data, fluorescence images that show an increase in the fluorescence signal in the cytosol cells with increasing concentrations o DEAC-K9 incubated in the media (top left panel, and Figure 5).
Figure S27. dfTAT and EGFP do not interact when co-incubated. (a) Fluorescence emission spectrum of EGFP (1 μM) (donor FRET pair) (EGFP, Ex/Em 488/508 nm) excited at 488 nm. The spectrum show an intense emission peak at around 510 nm and a small shoulder peak around 548 nm (b) Fluorescence emission spectrum of a solution of EGFP (1 μM) and dfTAT (5 μM) (acceptor FRET pair) (TMR, Ex/Em 556/580 nm) excited at 488 nm. The spectrum shows an intense emission peak at around 510 nm and a small shoulder peak around 548 nm. The contribution of TMR to the EGFP fluorescence spectrum (crossover fluorescence) was determined by measuring the fluorescence emission of a solution of dfTAT (5 μM) excited at 488 nm (not shown). The spectrum of the solution with EGFP and dfTAT is almost identical to the spectrum of EGFP alone (TMR fluorescence crossover signal was subtracted). (c) Fluorescence emission spectrum of ligated EGFP-CK(TMR). Using expressed protein ligation, EGFP was chemically ligated to CK(TMR) as described to produce EGFP-CK(TMR)7. EGFP-CK(TMR) was used a positive control for the FRET signal. Upon excitation at 488 nm, a dramatic increase in fluorescence between 560-630nm is observed (fluorescence max approximately 580 nm), indicative of a FRET signal due the close proximity between fluorophores. This increase in fluorescence intensity was not observed in the spectrum in part b) (indicative of no interactions between EGFP and dfTAT). Emission of all samples was scanned from 500 to 650 nm.
Figure S28. dfTAT does not interact with EGFP. (a) Native gel electrophoresis was used to determine binding interaction between dfTAT and EGFP. Samples were prepared by incubating dfTAT (5 μM) with either EGFP (10 μM) or BSA (10 μM, protein with a pI = 4.7, used as a positive control) in nrL-15 for 30 min at 37 °C (pH 7.0, representing the pH of the extracellular milieu of the cell and pH 5.0 representing the lower pH that exists along the endocytic pathway). dfTAT alone, EGFP alone and BSA alone at the same concentration and pH were loaded on the same gel as controls. Fluorescence Images of the gel were acquire using a Typhoon scanner. Green fluorescent bands correspond to EGFP and red fluorescence band correspond to dfTAT fluorescence. Red fluorescent bands corresponding to both dfTAT and BSA indicate binding between peptide and protein. In contrast, dfTAT fluorescence is not detected in bands corresponding to EGFP, indicating absence of binding. An image of the commassie stained native gel is also shown (top left corner). (b) Coomassie staining, red fluorescence, and green fluorescence images of samples of dfTAT and EGFP at varying concentration and analyzed by native gel electrophoresis. Similar results were obtained with dmEGFP (EGFP not containing cysteine residues, data not shown).
Figure S29. Effect of BSA, heparin and FBS on dfTAT cell penetration (a) Co-incubation of dfTAT with BSA results in a decrease in the percentage of cells displaying cytosolic release of dfTAT. HeLa cells were co-incubated with 5 μM dfTAT and 10 μM BSA for 1h. Cells show a punctate distribution of the peptide (monochrome 100X image) indicative of peptide being trapped in endocytic vesicles. In comparison, HeLa cells incubated with dfTAT (5 μM) alone show a homogenous cytosolic and nuclear distribution of peptide in a majority of cells. (b) Effect of FBS and heparin on dfTAT mediated cellular. HeLa cells were incubated with 5 μM dfTAT and heparin (1-100 μg/mL) or FBS (0.1-10%) for 1 h. Cells were washed and imaged. The % cells with cytosolic and nuclear distribution was calculated as described in Figure 1(b). Scale bars: 10 μm.
Figure S30. The FITC-anti-ATP5a antibody co-localizes with a fluorescently labeled mitochondrial protein expressed in live cells after dfTAT-mediated delivery. (a) Cells expressing TagCFP-mito (left) were imaged using the FITC and CFP filters. Tubular mitochondria were clearly observed only in the CFP channel. In a separate experiment, dfTAT (5 μM) and FITC-anti-ATP5A (20 μg/mL) were incubated for 1 h with cells expressing TagCFP-mito. The inverted monochrome images show co-localization of FITC-anti-ATP5A (FITC channel) and TagCFP-mito (CFP channel). Scale bars, 2 μm. (b) To confirm that the mitochondrial staining is specific to FITC-anti-ATP5A, an antibody without an intracellular epitope, FITC-anti-IgG, was delivered with dfTAT. FITC-anti-IgG (20 μg/mL) and dfTAT (5 μM) were incubated with cells for 1 h. Inverted monochrome images show a homogenous cytosolic fluorescence distribution (top). In contrast, cells that were incubated with FITC-anti-ATP5A show fluorescence in tubular structures (bottom). Scale bars, zoom-in image: 2 μm, 100X objective: 10 μm.