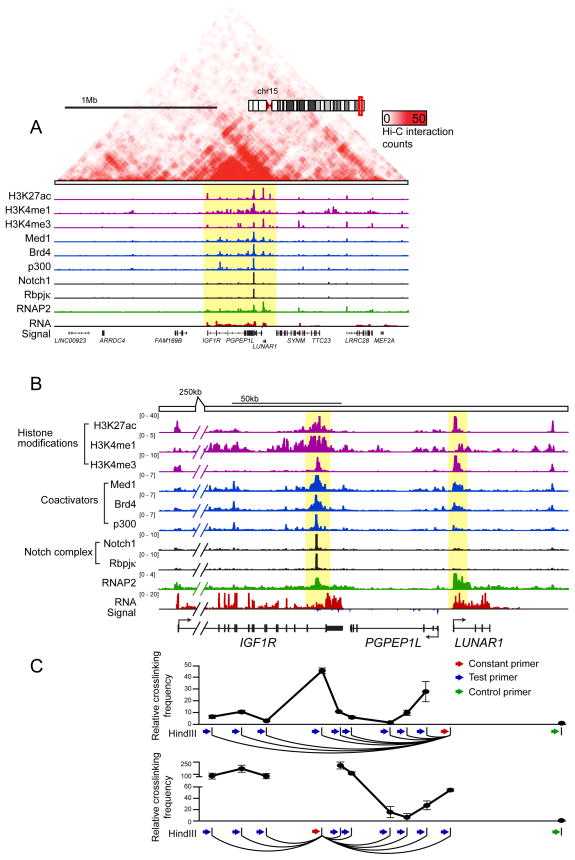
Figure 4. LUNAR1 is physically associated with a nearby Notch-occupied enhancer.
(A) Gene track of a 2Mb region surrounding the LUNAR1 locus including Hi-C interaction density heat map (red upper panel), ChIP-Seq tracks for H3K27ac, H3K4me1, H3K4me3, MED1, BRD4, P300, NOTCH1, RBPJκ, RNAP2 and RNA-Seq track. (B) Gene track view of an approximately 150kb region which contains LUNAR1 (highlighted yellow, right and a Notch-occupied enhancer in the last intron of IGF1R (highlighted yellow, left). (C) Relative cross-linking frequency as measured by 3C-qPCR using a constant primer in a HindIII fragment at the LUNAR1 TSS (top) or at the Notch-occupied enhancer (bottom). Crosslinking frequency is relative to a negative region (green). Error bars indicate the +/− SEM of three experiments.

