

Abstract
The hydrolysis and condensation of octadecyltrimethoxysilane (OTMS) at the air/water interface were monitored through molecular area changes at a constant surface pressure of 10 mN/m. The onset of condensation was delayed through the addition of methyl stearate (SME) acting as an inert filler molecule. In the absence of SME, complete gelation of OTMS required 30 h, during which time OTMS condensation occurred concomitantly with hydrolysis. In the presence of SME, the OTMS monolayer gelation rate increased in proportion to the amount of SME present. A 1:6 OTMS:SME molar ratio resulted in monolayer gelation within 30 min, suggesting completion of monomer hydrolysis prior to condensation. These findings indicate that lability of OTMS to hydrolysis at the air/water interface is governed by steric and conformational constraints at the silicon atom site, with monomeric OTMS being much more reactive than oligomeric OTMS. Fluorescence microscope images demonstrated that the OTMS condensed domain size also decreased with increasing SME concentrations, further implicating SME’s role as an inert filler.
1. Introduction
Hydrolysis and condensation of chloro- and organo-silanes at the air/water interface have been the subjects of several recent studies.1–12 The silane most commonly employed in these studies, octadecyltrimethoxysilane, OTMS (CH3–(CH2)17–Si–(OCH3)3), undergoes a 2-D sol–gel process which is strongly dependent on subphase pH,2–4 as well as monolayer surface pressure and incubation time (including monolayer spreading and solvent evaporation times).5 The interfacial reactivity of the OTMS sol–gel process have been monitored either as molecular area (A) or surface pressure (π) changes over time. The resultant OTMS isobars and iso-area curves display features which have been attributed to the formation of protonated reaction intermediates (A or π increases)5 followed by hydrolysis and condensation of these intermediates (A or π decreases).4–7 These reactions are given below:
| (1) |
| (2) |
| (3) |
| (4) |
where R stands for the methoxy group, –OCH3, and R for the octadecyl chain, –(CH2)17–CH3. Reaction 1 depicts the protonation of an OTMS methoxy group which precedes hydrolysis on acidic subphases.13,14 Reaction 2 is the hydrolysis of the protonated intermediate, and reactions 3 and 4 are the alcohol-and water-producing condensation reactions, respectively. According to our previous findings,5 the increase in molecular area or surface pressure accompanying reaction 1 is a result of electrostatic repulsion or packing restrictions among the charged intermediates. The subsequent decrease in molecular area or surface pressure results from substitution of bulky methoxy groups for hydroxy groups during hydrolysis and alcohol-producing condensation.6
Numerous OTMS hydrolysis and condensation paths exist as depicted schematically in Figure 1. In this diagram an OTMS molecule is represented as (x,y,z) where x is the number of –OR substitutions, y the number of –OH substitutions, and z the number of –O–Si substitutions on the silicon atom.15 As has been previously recognized, confining the sol–gel process to the air/water interface improves the probability of condensation-producing collisions between silane monomers, and condensation is expected to occur immediately following hydrolysis.4,6 Thus, an alternating horizontal–vertical path [i.e., (3,0,0) to (2,1,0) to (2,0,1)…] is predicted for OTMS monolayers. If the surface density of OTMS is decreased, and thus the probability of OTMS–OTMS collisions is decreased, a horizontal (3,0,0) to (0,3,0) path may be expected, producing a large concentration of tri-hydrolyzed OTMS monomers which then follow a condensation path from (0,3,0) to (0,0,3).
Figure 1.

A schematic depiction of the possible hydrolysis and condensation paths between monomeric tri-methoxy species (3,0,0) and tetrameric tri-condensed species (0,0,3). See text for explanation of the numbering scheme.
Admittedly, this reaction scheme is an oversimplification of the interfacial sol–gel process for which the protonation reactions and the multiple equilibria among monomeric, oligomeric, branched, and cyclic species are not accounted. Additionally, the reaction rate and sol–gel path are influenced by the development of the electric double-layer and decreasing interfacial pH accompanying the sol–gel process. Freshly prepared OTMS monolayers display large positive surface potentials which steadily decrease with time.12 This decreasing interfacial pH accompanying hydrolysis and condensation accelerates hydrolysis of remaining methoxy groups, assuming steric and conformational factors do not hinder accessibility of the silicon site to nucleophilic attack. As will be shown here, one means of reducing steric hindrance at the silicon atom site is to delay the condensation reactions, thereby allowing hydrolysis to first reach completion.
The objective of the present study was to induce OTMS to follow a (3,0,0) to (0,3,0) to (0,0,3) sol–gel path through the addition of an inert filler molecule, methyl stearate (CH3–(CH2)16–COOCH3, SME). The motivation for this work was 2-fold. First, the sol–gel process thus far reported for silanes at the air/water interface had been a convolution of hydrolysis and condensation.4–7 Through addition of SME as a film diluent, OTMS hydrolysis and condensation may be distinguished. Second, the gelation of OTMS in the presence of SME was investigated as a means of producing defects, or domains, of controlled size in an otherwise uniform 2-D polysiloxane film. Potential applications for silane monolayers possessing pores or domains of controlled size include catalysis, separation, and sensing devices.
2. Experimental Section
Materials
Octadecyltrimethoxysilane (>97% purity, United Chemical Technologies) and methyl stearate (99.5% purity, GC standard, Fluka) were each diluted to 1 mg/mL in chloroform (EM Science, spec grade) and stored at −20 °C. OTMS:SME mixtures were prepared just prior to experiments. Double distilled water (pH 5.6, surface tension, γ20 °C = 72.8 mN/m, conductivity, ω = 18 MΩ cm) was used as the subphase. Some OTMS monolayers were doped with 1–2% of either rhodamine glycerophosphoethanolamine (N-Rh–PE) or nitrobenzoxadiazole glycerophosphoethanolamine (NBD-PE) (Molecular Probes) to visualize monolayer morphology at the air/water interface. However, as will be shown here, these dyes can have a dramatic influence on the sol–gel rate. Thus, an alternative technique was employed in which films were horizontally transferred and stained with 0.003 mg/mL solutions (H2O, pH 5.6) of horse spleen ferritin (Sigma) labeled with tetramethylrhodamine isothiocyanate (TRITC, Molecular Probes) for fluorescence microscopy analysis. Contrast thus provided was based on monolayer packing density and charge character effects on ferritin adsorption. At pH 5.6 rhodamine-labeled ferritin (Rh–Fer) preferentially adsorbed to the less densely packed phases in the monolayers and/or the regions of neutral or positive charge (ferritin isoelectric point is at pHiep 4.5). Dipalmitoyl-phosphatidylcholine (DPPC, Avanti Polar Lipids) monolayers were used as controls to study the effects of rapid compression into the LE–LC coexistence region on monolayer relaxation at constant surface pressure. Hydrophobic glass coverslips (VWR) were used as substrates for monolayer transfer. Coverslips were made hydrophobic using OTS silanization protocols.16
Langmuir Trough
Monolayers were prepared on a KSV 5000 “tandem” trough (KSV Instruments) housed in a dust-free cabinet placed on an anti vibration table (TMC). The trough and barriers were thoroughly cleaned with absolute ethanol and rinsed for 10 min with deionized water, followed by double distilled water. The surface pressure was measured using a platinum Wilhelmy plate attached to a surface balance (resolution ~ 4 μN/m) (KSV). The Wilhelmy plate was rinsed with ethanol and passed through the flame of an alcohol lamp, then rinsed with double distilled water. The subphase was maintained at 20 °C using a circulating water bath, and the pH was monitored using a pH electrode (Radiometer). A second surface balance was placed in the other trough (troughs connected through the subphase) to correct for subphase evaporation during extended experiments. Prior to monolayer spreading, the interface was aspirated clean until the surface pressure changed by less than 0.1 mN/m upon reduction of the interfacial area from 850 to 50 cm2.
Monolayer Spreading
OTMS and OTMS:SME solutions were rapidly spread (70 μL in 1 min over 850 cm2) on the subphase, then immediately compressed to 10 mN/m surface pressure which corresponds to the OTMS LE-LC coexistence region. Rapid compression rates (25 Å2/molec min) were used such that the reactions could be monitored quickly after spreading. At this compression rate, it was possible to begin monitoring the reactions within 2.5 min after spreading the first drop of solution at the interface (1 min for spreading 70 μL and 1.5 min to reach the feedback pressure). In practice, the spreading time was allowed to vary between 1 and 2 min to allow the surface pressure to “relax” to zero between successive drops of spreading solution. This precaution was taken to avoid introducing spreading solution into the subphase.
A(t) Isobars
Monolayers were compressed to the desired feedback surface pressure and changes in barrier position and velocity with time were recorded. Data are presented as average (OTMS + SME) molecular area, A, vs time, t.
π-A Isotherms
Solutions were rapidly spread (70 μL in 1 min over 850 cm2) on the subphase, then immediately compressed at 25 Å2/molec min.
Monolayer Transfer
Transferred monolayers with polar headgroups facing the ambient were obtained using the horizontal transfer method in which a hydrophobic coverslip oriented parallel to the plane of the interface was pushed into the subphase. To avoid disrupting the monolayer orientation, transferred films were maintained hydrated in a fluid-cell during scanning force microscopy (SFM) and fluorescence microscopy analysis.
Transferred Film Surface Analysis
Fluorescence microscope images were obtained using an inverted microscope (Diaphot 200, Nikon) equipped with a 100× (NA 1.25 oil-immersion) objective (Leitz). Images were recorded using the MicroView imaging system (Princeton Instruments). SFM images were acquired in the topography and lateral force imaging modes with a Topometrix Explorer 2000 SFM and a 200 μm long rectangular cantilever (Pointprobes, Nanosensors Inc.) with a nominal stiffness of 2.2 N/m and a probe radius of curvature of 10–20 nm.
3. Results
The surface pressure vs molecular area (π–A) isotherms for pure and mixed monolayers of OTMS and SME on H2O, pH 5.6 subphases are presented in Figure 2. The pure SME monolayer undergoes a sharp increase in surface pressure at a molecular area of 20 Å2/molec, corresponding to a close-packed arrangement of alkyl-tails. The pure OTMS monolayer displays two phase transitions, near 10 and 20 mN/m. The former corresponds to a first-order phase transition that arises as the weakly polar OTMS headgroups are forced to interface with the aqueous subphase at higher packing densities.2 The second transition is attributed to a partial monolayer collapse in which the amphiphiles assume a staggered conformation.12 Due to the reactive nature of OTMS, the π–A isotherms are highly dependent on incubation times and compression rates.5 This reactivity is evident in the A(t) isobars shown in Figures 3 and 4.
Figure 2.

π–A isotherms for pure and mixed OTMS and SME monolayers. The OTMS:SME molar ratios (7:3 and 1:6) are indicated next to the isotherms.
Figure 3.

A(t) isobars (π = 10 mN/m) for pure OTMS and OTMS: SME mixtures (98:2, 7:3, 1:6 molar ratios indicated next to isobars). Arrows on the pure OTMS and 1:6 OTMS:SME isobars indicate points where the monolayers were transferred for fluorescence staining and imaging, shown in Figures 5 and 8.
Figure 4.

A(t) isobars (π = 10 mN/m) for the 7:3 and 1:6 OTMS: SME monolayers and a 98:2 OTMS:N-Rh–PE monolayer. The arrows on the 7:3 isobar indicate points where the monolayers were transferred for fluorescence staining and imaging, shown in Figure 7.
Figure 3 shows the influence of SME on the OTMS A(t) isobars (π = 10 mN/m). Three different ratios of OTMS:SME, 98:2, 7:3, 1:6, are presented as well as a pure OTMS monolayer. The 7:3 and 1:6 OTMS:SME A(t) isobars are also shown in Figure 4, along with the A(t) isobar for an OTMS:N-Rh–PE, 98:2 isobar. Arrows along the isobars in Figures 3 and 4 indicate positions where monolayers were transferred for fluorescence analysis. Completion of the sol–gel process is indicated by the final plateau regions of constant molecular area. Note that as the SME concentration increases, the time required to reach this plateau dramatically decreases.
Figure 5 shows fluorescence micrographs of pure OTMS monolayers transferred after 1 min, 3 h, and 30 h at π = 10 mN/m as indicated in Figure 3. The dark features correspond to the more densely packed liquid condensed (LC) domains (note that in this sense, condensed refers to the physical packing of OTMS) while the bright regions correspond to the liquid expanded (LE) phase. The domains in Figure 5C are chemically condensed as verified by fracture lines in some domains as well as monolayer viscous behavior during aspiration from the air/water interface. The bright inter-domain regions in Figure 5C are believed to be composed of less densely packed but chemically condensed OTMS and/or isolated, condensed OTMS islands. This hypothesis is based on SFM images, shown in Figure 6, which demonstrate less than 0.2 nm topography difference (Figure 6A) between the domains and inter-domain regions, yet a large contrast in lateral friction (Figure 6B). Higher resolution scans (Figure 6C) of the inter-domain regions reveal numerous 50–75 nm diameter islands and cyclic structures (arrows and inset image) in the lateral force images. Such small features were indiscernible in the corresponding topography image (not shown). The presence of a partially polymerized OTMS phase separating condensed islands has also been reported in an in-situ fluorescence microscopy investigation.6
Figure 5.

Fluorescence images of pure OTMS monolayers transferred after 1 min, 3 h, and 30 h as indicated in the isobar in Figure 3. See text for a description of the physical and condensed phases present.
Figure 6.

SFM images under solution of a pure OTMS monolayer transferred after 30 h at 10 mN/m. The topography image (A) provides little contrast (<0.2 nm) between domains and inter-domain regions. The gray scale is 3 nm from black to white. The lateral force image (B) clearly resolves the domains. A higher resolution lateral force image (C) reveals numerous 50–75 nm diameter features (arrows and inset) in the inter-domain regions of B. The inset image is 300 nm by 300 nm.
Figure 7 shows fluorescence micrographs of OTMS:SME 7:3 monolayers transferred after 8, 20, 40, and 60 min as indicated in Figure 4. The dark regions in Figure 7A,B correspond to OTMS physically condensed LC domains. In Figure 7C,D the LC domains are also undergoing chemical condensation, as indicated by the fracture lines in Figure 7D where chemical condensation is complete. Figure 8 shows fluorescence micrographs of OTMS:SME 1:6 monolayers transferred after 1 h and 18 h. Since these monolayers were transferred after completion of the sol–gel process, indicated by the plateau in the isobar at 21 Å2/molec, the dark regions are assigned solely to OTMS chemically condensed domains. The bright regions in Figures 7 and 8 may correspond to OTMS LE phases, less densely packed chemically condensed OTMS, and SME phases.
Figure 7.
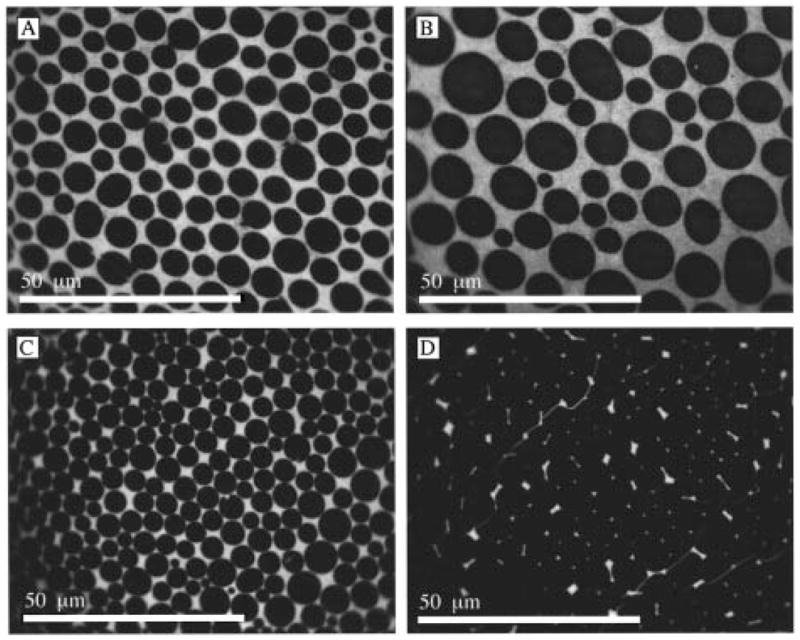
Fluorescence images of 7:3 OTMS:SME monolayers transferred after 8, 20, 40, and 60 min as indicated in Figure 4. Fracture lines in the monolayer (D) indicate condensation is complete.
Figure 8.

Fluorescence images of 1:6 OTMS:SME monolayers transferred after 1 h and 18 h as indicated in Figure 3. A large fracture line or grain boundary divides the image in A. In B the aggregation of chemically condensed domains is apparent.
4. Discussion
An accelerated hydrolysis and condensation for OTMS monolayers containing SME are apparent in both the A(t) isobars and the fluorescence images presented. Both the molecular area increase features and the time required to reach a limiting molecular area decreased in proportion to the concentration of SME. A dramatic influence of SME on condensed domain morphology, size, and monodispersity was observed as well.
In the absence of SME, condensed domains often exhibited 6-fold symmetry (star and hexagonal) as shown in Figure 5C. Such domains were never observed in the monolayers containing SME. The exclusively round domain morphology in Figures 7 and 8 suggests SME increased the line tension in these monolayers, possibly by acting as a molecular lubricant. This effect may also account for the domain monodispersity (see Figure 7C) in the presence of SME. The dramatic decrease in domain size for the 1:6 OTMS:SME monolayer (Figure 8) is expected as the primary component, SME, exists as a single phase at 10 mN/m.
The molecular area increase feature in the A(t) isobars, attributed to protonation of OTMS prior to hydrolysis/condensation, is not apparent for the 1:6 OTMS:SME molar ratio (Figures 3 and 4). This finding is expected since OTMS is diluted in a matrix of SME; moreover, protonated OTMS species are less likely to encounter (repulse) one another. However, as the OTMS:SME ratio is increased to 7:3, a molecular area increase reappears in the isobar, suggesting that a 7:3 OTMS:SME ratio only partially screens electrostatic repulsion among OTMS intermediates. For the 98:2 OTMS:SME ratio, electrostatic repulsion is prevalent and two molecular area increases are observed, possibly corresponding to a stepwise protonation of methoxy groups on OTMS as previously reported.5 Nonetheless, even 2% SME is sufficient to accelerate the reaction rate 2-fold (reaction complete in 15 h) as compared to the pure OTMS monolayer in Figure 3 which does not reach a limiting molecular area until 30 h.
The accelerated sol–gel reaction in the presence of SME is attributed to the formation of multiply hydrolyzed monomers, (0,2,0) and (0,3,0), prior to the onset of condensation. We hypothesize that these species undergo a rapid gelation which leads to the numerous small condensed domains observed in Figure 8A,B. In contrast, pure OTMS monolayers rapidly form dimeric, and possibly small linear, branched and/or cyclic, condensed species prior to completion of hydrolysis. Once condensation has begun, the remaining methoxy groups are less labile to hydrolysis due to steric and/or inductance effects associated with the silicon atom site now involved in a siloxane (Si–O–Si) bond(s). A similar observation has been made in bulk sol–gel kinetics in which the hydrolysis and condensation of partially condensed species are slower than the condensation of monomeric species.17 At the air/water interface, steric influence on the hydrolysis and condensation processes may be even more pronounced given the spatially restrictive nature of the interface.
Hydrolysis is believed to occur by a bimolecular nucleophilic substitution (SN2) mechanism in which the attacking group must approach the silicon atom from the opposite side of the leaving group.13,14,18 Since the leaving group is a protonated methoxy moiety, it is expected that this group will interface with the aqueous subphase to satisfy its highly polar nature and ion solvation requirements. This orientation restricts accessibility of the silicon site to SN2 attack by water, especially at high surface pressures and/or in the presence of condensation. In contrast, for monomeric OTMS at low interfacial packing densities, the silicon site is more open to SN2 attack by water and other freely diffusing OTMS monomers. This observation is supported by a previous study demonstrating that OTMS is relatively unreactive above a critical surface pressure.5
Whether SME primarily exerts its influence on the OTMS sol–gel process during spreading and compression, or once the feedback surface pressure of 10 mN/m has been reached is uncertain. Given the possibility that SME is not ideally miscible in OTMS as surface pressure is increased, influence of SME may occur primarily at lower surface pressures. As surface pressure is raised, SME may form a distinct phase and be less effective at preventing OTMS–OTMS collisions. An alternative is that SME is miscible in OTMS at 10 mN/m; however, as chemical condensation occurs, SME is forced into a separate phase. Factors influencing the distribution and size scale of domains in gelled OTMS:SME monolayers are the topic of future work.
If SME exerts its influence while the OTMS monolayer is at zero surface pressure, then the 1:6 OTMS:SME isobars in Figures 3 and 4 represent the condensation reaction of tri-hydrolyzed monomer (0,3,0). The slight decrease in molecular area may then be attributed to water-producing condensation reactions. However, since it has been shown using space-filling models that the molecular area of a (0,3,0) is similar to the (0,0,3) species,6 the slight decrease in molecular area observed for the 1:6 OTMS:SME monolayer may simply arise from the monolayer physical restructuring with time. Indeed, it is noted that the condensed domains in Figure 8A have self-associated with additional time at the air/water interface to form the larger aggregates of Figure 8B. The nature of the 3-D appearance noted in Figure 8B is uncertain. It may simply be an image artifact, or it may be real, possibly arising from a post-transfer film restructuring and/or Rh–Fer aggregation.
The catalytic influence of dopant levels of charged surfactants on the OTMS sol–gel behavior is observed in the OTMS:N-Rh–PE isobar in Figure 4. The mechanisms by which SME and N-Rh–PE enhance OTMS reactivity are distinct as the N-Rh–PE contains a sulfonic acid group that may rapidly protonate and hydrolyze OTMS molecules. In contrast, SME is a neutral fatty ester believed to act as an inert filler molecule. In addition to N-Rh–PE, dopant levels of NBD-PE also accelerated the OTMS sol–gel reaction (isobar not shown). In this case, the NBD moiety has no acidic groups and the accelerated reaction must be attributed to the charges on phosphoethanolamine to which NBD is attached. It was also noted that the shelf life of OTMS solutions doped with these dyes was diminished relative to pure OTMS, suggesting bulk hydrolysis and condensation occurred.1
The effect of the rapid spreading and compression on isobar shape was tested using a nonreactive surfactant, DPPC, as a control. Pure DPPC monolayers did not undergo any area changes after rapid spreading and compression to a feed-back surface pressure of 5 mN/m, which corresponds to the LE–LC transition region for DPPC. Thus, the OTMS molecular area increase(s) are unlikely the result of any off-equilibrium,19 physical restructuring between the LE and LC phases. The increase in LC domain size in Figures 5B and 7B correlates to the observed molecular area increases in the isobars of Figures 3 and 4. Image analysis demonstrated that the LC:LE ratio increases during these molecular area increases. This result is counterintuitive since a decrease in molecular area is expected as the LC:LE ratio increases. It is likely that the actual LC:LE ratio is constant and that only the packing density in the LC phase is decreasing, due to electrostatic repulsion among charged OTMS intermediates, leading to the net molecular area increase.
5. Conclusions
The interfacial sol–gel reaction of the trifunctional silane octadecyltrimethoxysilane (OTMS) was investigated in the presence of an inert filler molecule, methyl stearate (SME). Evidence that SME acts to delay chemical condensation by impeding OTMS–OTMS collisions is provided in both the isobars and fluorescence images of the OTMS:SME monolayers. Rapid OTMS gelation in the presence of SME was attributed to a sol–gel path which favored completion of hydrolysis prior to condensation. Accelerated sol–gel reactions in the presence of dopant levels of charged surfactant dyes were also observed; however, in contrast to SME, these surfactants likely affected the sol–gel reaction through their charged groups. The decreased OTMS reactivity found in the absence of SME or charged dyes indicate that at the air/water interface the accessibility of the silicon atom site to hydrolysis is the rate-determining step in the initial formation of siloxane bonds.
Acknowledgments
The authors thank D. W. Grainger for helpful suggestions related to the L-B technique. This work was supported in part by the University of Utah Research Foundation grant and by the NIH grant HL 44538.
References and Notes
- 1.Kumar V, Krishnan S, Steiner C, Maldarelli C, Couzis A. J Phys Chem B. 1998;102:3152. [Google Scholar]
- 2.Vidon S, Leblanc RM. J Phys Chem B. 1998;102:1279. [Google Scholar]
- 3.Brousseau JL, Vidon S, Leblanc RM. J Chem Phys. 1998;108:7391. [Google Scholar]
- 4.Lindén M, Slotte JP, Rosenholm JB. Langmuir. 1996;12:4449. [Google Scholar]
- 5.Britt DW, Hlady V. Langmuir. 1999;15:1770. doi: 10.1021/la9808566. [DOI] [PMC free article] [PubMed] [Google Scholar]
- 6.Fontaine P, Rondelez F. Kinetics of polymerisation in Langmuir monolayers of n-alkytrimethoxysilane. In: Daillant J, editor. Short and Long Chains at Interfaces. 1995. pp. 207–212. Editions Frontieres: Gif-sur-Yvette Cedex. [Google Scholar]
- 7.Sjöblom J, Stakkestad G, Ebeltoft H, Friberg SE, Claesson P. Langmuir. 1995;11:2652. [Google Scholar]
- 8.Kojio K, Ge S, Takahara A, Kajiyama T. Langmuir. 1998;14:971. [Google Scholar]
- 9.Fang J, Knobler CM. Langmuir. 1996;12:1368. [Google Scholar]
- 10.Barton SW, Goudot A, Rondelez F. Langmuir. 1991;7:1029. [Google Scholar]
- 11.Ariga K, Okahata Y. J Am Chem Soc. 1989;111:5618. [Google Scholar]
- 12.Taylor DM, Gupta SK, Dynarowicz P. Thin Solid Films. 1996:284–285. 80. [Google Scholar]
- 13.Osterholtz FD, Pohl ER. J Adhesion Sci Technol. 1992;6:127. [Google Scholar]
- 14.Sanchez J, McCormick A. J Phys Chem. 1992;96:8973. [Google Scholar]
- 15.Arkles B, Steinmetz JR, Zazyczny J, Mehta P. Factors contributing to the stability of alkoxysilanes in aqueous solution. In: Anderson R, Larson GL, Smith C, editors. Silicon Compounds: Register and Review. Hüls America Inc; Piscataway, NJ: 1991. p. 301. [Google Scholar]
- 16.Britt DW, Hlady V. J Colloid Interface Sci. 1996;178:775. doi: 10.1006/jcis.1996.0177. [DOI] [PMC free article] [PubMed] [Google Scholar]
- 17.Assink A, Kay BD. J Non-Cryst Solids. 1988;107:35. [Google Scholar]
- 18.Alam TM, Assink RA, Loy DA. Chem Mater. 1996;8:2366. [Google Scholar]
- 19.Möhwald H, Dietrich A, Böhm C, Brezesinski G, Thoma M. Mol Membr Biol. 1995;12:29. doi: 10.3109/09687689509038492. [DOI] [PubMed] [Google Scholar]