Abstract
A flat silica surface modified with 3-mercaptopropyltriethoxy silane (MTS) was patterned using UV irradiation and a custom-designed mask. The irradiated surface was characterized by X-ray photoelectron spectroscopy (XPS), scanning force microscopy (SFM) and water contact angle measurements. The XPS S2p spectra indicated that the UV treatment resulted in the oxidation of MTS sulfur. The optimal UV irradiation dose for patterning, estimated from the XPS S2p binding energy shifts and water contact angles of irradiated surfaces, was 4.8 J cm−2 at 270 nm. The surface patterns were visualized by total internal reflection fluorescence microscopy, while exposing the pattern to a solution of acridine orange, by water vapor condensation, and by SFM lateral force imaging in dilute electrolyte solution. The adhesion SFM measurements revealed the adhesion force only on the areas which were not UV-irradiated. The adsorption of fluorescein-labeled fibrinogen (FITC-Fgn) from dilute buffer solution also produced visual information on the pattern. The kinetics of FITC-Fgn adsorption onto the oxidized and unoxidized MTS-silica surfaces from dilute protein solution proceeded with identical initial adsorption rates. The steady-state FITC-Fgn adsorption was twice as large on the unoxidized MTS-silica than on the oxidized MTS-silica surface.
Keywords: Fibrinogen adsorption, 3-Mercaptopropyltriethoxy silane, Modified silica, Scanning force microscopy, Total internal reflection fluorescence microscopy
1. Introduction
Modern surface engineering aims to control spatial variation in surface chemistry. So-called “gradient surfaces” are one example of such control: the surface concentration of one type of chemical group gradually increases along one of the surface dimensions [1]. Various types of gradient surfaces have been utilized as convenient experimental tools for studying the effects of surface ligand density on protein adsorption [2–4] and cell attachment [5]. Many gradient surfaces are prepared on flat silica or oxidized silicon surfaces using a simple two-phase surface modification reaction [6]. The length of the gradient region depends on the diffusivity of the two phases and the reactivity of the silane reagent. Control of the gradient length is achieved by selecting the concentration of the silane reagent and the duration of the surface modification reaction [1]. However, the microscopic distribution of the surface groups in the gradient region is usually not known, causing some uncertainty in the interpretation of interracial events occurring in this region.
A second example of surface engineering, recently explored by a number of different research groups, comprises different ways of preparing the so-called “patterned surfaces”. Strategies for the creation of spatial chemical patterns on surfaces include:
photochemical modification of uniform, thin organic films [7–9];
spatially-controlled radio frequency glow discharge treatment of polymer surfaces [10,11];
spatially-controlled delivery of a surface-modifying compound by simple stamping [14] or ink-jet printing procedures [15], followed by an optional second step in which the remaining unmodified surface areas are “back-filled” with a second surface-modifying compound [16].
With the advent of microlithography techniques the size of surface patterns can be made quite small, typically down to the micron range. Patterns in the nanometer range were prepared by transferring biological protein assemblies onto suitable substrates [17]. The development of nanometer size patterns has also been demonstrated by using scanning probe microscopy [18].
Patterned surfaces were used as multi-channel biosensors [19–21] and, because micron-size patterns match the size of animal cells, also as tools for studying the effects of surface chemistry on cell adhesion and subsequent cell morphogenesis [10,22,23]. The motivation for the study reported here was similar: a patterned modified silica surface was prepared by UV irradiation as a means of spatially controlling the surface density of fibrinogen, a protein implicated in platelet activation and adhesion. This report describes the patterning and characterization of 3-mercaptopropyltriethoxy silane silica (MTS-silica) surfaces, and fibrinogen adsorption kinetics onto the two MTS-silica surface regions. The interaction of platelets and cells with protein-coated patterned MTS-silica surfaces will be reported in future (V. Hlady et al., in preparation).
2. Materials and methods
2.1. Surface modification
Fused silica microscope slides (ESCO Products Inc.) were cut to 25 mm × 11 mm for total internal reflection fluorescence (TIRF) experiments and to 10 mm × 10 mm for X-ray photoelectron spectroscopy (XPS) and contact angle measurements. These silica plates were etched in chromosulfuric acid at 70°C for 2 h, rinsed with deionized distilled water for 5 min, and dried in a desiccator for 3 h. After such treatment the plates were completely wettable by water. Scanning force microscopy (SFM) topography imaging of 1 gm 2 surface areas of the plates showed a root-mean-square (rms) surface roughness of 4 nm. The surface modification of the plates was initiated by immersing the clean plates in a 2% (v/v) solution of 3-mercaptopropyltriethoxy silane (97% pure, Hüls America) in trichloroethylene (TCE; AP Grade, EM Science). The silanization reaction occurred for 12 h at room temperature in the dark. The MTS-modified plates (MTS-silica) were sequentially rinsed under low-light conditions with TCE, acetone and ethanol, and finally dried with filtered nitrogen. In order to avoid spontaneous oxidation of surface -SH groups, the MTS-modified plates were stored at −20°C in a sealed glass jar filled with nitrogen and wrapped with aluminum foil.
The lateral force SFM imaging was performed on a MTS-modified, oxidized silicon wafer rather than on the fused silica plates. The {110}-plane cut silicon wafers (HEDCO Laboratory, University of Utah) with an rms surface roughness of < 1 nm measured on 1 µm2 surface areas were cut to 10 mm × 10 mm, cleaned in chromosulfuric acid at 70°C for 1 h, washed with deionized water and dried. The oxide layer was grown by exposing the plates to oxygen plasma (0.2 Torr O2 pressure) for 5 min in a radio frequency plasma chamber (50 W power, Plasmod, Tegal Corp). Subsequent surface modification steps were identical to the steps used in the surface modification of fused silica plates.
2.2. XPS
The XPS spectra of MTS-modified silica surfaces were recorded with an XPS spectrometer (Model 5950B, Hewlett-Packard) fitted with a monochromatized A1 Kα X-ray source. The anode was operated at 400 W. An electron flood gun (6 eV) was applied to compensate for the charging of specimen surfaces. The 285 eV peak of Cl s electrons was used as an internal XPS standard. Elemental concentrations (at.%) were calculated from the peak areas and the corresponding photoelectron cross-sections [24]. The peak deconvolution was performed after baseline subtraction by assuming that the constituent peaks have Gaussian shape.
2.3. Contact angle measurements
Water contact angles were measured on modified silica surfaces at room temperature using a goniometer (A-100, Rame-Hart). Contact angles of eight or more droplets of deionized, doubly-distilled water (10 µl volume) were measured on each sample surface.
2.4. Patterning of MTS-silica surfaces
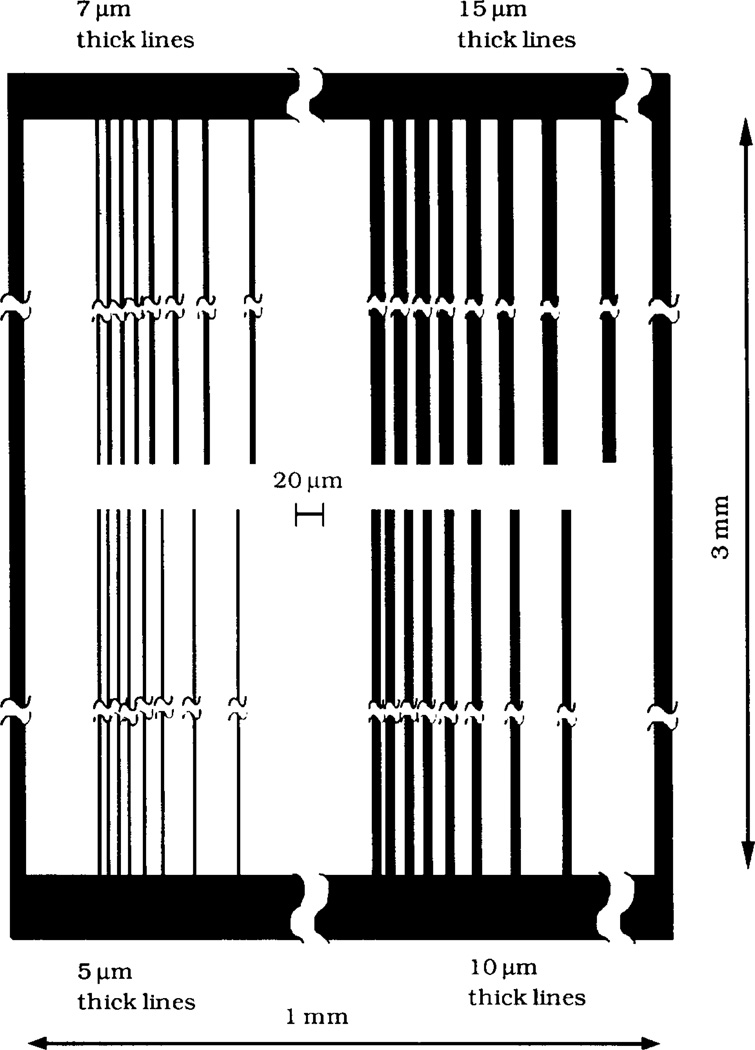
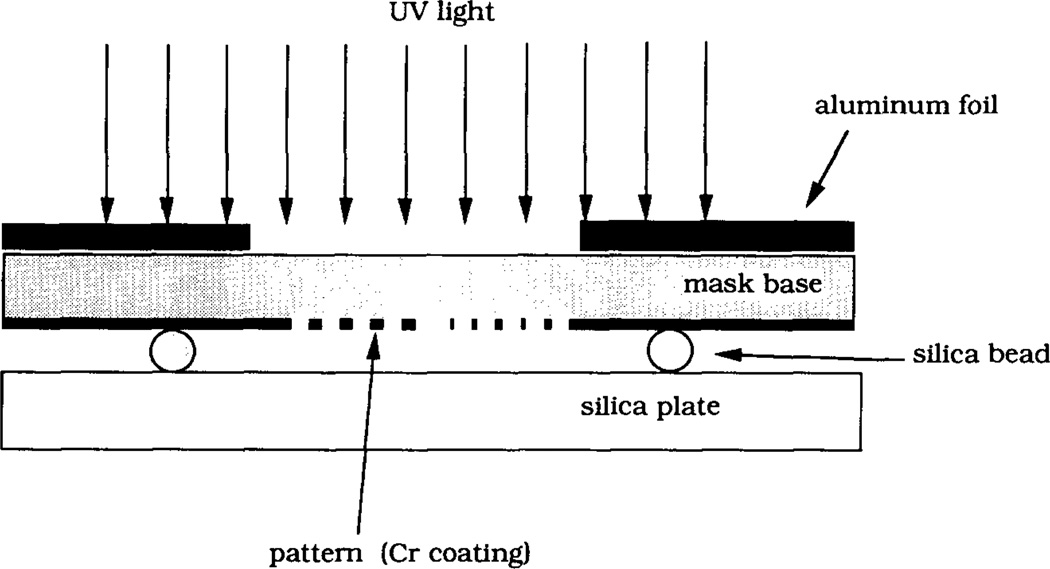
The MTS-modified silica plates were exposed to UV radiation for desired periods of time using a low pressure mercury lamp (400 W, Model ELC 4000, Electrolite Corp). The irradiation power was 15 mW cm−2 as measured by a 365 nm-sensitive light meter (DM-365H, Spectronics Corp). In the surface patterning step a MTS-silica surface was irradiated through a custom-designed mask consisting of a patterned chromium coating on a 1 mm thick fused silica plate (LSI Photoma sk Inc). The masking pat tern is illustrated in Fig. 1. The total size of the pattern was 1 mm × 3 mm, with the lines of the pat tern oriented along the longer dimension. In order to avoid the transfer of the surface-bound silane from the MTS-silica plate onto the chromium coating of the mask, 20 µm glass beads were placed between the silica plate and the mask around the pat tern perimeter. The upper surface of the mask around the pattern area was covered with an aluminum foil in order to minimize heating of the MTS-silica plate by the UV lamp. Fig. 2 is a schematic diagram of the UV patterning.
Fig. 1.
Schematic of the mask used for surface patterning. The black stripes indicate the area of the mask coated with chromium which protected the surface underneath from UV irradiation. The overall mask dimensions were 3 mm by 1 mm with the chromium stripes running along the longer dimension of the mask. The four groups of chromium stripes 1.5 mm long have widths of 5, 7, 10 and 15 µm. In each group, the stripes were separated by 8, 8, 10, 13, 18, 28 and 43 µm wide uncoated areas.
Fig. 2.
Geometry of UV irradiation. The mask is placed on a MTS-modified silica plate. Glass beads of average size 20 µm are placed between the mask and the silica plate to avoid the transfer of the surface-bound MTS from the silica plate onto the chromium coating of the mask. Aluminum foil covers the area around the pattern in order to minimize heating of the sample by the UV lamp.
2.5. SFM
A scanning force microscope (Explorer, Topometrix Inc.) was used to image the patterns on the MTS-silica surface in the lateral force scanning mode. The same instrument was used to measure the adhesion forces between the integral SFM Si3N 4 tip and different regions of the patterned MTS-silica surface. All SFM measurements were performed in a 0.01 M, pH 7.4 phosphate buffer solution. The nominal spring constant of the cantilever used in the SFM measurements was 0.032 N m−1.
2.6. Microscopic visualization of MTS patterns
The MTS surface patterns were visualized using TIRF microscopy. The 488nm laser beam (5490ASL, Ion Laser Technology) was totally internally reflected at the interface between the patterned MTS-silica surface and the 10 µM aqueous solution of acridine orange in Ca2+/Mg2+-free Tyrode’s buffer. The evanescent surface wave created by the total reflection excited the acridine orange fluorescence only in the close proximity of the MTS-silica surface. The fluorescence was imaged using a fluorescence microscope (Diaphot 200, Nikon) equipped with a 60 × objective (N.A.=0.75), a 520 nm long-pass filter and a thermoelectrically- cooled CCD camera (CH200, Photometrics). The same TIRF microscopy set-up was used to image the fluorescence patterns after incubation of the MTS-silica surface with a solution of fluorescein-labeled fibrinogen (FITC-Fgn, 0.0175 mgml−1 in phosphate buffer saline) and subsequent washing with the buffer solution. The MTS pattern on the oxidized silicon surfaces was also visualized after surface water vapor condensation using a 10 × objective and the reflectance microscope (Diaphot 200, Nikon).
2.7. FITC-Fgn adsorption
Human fibrinogen (Fgn, > 95% clottable, Calbiochem) was labeled with fluorescein isothiocyanate (FITC) using a modification of the procedure described by Coons et al. [25]. The molar ratio of FITC to Fgn in the FITC-Fgn conjugate, determined from the absorption of FITC-Fgn at 280 and 490 nm and from the 280/490 FITC solution absorption ratio, was found to be 1.25. The adsorption kinetics of FITC-Fgn onto the unoxidized and oxidized MTS-silica surface was studied in two separate adsorption experiments using TIRF spectroscopy [2]. A polarized 488 nm laser beam from an Ar+-ion laser (5490ASL, Ion Laser Technology) was spatially filtered and focused on the interface with a 10 × microscope objective. The power of the beam was adjusted to 5 µW in order to minimize photobleaching of the adsorbed FITC-Fgn. The beam was guided normal to the face of a small 70 ° dovetail silica prism optically coupled to a MTS-silica plate. The polarization of the beam was normal to the incident plane. The laser beam totally reflected at the silica plate/solution interface illuminated a small region of the interface with an evanescent surface wave. The surface fluorescence of adsorbed FITC-Fgn excited by the evanescent surface wave was focused onto the entrance slit of a 0.25 m spectrograph (f/4, 1681C, SPEX Industries Inc., 2 mm slit, 300 grooves per mm of grating) using a 50 mm lens (f/4, Pentax, Asahi) and recorded by a thermoelectrically-cooled CCD camera (CH200, Photometrics). The CCD camera detected the fluorescence emission between 510 and 630 nm. The fluorescence of adsorbed FITC-Fgn was recorded with a 1 s exposure approximately every 5 s using custom-made acquisition software running on a Macintosh computer. An electronic shutter (Newport) was programmed to allow the laser beam illumination of the interface only during the 1 s camera exposure. The 1 s background signal, recorded while the laser beam was blocked by the shutter, was subtracted from the fluorescence signal. A total of 125 sequential fluorescence 1 s exposures were recorded in a total time of 10.2 min while the FITC-Fgn solution (0.0175 mg ml−1 in pH 7.4 phosphate buffer saline) flowed through the cell at a rate of 0.84 ml min−1. The adsorption part of the experiment was terminated by switching the protein solution flow to a flow of the buffer solution. During the desorption part of the experiment, the fluorescence signal from the interface was recorded using a second set of 125 sequential 1 s exposures.
2.8. 125I-Fibrinogen adsorption
Human fibrinogen (Fgn, > 95% clottable, Calbiochem) was labeled with 125I (carrier-free, 83% specific activity, Amersham) using the iodine monochloride procedure [26]. The degree of labeling amounted to 0.17 mol 125I per mol Fgn. The 125I-Fgn adsorption was carried out in an adsorption experiment which was identical to the TIRF adsorption experiment except for the fluorescence excitation and emission detection. After the adsorption-desorption cycle was completed, the silica plate with the adsorbed protein was dried and the radioactivity of adsorbed protein was counted through a 0.5 cm × 1 cm lead window using a γ-counter (170M, Beckman). The adsorbed amount per unit area, Γ125I-Fgn, was calculated from the γ-radiation count found on the MTS-silica surface using a 125I-Fgn γ-radiation count calibration curve. The TIRF kinetics data were converted to the adsorbed amount per unit area, ΓFITC-Fgn, VS. time by assuming that at the end of the adsorption–desorption cycle ΓFITC-Fgn, was equal to Γ125I-Fgn.
3. Results
3.1. Characterization of MTS-silica surface
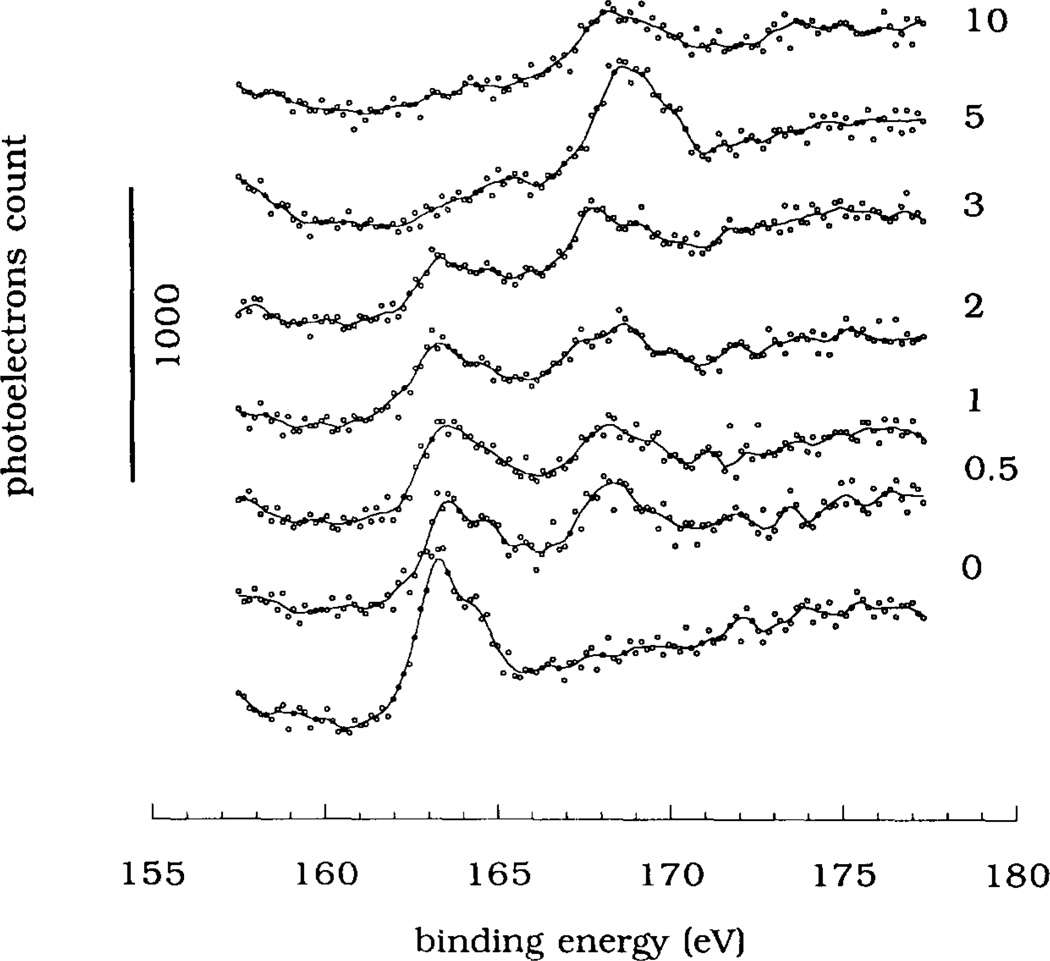
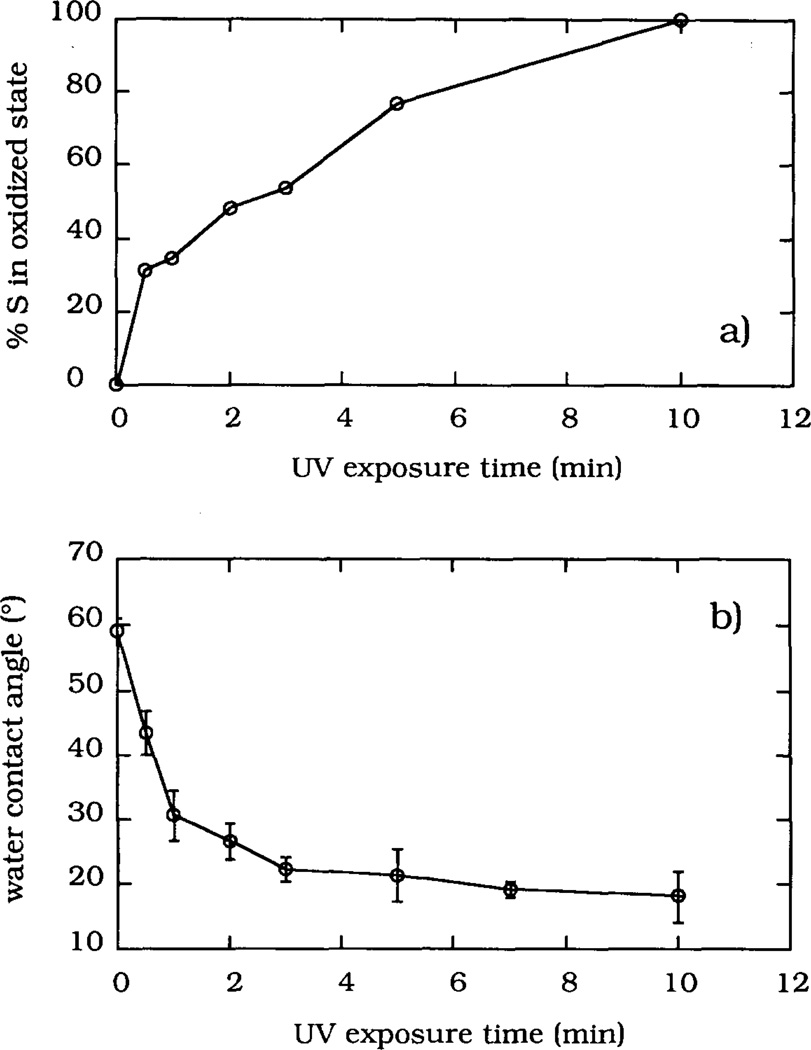
The XPS S2p spectra of the MTS-silica surface are shown in Fig. 3 as a function of the UV irradiation time. The S2p peak at 163.5 eV recorded prior to the UV irradiation (spectrum “0”) was resolved into two contributing peaks: the S2p1/2 peak (max. at 164.7 eV) and the S2p3/2 peak (max. at 163.5 eV) (deconvoluted peaks are not shown). The 0.55 area ratio between the deconvoluted peaks was in agreement with the literature value [24]. During the UV irradiation the area of the S2p peak at 163.5 eV decreased while a new peak appeared at a higher binding energy of 169 eV. The higher binding energy of the S2p peak indicated that the sulfur atom of the –SH groups has recombined with some electronegative atoms, probably with ambient oxygen atoms, into a sulfonate-like moiety. A similar mechanism of surface thiol oxidation has been proposed by Bhatia et al. [9]. After 5 min of UV irradiation, the S2p peak shifted almost completely to the 169 eV binding energy. UV irradiation times longer than 5 min caused an overall decrease in the S2p peak area (spectrum “10” in Fig. 3). The fraction of sulfur in the oxidized state, defined as a ratio of the higher energy peak area (i.e. at 169 eV) to the total S2p peak area (defined as the 163.5 eV peak area plus the 169 eV peak area), increased with the UV irradiation time (Fig. 4a), thus providing a quantitative measure of the extent of surface sulfur oxidation.
Fig. 3.
The XPS S2p spectra of MTS-silica surfaces shown as a function of the UV irradiation time (times are indicated in minutes). Each spectrum was obtained by the integration of 40 narrow scans using a narrow aperture in the XPS spectrometer. An electron flood gun (6 eV) was applied to compensate for the charging of the specimen surface. The binding energy axis was calibrated using the Cls electrons at 285 eV binding energy as an internal standard.
Fig. 4.
Fraction of sulfur in the oxidized state (a) and water contact angles (b) shown as a function of the UV irradiation time.
During the UV irradiation the MTS-silica surface became more water wettable: the water contact angle decreased from 59 ± 2 ° to 18 ± 4 ° for 10 min of UV irradiation (Fig. 4b). In the case of the MTS layer prepared on the oxidized silicon surface, the contact angle changed from 60 ± 1 ° to 17 ± 3 ° after 10 rain of UV irradiation, indicating that a similar oxidation process has occurred. The optimal irradiation time for the oxidation of the MTS-silica surface was selected as 5 rain. Based on the UV absorpt ion spectrum of MTS in TCE, which showed a maximum at 270 nm, and the known irradiation spectrum of the low pressure Hg lamp, the 5 min UV irradiation dose was estimated to be 4.8 J cm−2 at 270 nm.
Table 1 shows the XPS elemental analysis of the MTS-silica surface before and after the UV irradiation. After 10 min of irradiation the oxygen content increased from 28.0 to 40.7 at.%, suggesting that oxidation has indeed occurred. The sulfur content decreased from 2.1 to 1.6 at.%, and the carbon content also decreased from 47.0 to 34.7 at.%. The ratios of S/Si and C/Si also decreased, indicating that some losses of the surface-bound MTS moieties might also have occurred during the 10 min of irradiation.
Table 1.
Results of the XPS elemental analysis of the MTS-silica surface before and after 10 min of UV irradiation treatment
| C (at.%) | S (at.%) | Si (at.%) | O (at.%) |
|---|---|---|---|
| Before UV irradiation | |||
| 47.0 | 2.1 | 22.9 | 28.0 |
| After UV irradiation | |||
| 34.7 | 1.6 | 23.0 | 40.7 |
3.2. Visualization of the MTS-silica patterns
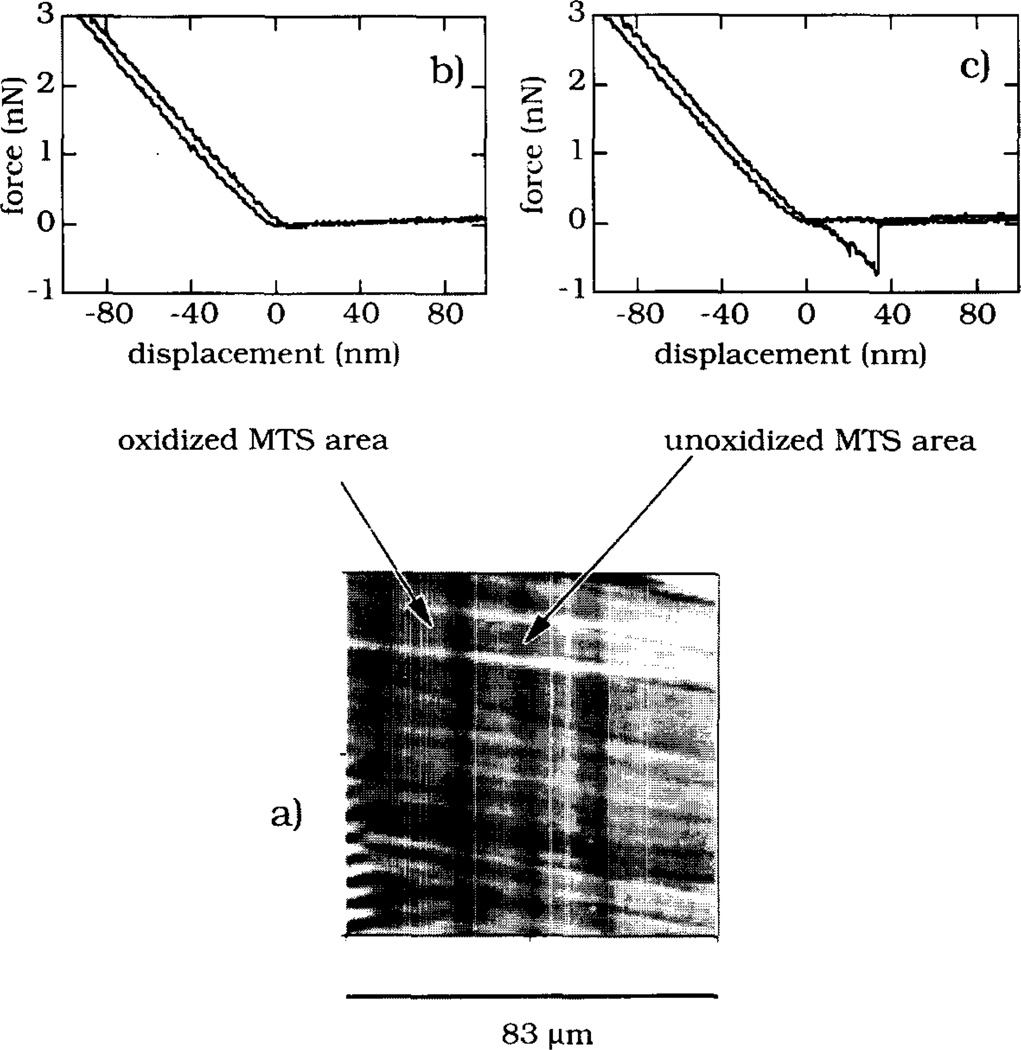
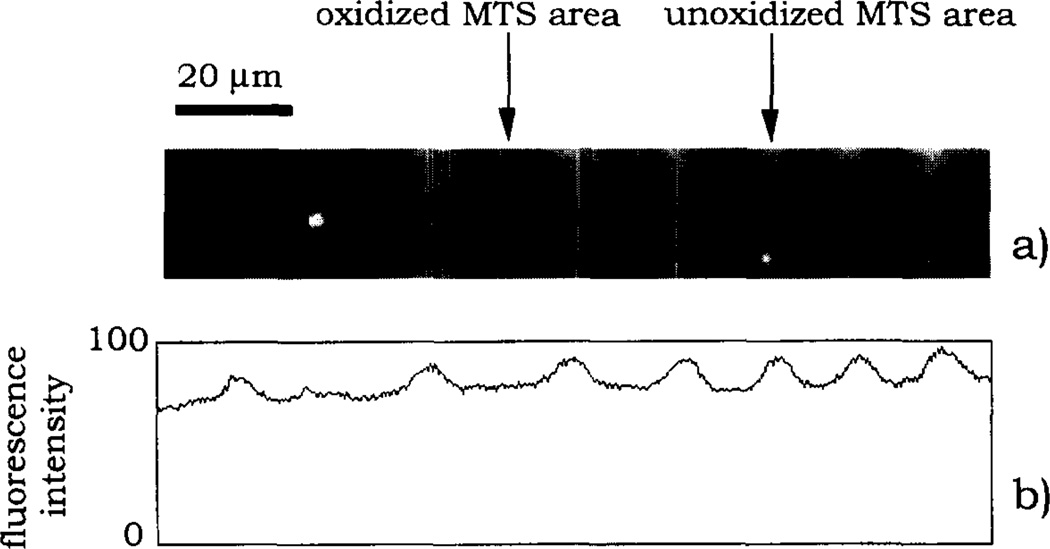
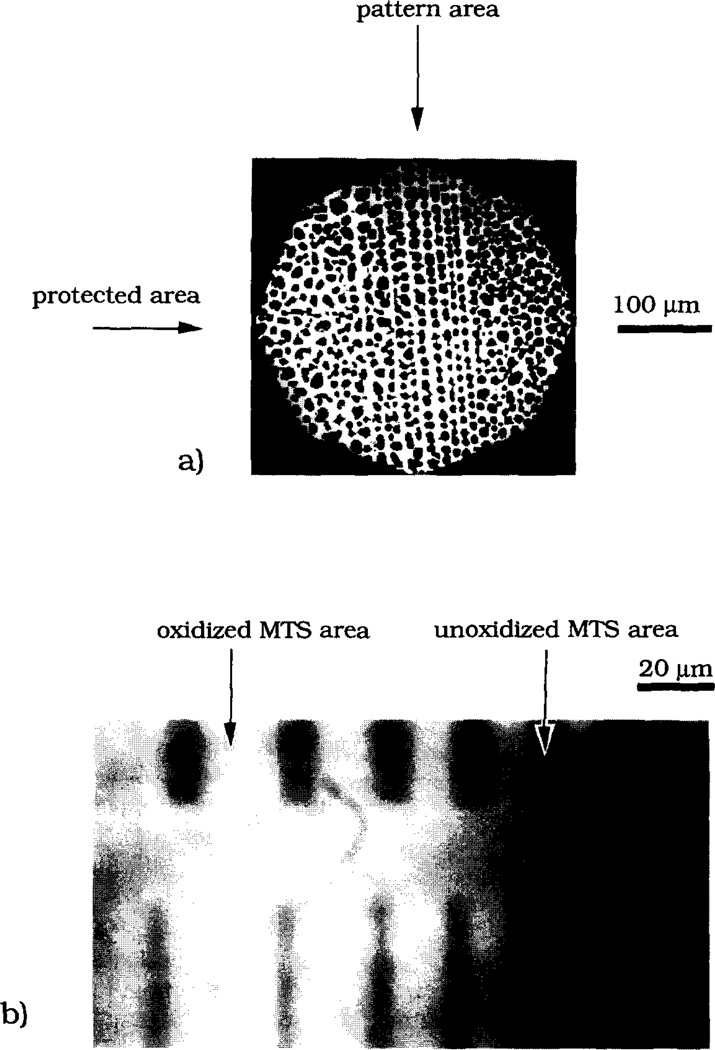
Images of MTS-silica surface patterns are shown in Fig. 5–7. A region of the MTS-surface pattern prepared on the oxidized silicon was imaged in a 0.01 M phosphate buffer using lateral force SFM (Fig. 5a). The two SFM force–displacement traces (Figs. 5b and 5c) showed a noticeable adhesion force (≈0.7 nN) on the –SH surface area but not on the oxidized sulfonate region (Fig. 5b). Fig. 6 shows two different regions of the MTS surface pattern observed using reflectance microscopy after water vapor condensation (Fig. 6a) and TIRF microscopy after the pattern was brought in contact with the solution of acridine orange (Fig. 6b). The visualization of the MTS pattern on silica was also made using the TIRF microscope and adsorbed FITC-Fgn as a pattern surface probe (Fig. 7a). The fluorescence intensity profile (Fig. 7b) indicated that the amount of adsorbed FITC-Fgn was different on unoxidized and oxidized MTS-surface areas.
Fig. 5.
Lateral force SFM imaging of a region of the MTS-surface pattern prepared on oxidized silicon by 5 min UV irradiation. (a) The 83 µm × 83 µm region of the pattern. (b) The SFM force-displacement curve measured on the oxidized MTS-surface region. (c) The SFM force-displacement curve measured on the unoxidized MTS-surface region.
Fig. 7.
The fluorescence image of FITC-Fgn adsorbed on the MTS-silica pattern: (a) image recorded using the TIRF microscope; (b) fluorescence profile showing the image contrast. See text for experimental details.
Fig. 6.
Visualization of the MTS-surface patterns: (a) vapor condensation pattern observed using the reflectance microscope; (b) acridine orange fluorescence pattern observed using the TIRF microscope. See text for experimental details.
3.3. Fibrinogen adsorption onto oxidized and unoxidized MTS-silica surfaces
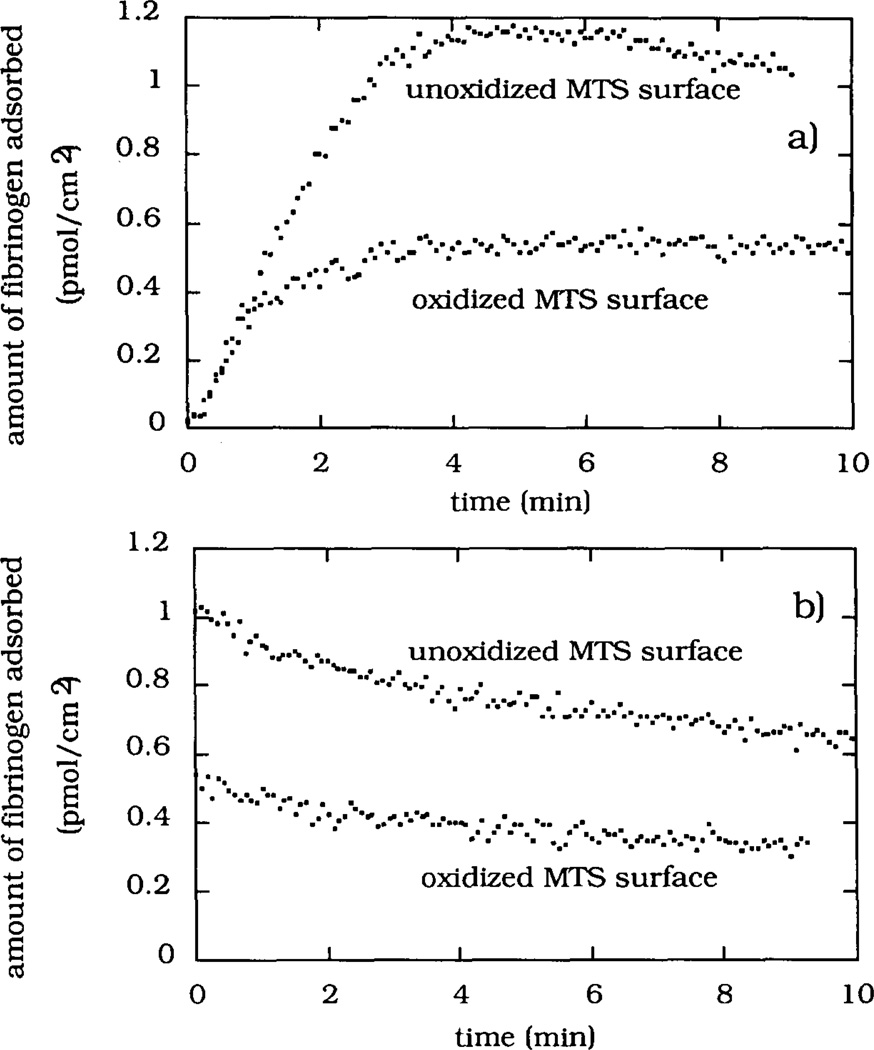
The FITC-Fgn adsorption and desorption kinetics are shown in Fig. 8. The calibration of the surface fluorescence intensity made use of the 125I-Fgn adsorption measured under otherwise identical experimental conditions. The adsorption kinetics from 0.0175 mgml−1 solution onto oxidized and unoxidized MTS-silica surfaces (Fig. 8a) showed identical initial adsorption rates. The initial adsorption rate, (dΓ/dt)init = 7 fmol cm−2 S−1, was approximately linear as expected for transport-limited adsorption occurring from a flowing protein solution. The adsorption rate rapidly decreased in the case of the oxidized MTS-silica surface: within the first 3 min the adsorption reached a steady-state level of ΓFITC-Fgn (ox) ≈0.5 pmol cm−2. The initial adsorption rate on the unoxidized MTS-silica surface remained approximately constant during the first 2.5 rain of adsorption, after which the adsorption leveled off at ΓFITC-Fgn (unOX)≈ 1.15 pmol cm−2. Despite the very low intensity of the laser excitation light used in TIRF experiments, some evidence of photo-bleaching was observed on the unoxidized MTS-silica surface (Fig. 8a). The photobleaching ettects were more evident when a higher laser power was used (data not shown). The desorption part of the experiments showed the desorption rates, (dΓ/dt)des, to be 7.4 × 10⁻⁴ s−1 and 6.7 × 10⁻⁴ s−1 for the oxidized and unoxidized MTS-silica surfaces respectively (Fig. 8b).
Fig. 8.
The kinetics of FITC-Fgn adsorption (a) and desorption (b) on the oxidized and unoxidized MTS-silica surfaces measured using TIRF spectroscopy. The adsorption axes were calibrated using the results of the 125I-Fgn adsorption experiments.
4. Discussion
Control over the spatial distribution of two different surface chemical groups was achieved by the UV irradiation of silica surfaces treated with MTS. A custom-designed mask was used to provide the irradiation pattern. The XPS spectra showed that the UV irradiation in the ambient atmosphere resulted in an oxidation of the surface –SH group, probably converting it into a sulfonate surface moiety. The UV dose necessary for the optimal oxidation of surface thiol groups was 4.8 J cm−2 at 270 nm which corresponded to a 5 min irradiation time under the present experimental conditions. Longer irradiation times caused some losses of the MTS surface layer.
Water contact angle measurements and the XPS-measured fraction of surface sulfur present in an oxidized state were used as parameters for the optimization of the irradiation treatment (Fig. 4). The water contact angle reached a constant minimum value after 5 min of irradiation, implying that the oxidation of the outermost moieties on the surface has been completed. The fraction of sulfur in the oxidized state continued to increase with longer irradiation times, indicating that the complete oxidation of sulfur in the MTS layer may require a larger irradiation dose. The difference between the results obtained by these two types of measurements suggests that some sulfur atoms in the MTS layer might have restricted accessibility for ambient oxygen: some –SH groups are probably fully exposed while others may be buried within the MTS layer.
The amounts of both carbon and sulfur in the surface layer decreased upon longer UV irradiation while the amount of oxygen increased. The amounts of carbon and sulfur, normalized with respect to the amount of silicon, also decreased upon UV irradiation. Based on the decreases in the C/Si and S/Si ratios it could be speculated that some breakage of covalent bonds within the MTS layer and subsequent evaporat ion of the MTS moieties occurred during the UV irradiation treatment. It was also noted that the XPS C1 s peak broadened towards the 287–289 eV binding energy region (not shown here), suggesting that some oxidation of surface carbon atoms might also have occurred due to the UV irradiation.
The created surface patterns could be visualized using several different methods. The unoxidized and oxidized MTS surface regions displayed different frictional forces in dilute electrolyte solution which resulted in an SFM friction contrast image (Fig. 5). It is known that friction and topography influence each other during the contact mode SFM imaging [27,28]. Frictional SFM imaging of a stamped film of alkanethiols on gold has also demonstrated that areas differing in terms of surface chemistries can be resolved through lateral force imaging [16]. So-called “specific chemical SFM imaging” described in the literature [29] might also have its physical origin in different frictional effects. No attempts were made in this study to quantify the frictional effects. The adhesion force between the SFM tip and the MTS-surface was found only on the unoxidized MTS surface regions, indicating that the adhesion could also be used to map the two surface regions of different chemistry.
The simplest pattern visualization method was water vapor condensation on the patterned surface followed by microscopic observation (Fig. 6a). The position of a single MTS-surface pattern on a larger silica plate could be easily located using the vapor condensation method. TIRF microscopy was used to visualize the MTS surface pattern in contact with acridine orange solution (Fig. 6b). Under normal epi-illumination of the fluorescence microscope the background fluorescence of the dye solution prevented the observation of the pattern, which was only visible when the evanescent surface wave illumination was used. Acridine orange is a cationic dye molecule often used as a membrane potential probe; the molecule carries a positive charge in solution and accumulates at negatively charged surface areas [30]. Its accumulation at the oxidized MTS surface regions gives support for the conclusion that the conversion of –SH groups into a sulfonate-like surface moiety has occurred: in aqueous solution the surface sulfonate groups will acquire negative charge and attract the dye molecule through electrostatic interactions.
The FITC-Fgn adsorption kinetics showed that both regions of the MTS-silica surface adsorb fibrinogen with the same initial rates. This is likely to occur in the cases where the intrinsic adsorption rate is high and/or the supply of protein molecules to the adsorbing surface is slow. In such cases the process of the transport of protein molecules through the boundary diffusion layer becomes the rate-limiting step for initial adsorption. After 1 min of adsorption, the FITC-Fgn adsorption rates started to differ, resulting in a 2-to-1 ratio of the steady-state adsorbed amount on the unoxidized vs. oxidized MTS-silica surfaces. Some evidence of photobleaching was noticed as a shallow maximum in the steady-state fibrinogen adsorpt ion on the unoxidized MTS-silica surface (Fig. 8a). No at tempts were made to correct the experimental data for this effect. The steady-state fibrinogen adsorption was 1.15 pmol cm−2 (i.e. 0.39 µg cm−2) on the unoxidized MTS-silica surface, indicating that the adsorbed fibrinogen has built up a half of a monolayer [31]. The fibrinogen desorption rates were rather slow and almost identical in magnitude for both types of MTS-silica surfaces (Fig. 8b). The relatively high protein surface concentration measured on MTS-silica surfaces during fibrinogen adsorption from dilute protein solutions is in general agreement with the physiological role this protein has in blood coagulation. A tentative conclusion drawn from the fibrinogen adsorption kinetics is that accurate control over the fibrinogen surface concentration will indeed be difficult to achieve in the case when the desired surface density of fibrinogen is only a small fraction of a monolayer.
5. Summary
A spatial chemical pattern on a silica surface treated with MTS was created using UV irradiation. The effects of UV irradiation on the MTS surface layer were investigated using XPS, SFM and water contact angle measurements. The optimal dose of UV radiation for the surface –SH group oxidation was estimated by measuring XPS S2p binding energy shifts and water contact angles for irradiated surfaces. The MTS surface patterns were visualized using water vapor condensation and evanescent surface wave excitation of acridine orange fluorescence. Adsorption of FITC-Fgn from a dilute buffer solution also produced visual information about the MTS surface pattern. The fibrinogen adsorption onto the oxidized and unoxidized MTS-silica surfaces, studied by TIRF, displayed similar initial adsorption rates, different steady-state adsorption levels and slow desorption.
Acknowledgment
This work was supported by an NIH grant (R01HL-44538) and by a grant from the Center for Biopolymers at Interfaces at the University of Utah. The technical assistance of Andras Pungor (SFM) and Paul Dryden (XPS) is gratefully acknowledged.
References
- 1.Gölander C-G, Lin Y-S, Hlady V, Andrade JD. Colloids Surfaces. 1990;49:289. doi: 10.1016/0927-7765(93)01114-7. [DOI] [PMC free article] [PubMed] [Google Scholar]
- 2.Hlady V. Appl. Spectrosc. 1991;45:246. [Google Scholar]
- 3.Lin Y-S, Hlady V. Colloids Surfaces B: Biointerfaces. 1994;2:481. doi: 10.1016/0927-7765(94)80056-1. [DOI] [PMC free article] [PubMed] [Google Scholar]
- 4.Ho C-H, Hlady V. ACS Symp. Ser. Vol. 602. Washington, DC: American Chemical Society; 1995. p. 371. [Google Scholar]
- 5.Lee JH, Lee HB. J. Biomater. Sci., Polym. Ed. 1993;4:467. doi: 10.1163/156856293x00131. [DOI] [PubMed] [Google Scholar]
- 6.Elwing H, Welin S, Askendal A, Nilsson U, Lundström I. J. Colloid Interface Sci. 1987;119:203. [Google Scholar]
- 7.Dulcey CS, Georger JH, Jr, Krauthamer V, Stenger DA, Fare TL, Calvert JM. Science. 1991;252:551. doi: 10.1126/science.2020853. [DOI] [PubMed] [Google Scholar]
- 8.Calvert JM, Georger JH, Peckerar MC, Pehrsson PE, Schnur JM, Schoen PE. Thin Solid Films. 1992;210/211:359. [Google Scholar]
- 9.Bhatia SK, Hickman JJ, Ligler FS. J. Am. Chem. Soc. 1992;114:4432. [Google Scholar]
- 10.Ranieri JP, Bellamkonda R, Jacob J, Vargo TG, Gardella JA, Jr, Aebischer P. J. Biomed. Mater. Res. 1993;27:917. doi: 10.1002/jbm.820270711. [DOI] [PubMed] [Google Scholar]
- 11.Valentini RP, Aebischer P, Vargo TG, Gardella JA., Jr J. Biomater. Sci., Polym. Ed. 1993;5:13. doi: 10.1163/156856294x00626. [DOI] [PubMed] [Google Scholar]
- 12.Fodor SPA, Read JL, Pirrung MC, Stryer L, Lu AT, Solas D. Science. 1991;251:767. doi: 10.1126/science.1990438. [DOI] [PubMed] [Google Scholar]
- 13.Rozsnyai LF, Benson DR, Fodor SPA, Schultz PG. Angew. Chem., Int. Ed. Engl. 1992;31:759. [Google Scholar]
- 14.Kumar A, Whitesides GM. Science. 1994;263:60. doi: 10.1126/science.263.5143.60. [DOI] [PubMed] [Google Scholar]
- 15.Kimura J, Kawana Y, Kuriyama T. Biosensors. 1988;14:41. [Google Scholar]
- 16.Wilbur JL, Biebuyck HA, MacDonald JC, Whitesides GM. Langmuir. 1995;11:825. [Google Scholar]
- 17.Douglas K, Devaud G, Clark NA. Science. 1992;257:642. doi: 10.1126/science.257.5070.642. [DOI] [PubMed] [Google Scholar]
- 18.Jaschke M, Butt H. Langmuir. 1995;11:1061. [Google Scholar]
- 19.Hanazato Y, Nakako M, Maeda M, Shiono S. Anal. Chim. Acta. 1987;193:87. [Google Scholar]
- 20.Vopel T, Ladde A, Müler H. Anal. Chim. Acta. 1991;251:117. [Google Scholar]
- 21.Britland S, Perez-Arnaud E, Clark P, McGinn B, Connolly P, Moores G. Biotechnol. Prog. 1992;8:155. doi: 10.1021/bp00014a010. [DOI] [PubMed] [Google Scholar]
- 22.Ivanova OY, Margols LB. Nature. 1973;242:200. doi: 10.1038/242200a0. [DOI] [PubMed] [Google Scholar]
- 23.Kleinfeld D, Kahler KH, Hockberger PE. J. Neurosci. 1988;8:4098. doi: 10.1523/JNEUROSCI.08-11-04098.1988. [DOI] [PMC free article] [PubMed] [Google Scholar]
- 24.Andrade JD, editor. Surface and Interfacial Aspects of Biomedical Polymers. Vol. 1. New York: Plenum; 1985. [Google Scholar]
- 25.Coons AM, Crech HJ, Jones RN, Berliner E. J. Immunol. 1942;45:159. [Google Scholar]
- 26.Ardaillou N, Larrieu MJ. Thrombosis Res. 1974;5:327. doi: 10.1016/0049-3848(74)90171-6. [DOI] [PubMed] [Google Scholar]
- 27.Hangstad G, Gladfelter WL, Weberg EB. Langmuir. 1993;9:3717. [Google Scholar]
- 28.Overney RM, Meyer E, Frommer J, Brodbeck D, Luthi R, Howald L, Güntherodt HJ, Fujihira M, Takano H, Gotah Y. Nature. 1992;359:133. [Google Scholar]
- 29.Frisbie CD, Rozsnyai LF, Noy A, Wrighton MS, Lieber CM. Science. 1994;265:2071. doi: 10.1126/science.265.5181.2071. [DOI] [PubMed] [Google Scholar]
- 30.Haugland RP, Larison KD, editors. Handbook of Fluorescent Probes and Research Chemicals. Eugene, OR: Molecular Probes Inc.; 1992. [Google Scholar]
- 31.Nygren H, Stenberg M, Karlsson C. J. Biomed. Mater. Res. 1992;26:77. doi: 10.1002/jbm.820260108. [DOI] [PubMed] [Google Scholar]


