Abstract
Inhibitors of epidermal growth factor (EGF) receptor tyrosine kinases show efficacy in cancers that are highly addicted to non-mutated EGF signaling, but off-target effects limit therapy. Carrier-based formulations could reduce drug deposition in normal tissues, enhance tumor deposition, and reduce free drug concentrations, thereby reducing side effects. Therefore, the feasibility of developing nano-liposomal formulations of EGF receptor inhibitors was investigated. Gefitinib and erlotinib fluorescence was characterized as a tool for formulation development. Peak excitation was 345 nm and peak emission was 385–465 nm, depending upon environment polarity. Emission was negligible in water but intense in non-polar solvents, membranes, or bound to serum proteins. Cellular uptake and distribution also could be imaged by fluorescence in drug-resistant tumor spheroids. Gefitinib fluorescence characteristics enabled facile optimization of formulations. Whereas 4–6 mol% gefitinib could be incorporated in the liposome bilayer, 40–60 mol% could be encapsulated in stable, remote-loaded liposomes consisting of distearoylphosphatidylcholine:polyethylene glycol-distereoylphosphatidylethanolamine:cholesterol (9:1:5 mol:mol:mol). Drug leakage in serum, monitored by fluorescence, was minimal over 24 h at 37°C. The results provide both promising lead formulations as well as novel tools for evaluating new formulations of structurally-similar receptor tyrosine kinase inhibitors and their cellular uptake and tissue biodistribution.
Keywords: Liposomes, Nanoparticles, Fluorescence spectroscopy, Cancer chemotherapy, Physicochemical properties, Encapsulation, Tyrosine kinase inhibitor, Gefitinib, Erlotinib
Introduction
Molecularly targeted agents hold promise for selective interdiction of aberrant cellular signaling pathways in cancer. Elevated receptor-associated tyrosine kinase (RTK) signaling supports the proliferation of numerous cancers. Epidermal growth factor receptor (EGFR) receptor signaling is activated in numerous solid tumors, including breast, non-small cell lung, brain, and other cancers 1–4. An intensive effort to design selective inhibitors of EGFR was successful, and gefitinib (Iressa®) was the first-in-class agent approved. Erlotinib (Tarceva®) is structurally similar to gefitinib, and is also approved clinically. Like most RTK inhibitors, they bind the ATP binding pocket, thereby preventing phosphorylation and activation 2. Tumors that have high ‘pathway addiction’ or dependence upon EGFR signaling, and the kinase or downstream signaling components are not constitutively activated by mutation, generally respond well to RTK inhibitors 5. However, clinical outcomes for these agents have been disappointing. In part, only a subset of cancers possesses sufficient pathway addiction. In some cancers, mutations constitutively activating the RTK and downstream signaling pathway are common. Finally, off-target actions often limit use. The most common side effects in a Phase III trial for gefitinib were rash/acne and diarrhea 6, which typically appeared after 1–2 weeks of treatment 7. A second effect of the EGFR inhibitors is elevated toxicity caused by pharmacokinetic interactions with other co-administered drugs, frequently at the level of drug elimination mechanisms. A third effect of gefitinib is compromise of the blood brain barrier to xenobiotics; it increased topotecan concentrations in brain extracellular fluid, likely by inhibition of multidrug-resistance (MDR) transporters of the blood brain barrier 8. Efforts to employ MDR transporter inhibitors to enhance tumor accumulation of chemotherapeutic agents generally have failed because of drug interactions impacting common drug elimination mechanisms, and effects upon the blood brain barrier and other tissues 9.
Although the EGFR inhibitors are orally active and have acceptable bioavailability 10, we hypothesized that drug delivery approaches could improve the efficacy of combination therapies with EGFR inhibitors. Gefitinib accumulates in tumor, skin, kidney, and liver at levels significantly higher than in plasma 11, most likely because of its hydrophobicity. Encapsulation in carriers such as liposomes would reduce concentrations of free drug in the blood and thereby limit deposition in normal tissues such as bone marrow 12. Severe, life-threatening neutropenia was encountered in a phase II study of vinorelbine combined with gefitinib 13, and the toxicity of this combination was also observed in mice 14. Reduction in free gefitinib concentrations or in bone marrow could potentially reduce myelotoxicity. Skin rash from gefitinib also is a significant clinical side effect that might be addressed by carrier delivery. Accumulation of gefitinib in tumors is just 2-fold greater than in skin 15, and previous studies have shown that liposome encapsulation can result in 10-fold higher tumor drug concentrations compared with skin 16. Finally, encapsulation of drugs in nanoparticulate carriers can increase tumor deposition of drugs via the enhanced permeability and retention (EPR) phenomenon 17–19 that arises from the compromised vascular barrier of tumors. Elevated tumor extravasation of nanoparticulates, leading to more selective deposition of EGFR inhibitors and accompanied by a subsequent slow release of drug from an intratumor depot, could enhance antitumor effects and reduce effects upon critical normal tissues.
The primary objective of this work was to develop liposomal formulations of RTK inhibitors and evaluate their stability and release characteristics. Achievement of the experimental objectives was aided by the novel observation of environment-sensitive fluorescence spectral characteristics of these RTK inhibitors, which permitted facile evaluation of drug encapsulation, release, and binding to serum proteins, and could be used to monitor drug uptake by tumor cells.
Experimental section
Materials
Gefitinib was from Sequoia Research Products (Pangbourne, UK). Erlotinib was from ChemieTek (Indianapolis, IN). Purified lipids were from Avanti Polar Lipids (Alabaster, AL). HPLC-grade solvents and reagents were from Sigma (St. Louis, MO).
Liposome preparation
Bilayer-incorporated drug
Phospholipids, cholesterol (Chol), and drug were mixed in chloroform and dried to a thin film using a rotary evaporator, and hydrated with Tris-buffered saline (TBS; 150 mM NaCl, 25 mM Tris, pH 7.2) above the phospholipid phase transition temperature. Half of each preparation was extruded multiple times through polycarbonate filters (GE Water & Process Technologies, Trevose, PA) to a final pore size of 80 nm, resulting in small unilamellar vesicles (SUV). Liposome size was determined using a NICOMP™ 380 (Particle Sizing Systems, Santa Barbara, CA). Phospholipid concentrations were determined by phosphate assay 20. Gefitinib concentrations were determined from absorbance at 345 nm in 1:1 (v/v) chloroform:methanol or by fluorescence (below) by comparison to a standard curve.
Lumen-incorporated drug
Liposomes were prepared as above, except that drug was omitted from the dried lipid film, and the lipid was hydrated with an aqueous solution of a trapping ion: (i) 300 mM citrate at pH 3.93, (ii) 250 mM ammonium sulfate, or, as a control, (iii) 150 mM NaCl, 25 mM Tris, pH 8.2. Unencapsulated trapping ion was removed by dialysis against 500 mM sucrose, 25 mM histidine, pH 6.2.
For the drug remote loading procedure, a pH of 6.2 was selected. Gefitinib has two basic functional groups (pKa 5.28, 7.17), and solubility increases drastically at lower pH 21. The appropriate mass of dry gefitinib was added to the liposomes, adjusted to pH 6.2, and incubated at 68°C for 1h with vigorous vortex mixing. After loading, the preparation was dialyzed against 500 mM sucrose/25 mM histidine, pH 6.2, and finally against two changes of TBS to restore physiological osmolality. The mixture was centrifuged at 7500g for 6 min to remove unincorporated drug precipitates, and the top 2/3 of the supernatant was recovered. In control experiments, free gefitinib in the absence of liposomes was processed identically to verify that the post-loading separation procedure removed unencapsulated drug from the preparations. Gefitinib and phospholipid concentrations were determined as described above.
Fluorescence analysis
Excitation and emission spectra were acquired for EGFR inhibitors prepared in various solvents using a spectrofluorometer (Photon Technology International, Inc., Birmingham, NJ). Spectra were recorded at 1 nm/sec. Excitation was 340 nm, the peak wavelength, or at 320 nm to reduce light scattering contributions. Drug concentrations were determined from fluorescence signal intensity by comparison to a standard curve of known concentration that was analyzed under identical solvent and matrix conditions. For stability measurements, liposome preparations were stored at 4°C under argon and analyzed for fluorescence on days 0, 3, 6, and 12 post-extrusion.
To investigate gefitinib interaction with serum proteins, a 10 mM stock solution of free drug in dimethylsulfoxide (DMSO) was diluted to specific concentrations in buffered saline containing 450 nM bovine serum albumin (BSA). Excitation/emission wavelengths of 265/337 nm were used to measure fluorescence quenching of tryptophan residues by gefitinib.
Fluorescence of protein-bound drug was quantified using excitation/emission wavelengths of 320/394 nm. In order to establish the fluorescence intensity corresponding to 100% leakage of liposomal gefitinib or 100% dissolution of crystalline gefitinib, a concentration of free drug equal to the final liposomal-or crystalline drug concentration was added to the serum-containing buffer from a concentrated stock solution dissolved in DMSO. Liposome leakage was investigated experimentally by adding gefitinib in either liposomal or crystalline form to a final concentration of 20 µM in TBS containing 10% newborn calf serum, a concentration that was within the linear range of fluorescence for the serum-bound drug. The amount of drug released in the serum-containing buffer was quantified by comparison to a standard curve, prepared by adding a range of known concentrations of gefitinib from a concentrated DMSO stock to the serum-containing buffer.
Microscopy
Liposome morphology and aggregation, and efficiency of post-loading procedures to remove unincorporated drug, were investigated by transmission electron microscopy (TEM). Liposomes were prepared as described above, and samples were taken for analysis at various steps in the procedure. Samples were diluted 1:100 in TBS, and 5 µL was adsorbed to freshly prepared Parlodion films on copper grids for 1–2 min. The liquid was wicked away and the grids were air-dried. Samples were stained by floating on a drop of 2% uranyl acetate for 1 min, wicked dry, and then air-dried. Samples were imaged using an Hitachi H500 TEM operating at 75 kV. Photographic negatives were scanned at 300 dpi and filtered in Photoshop (Adobe Systems, Inc., San Jose, CA) using an unsharpening mask of 3-pixel radius.
Cell culture
Rat 9L brain tumor cells were grown as spheroids in a neural stem cell (NSC) medium consisting of Dulbecco’s modified Eagle’s medium/Ham’s F-12 medium containing 20 ng/mL basic fibroblast growth factor (bFGF), 20 ng/mL epidermal growth factor (EGF), 50 ng/mL heparin, and B-27 nutrient supplement 22.
Confocal laser scanning microscopy
MCF7 human breast cancer cells or rat 9L gliosarcoma cell spheroids were imaged using a Zeiss Axiovert 200M inverted microscope (Carl Zeiss, Inc., Thornwood, NY) equipped with argon- and Chameleon Ultra II Ti/Sapphire lasers (Coherent, Inc., Santa Clara, CA). Gefitinib fluorescence was imaged using multi-photon excitation at 700 nm with 390–465 bandpass emission filters.
Results
Environment-dependent fluorescence of EGFR inhibitors
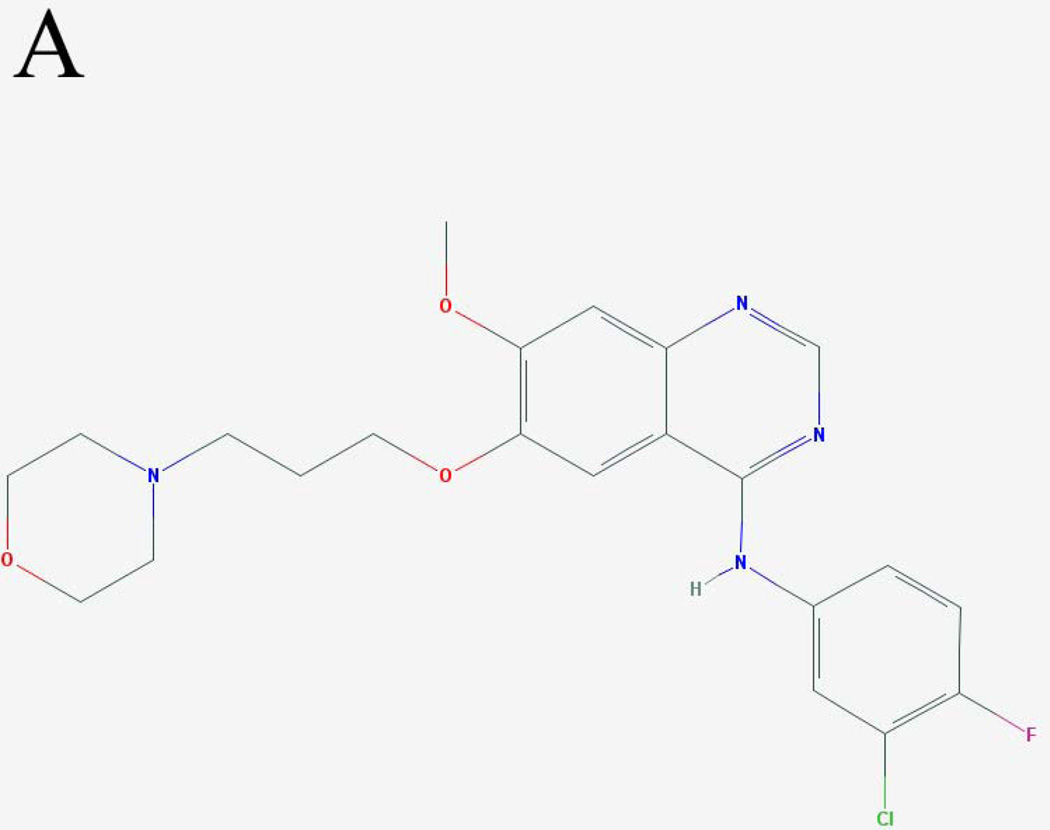
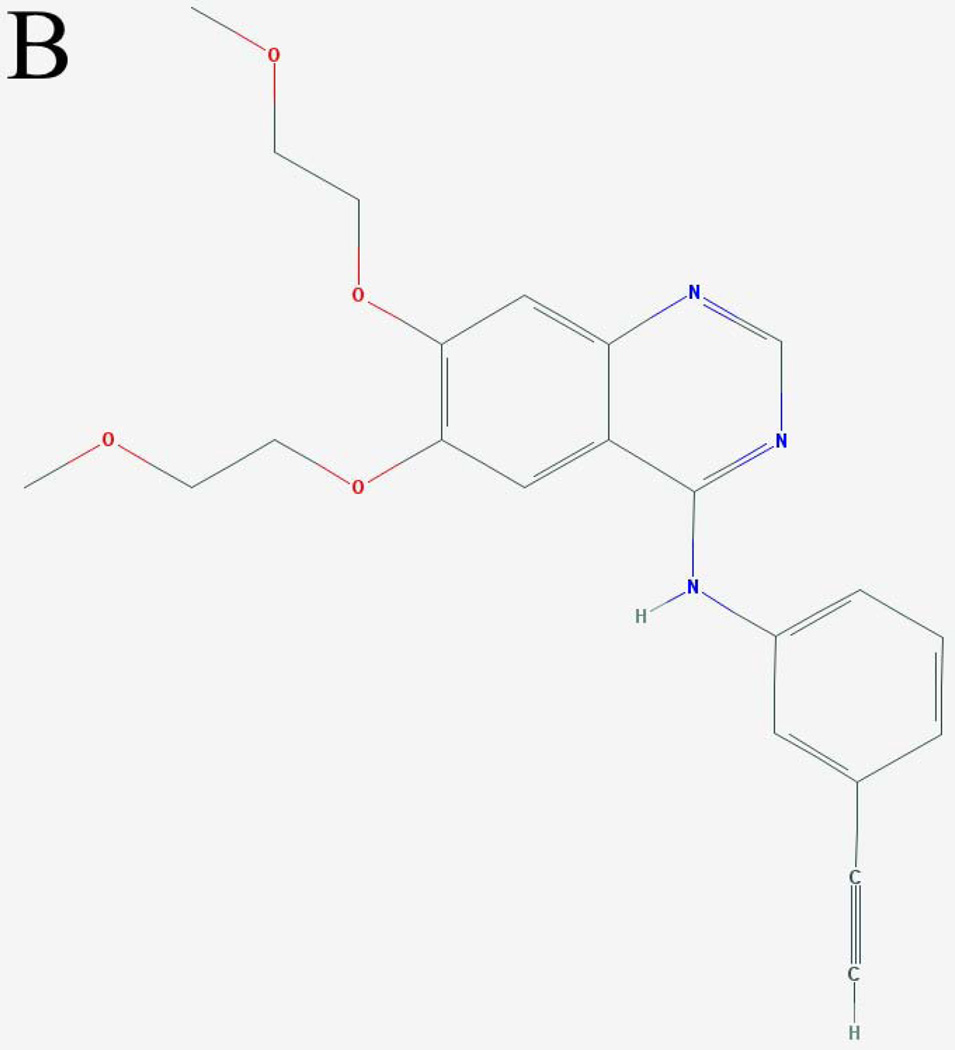
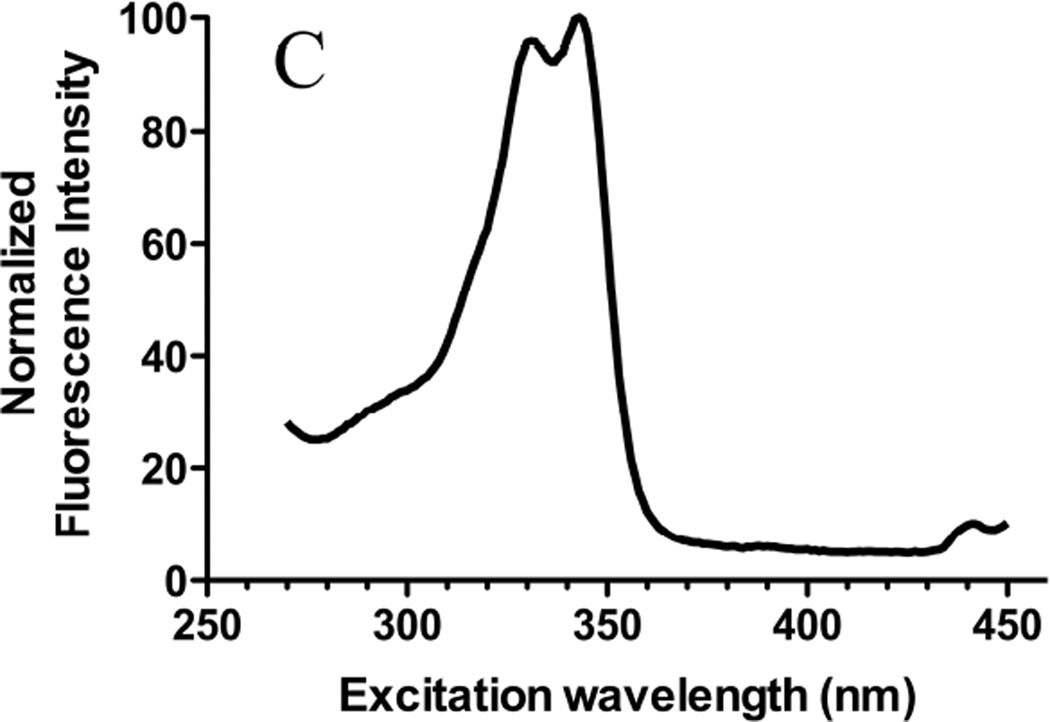
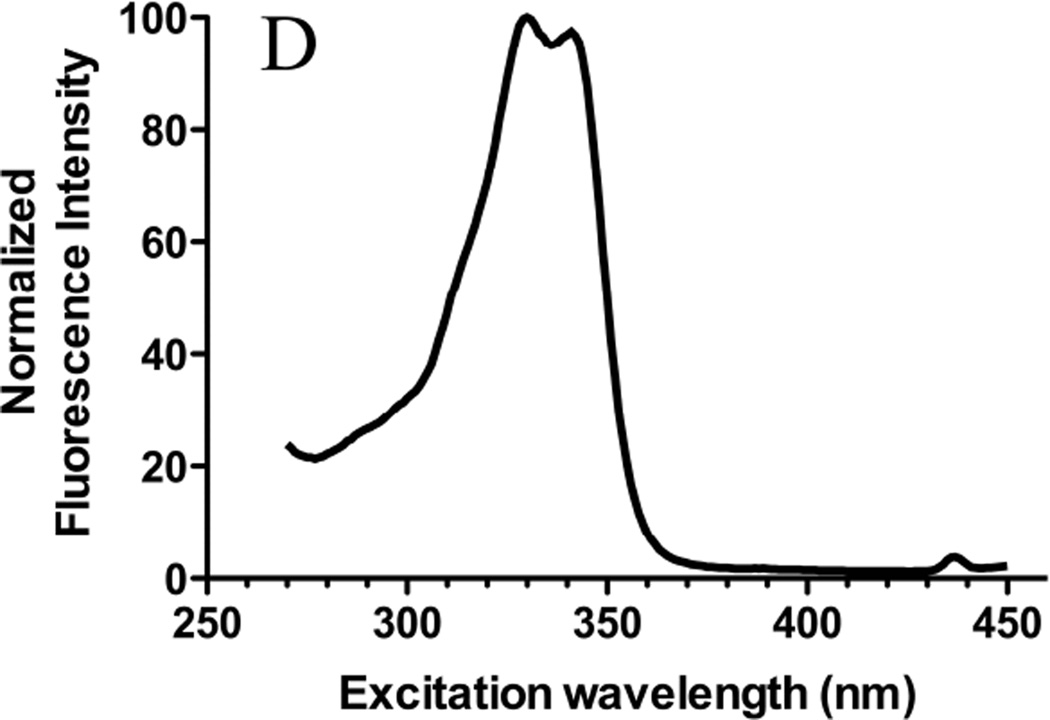
The spectral properties of the EGFR inhibitors were investigated to provide analytical approaches to support formulation development. Their extended conjugated ring systems and ionizable groups suggested that gefitinib (Fig. 1A) and erlotinib (Fig. 1B) should display environment-dependent fluorescence, which was observed experimentally (Fig. 1C, 1D; Fig. 2). Lapatinib, a third FDA-approved agent that inhibits both EGFR and Her2/neu (EGFR2) was also fluorescent (data not shown), suggesting that many structurally-similar RTK inhibitors are fluorescent.
Figure 1. Molecular structures and excitation spectra of gefitinib and erlotinib.
The molecular structures of (A) gefitinib (entry CID 123631) and (B) erlotinib (entry CID 176870) obtained from the PubChem compound database (http://www.ncbi.nlm.nih.gov/pccompound/). Normalized excitation spectra in n-hexanes of 15 µM (C) gefitinib and (D) erlotinib. Emission wavelength was 500 nm.
Figure 2. Solvent-dependent fluorescence emission spectra of gefitinib and erlotinib.
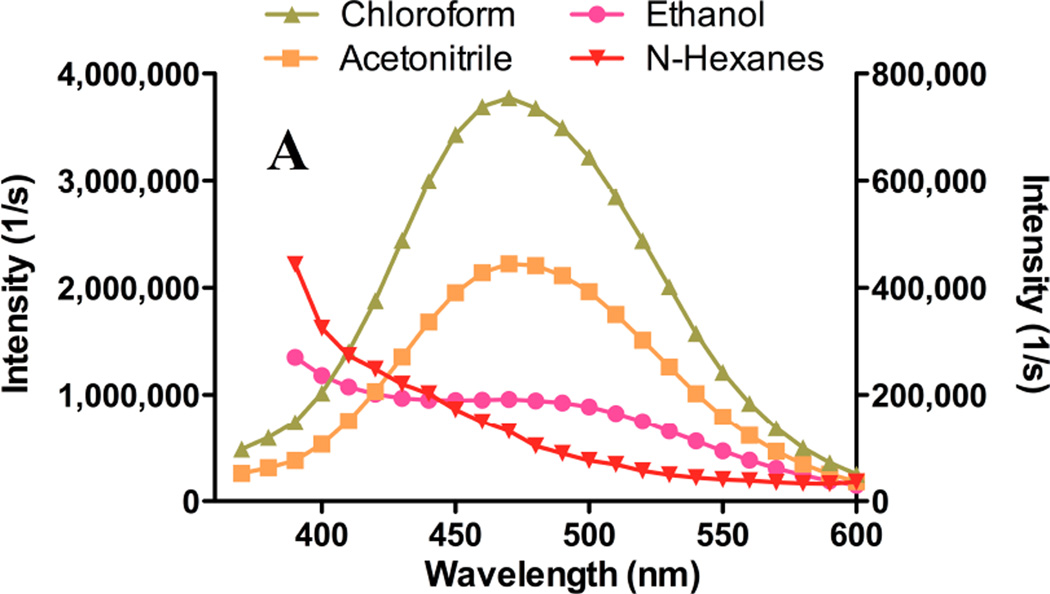
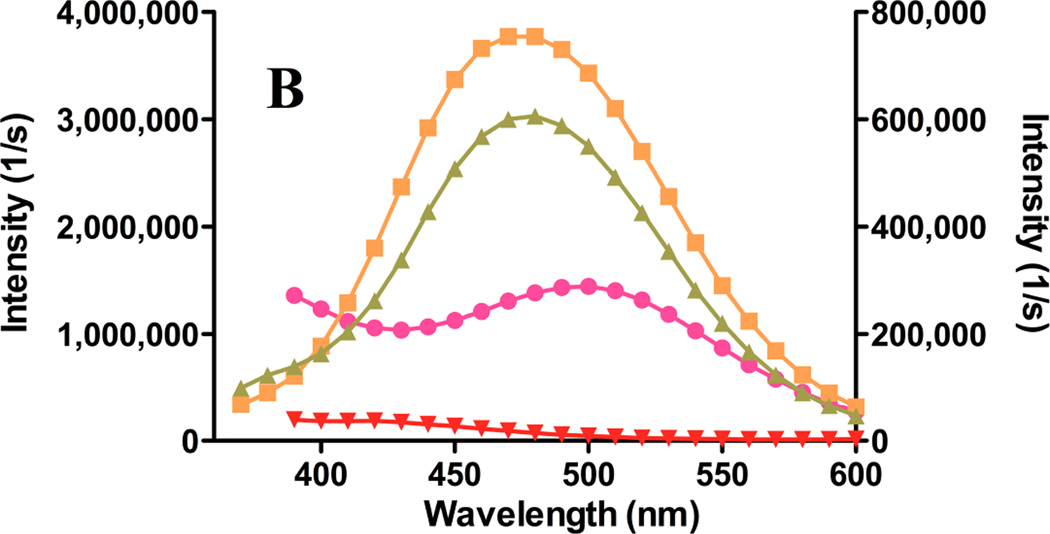
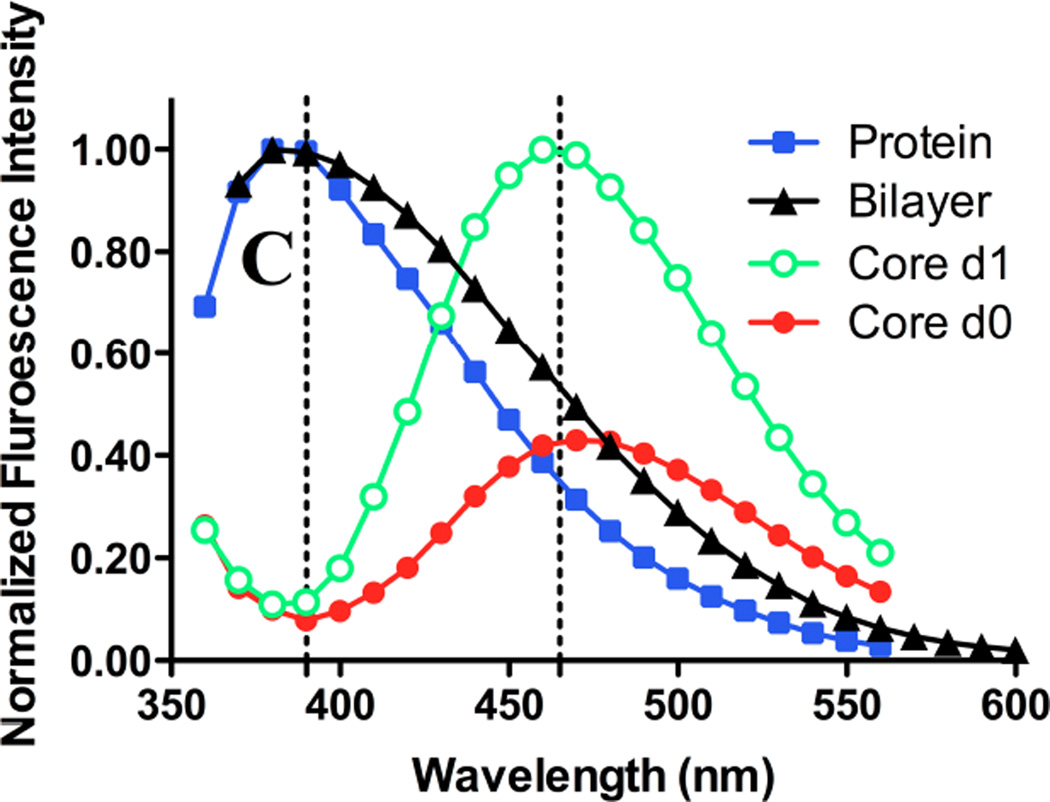
Gefitinib or erlotinib were suspended at 15 µM in a variety of solvents, and fluorescence emission spectra were acquired. Excitation was at 340 nm. Spectra are uncorrected for the concentration of drug in solution. (A) Spectra of gefitinib in chloroform (triangles) or acetonitrile (filled squares); left ordinate indicates intensity scale. Scale on right ordinate for gefitinib in ethanol (filled circles) or n-hexanes (inverted triangles) is expanded to demonstrate red- and blue shifts. No detectable emission peak was observed for gefitinib in Tris-buffered saline (not shown). (B) Emission spectra of erlotinib in various solvents; symbols, axis scales are the same as in (A). No detectable emission peak was observed for erlotinib in Tris-buffered saline. (C) Normalized emission spectra of gefitinib. Filled squares: 20 µM drug in Tris-buffered saline with 10% newborn calf serum; the peak was 390 nm. Filled triangles: spectrum of 15 µM gefitinib incorporated in bilayer of liposomes composed of DSPC:PEG-DSPE (9:1 mol:mol); peak was 380 nm. No emission was observed for blank liposomes (not shown). Filled circles: fluorescence of 15 µM gefitinib encapsulated in the liposome core by remote loading in DSPC:PEG-DSPE:Chol (9:1:5 mol:mol:mol) liposomes immediately after dilution into TBS or (open circles) 1d after incubation at 37°C in TBS; the emission peak was 460 nm. The day-1 spectrum (open cirles) was normalized to the emission peak. The day-0 spectrum (filled circles) is shown in its original intensity relative to the day-1 spectrum.
Excitation spectra were invariant (Fig. 1C, 1D) but emission spectra were highly environment-dependent. With equal quantities of drug added to various solvents, the highest fluorescence was observed in non-polar solvents such as chloroform (Fig. 2A). In low-dielectric solvents, the emission was blue-shifted and generally more intense than in polar solvents; the greatest blue shift was observed in n-hexane, which has the lowest dielectric constant of solvents investigated. The lower intensity of gefitinib in n-hexane compared to chloroform may result from intermolecular interactions or from lower solubility. In protic solvents such as ethanol, gefitinib fluorescence was weak and red-shifted.
Emission peak positions for erlotinib were similar to those of gefitinib, but maxima and relative intensities differed (Fig. 2B); fluorescence of erlotinib in chloroform was 25% lower than an equivalent concentration of gefitinib (Fig. 2A), whereas intensity of erlotinib in acetonitrile was highest. Weak fluorescence and a distinct red shift were noted in ethanol. Erlotinib, like gefitinib, was non-fluorescent in water (not shown).
Given the hydrophobicity of gefitinib and its elevated fluorescence in hydrophobic environments, fluorescence was investigated in the presence of lipid bilayer membranes and serum proteins such as albumin. The emission peak of albumin-bound drug was 384–394 nm, similar to that of drug partitioned into bilayer membranes (Fig. 2C).
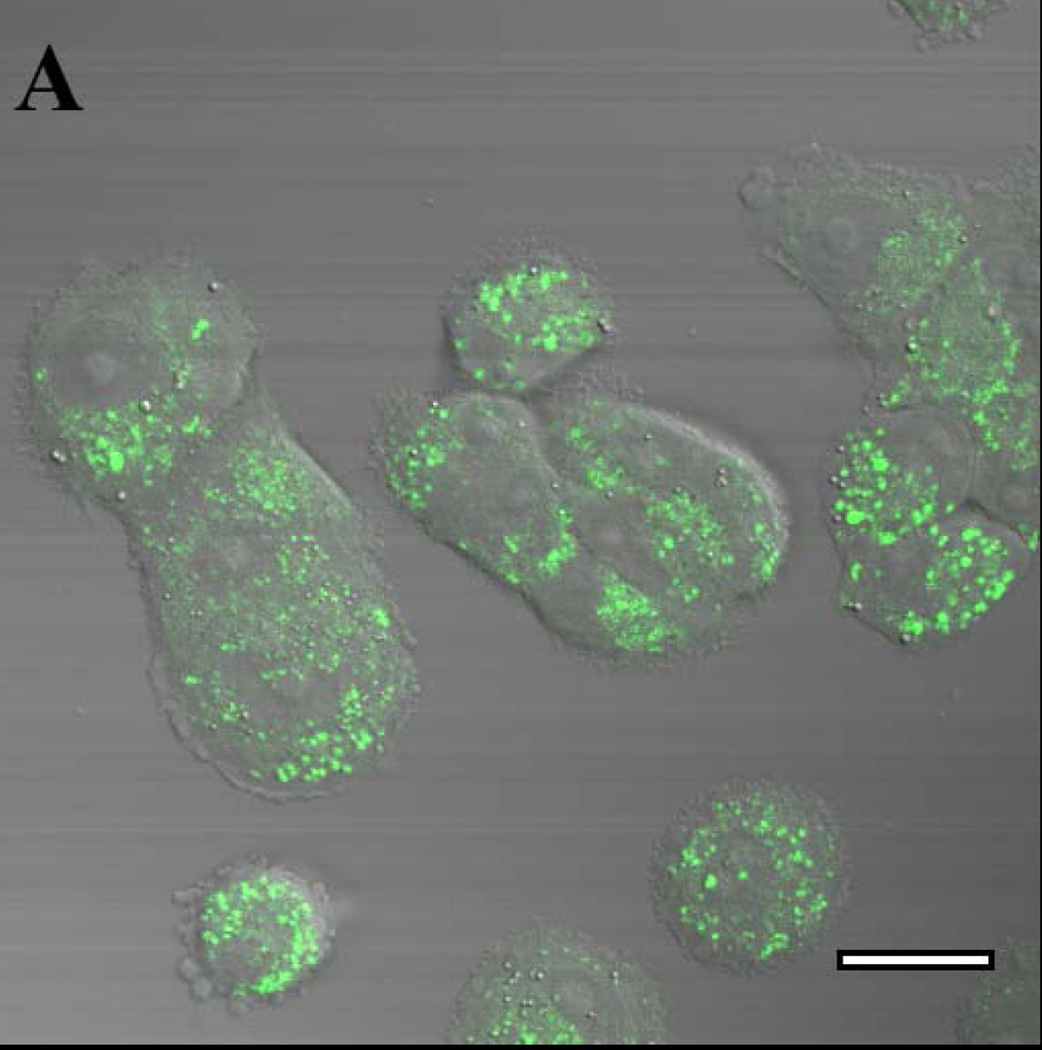
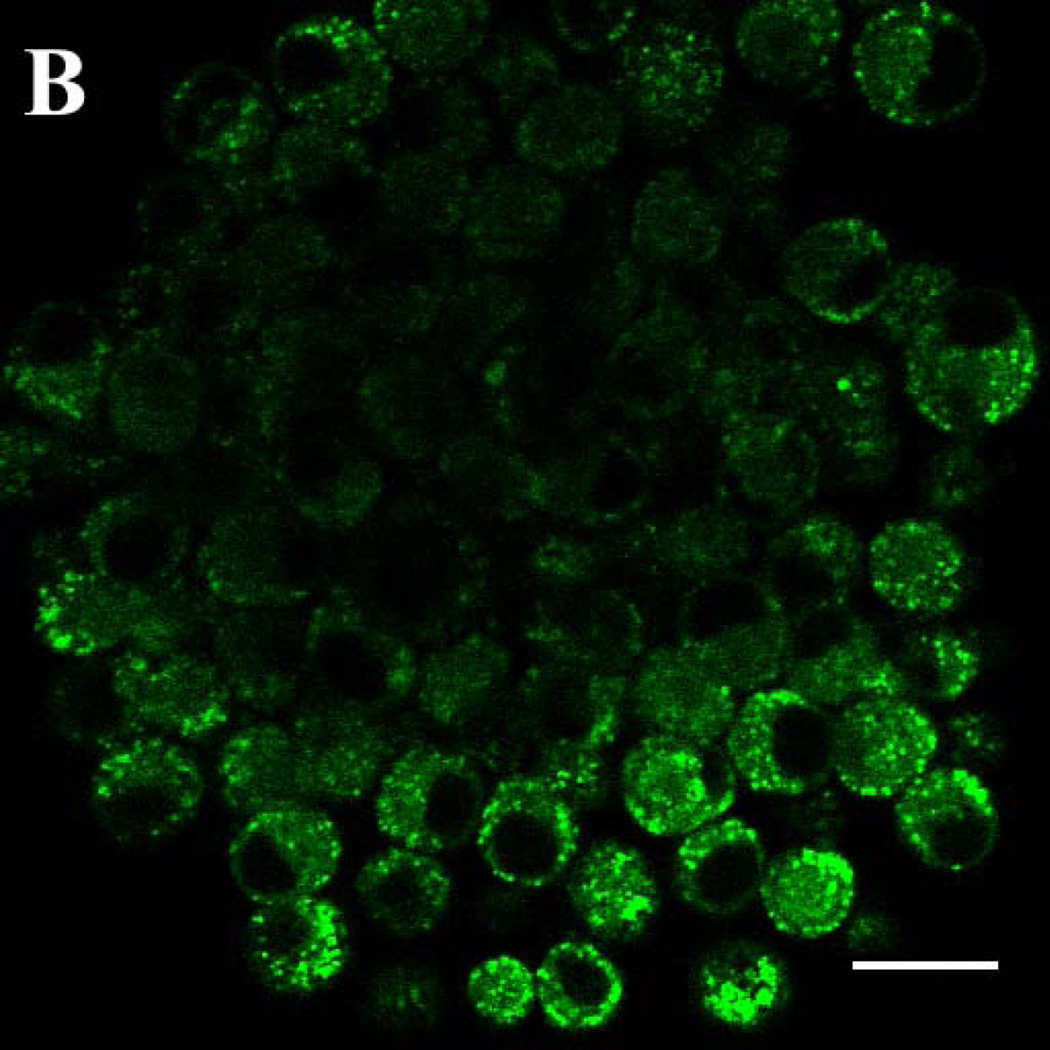
Fluorescence of the two RTK inhibitors was investigated in the complex physicochemical environment of cells. Multi-photon laser scanning confocal microscopy permitted excitation of gefitinib at 350 nm, near its excitation peak. MCF7 breast cancer cells incubated for 18h in 2 µM gefitinib showed intense, punctate intracellular fluorescence that was excluded from the nucleus and distributed in an intracellular pattern that is characteristic of fluorescent, lipophilic weak bases that accumulate in acidic cytoplasmic vesicles such as lysosomes or endosomes (Fig. 3A). Drug disposition was investigated in three-dimensional tumor spheroids, which have been employed as a model for tumor penetration 23,24. Spheroids of 9L brain tumor cells were incubated for 18h with 10 µM free gefitinib, the concentration mediating half-maximal inhibition of 9L cell growth by 50% (IC50) (data not shown). When spheroids were optically sectioned at their widest diameter, the outermost cells showed a punctate distribution of drug that was similar to the pattern in MCF7 monolayer cells. However, the drug was largely excluded from the center of the tumor spheroid (Fig. 3B), demonstrating that the intercellular contacts in 9L spheroids comprise a barrier to drug diffusion to the interior of the tumor cell mass. Erlotinib incubated with 9L spheroids and MCF7 monolayer cells showed similar patterns of distribution (not shown).
Figure 3. Drug accumulation in 9L tumor spheroids imaged by dual-photon excitation confocal microscopy.
Confocal laser scanning microscopy with multi-photon excitation was used to image cell-associated gefitinib, irradiating with a 700 nm laser line (350 nm excitation) and an emission band of 390–465 nm. (A) MCF7 human breast cancer cells incubated in monolayer culture for 18 h with 2 µM free gefitinib. (B) Spheroids of rat 9L brain tumor cells grown in a serum-free Neural Stem Cell medium supplemented with EGF and other components 22 and incubated for 18 h with 10 µM free gefitinib, which approximates its IC50. The images are false-colored to represent gefitinib as green. Bar: 20 micrometers.
Bilayer incorporation of gefitinib
Two strategies were pursued for gefitinib incorporation in liposomes. Given its estimated organic:aqueous partition coefficient (log P) of 4.85 15, gefitinib should partition readily into the liposome bilayer. This was verified in fluorescence studies when gefitinib was combined with phospholipids prior to hydration (Fig. 2A). Because the drug is non-fluorescent in water, the high fluorescence intensity in the presence of membranes confirms drug incorporation into nonpolar regions of the membrane. The membrane bilayer represents a sharp gradient of polarity 25,26, and the solvents included in Fig. 2 have been used to simulate membrane domains, such as the deep bilayer core and the water/hydrocarbon interfacial region. The emission peak of bilayer-incorporated gefitinib (Fig. 2C) was blue-shifted, analogous to the shift observed in n-hexane (Fig. 2A), but was much more intense, suggesting that the fluorophore resides in a non-polar environment in the vicinity of the bilayer core.
Bilayer fluidity and liposome size
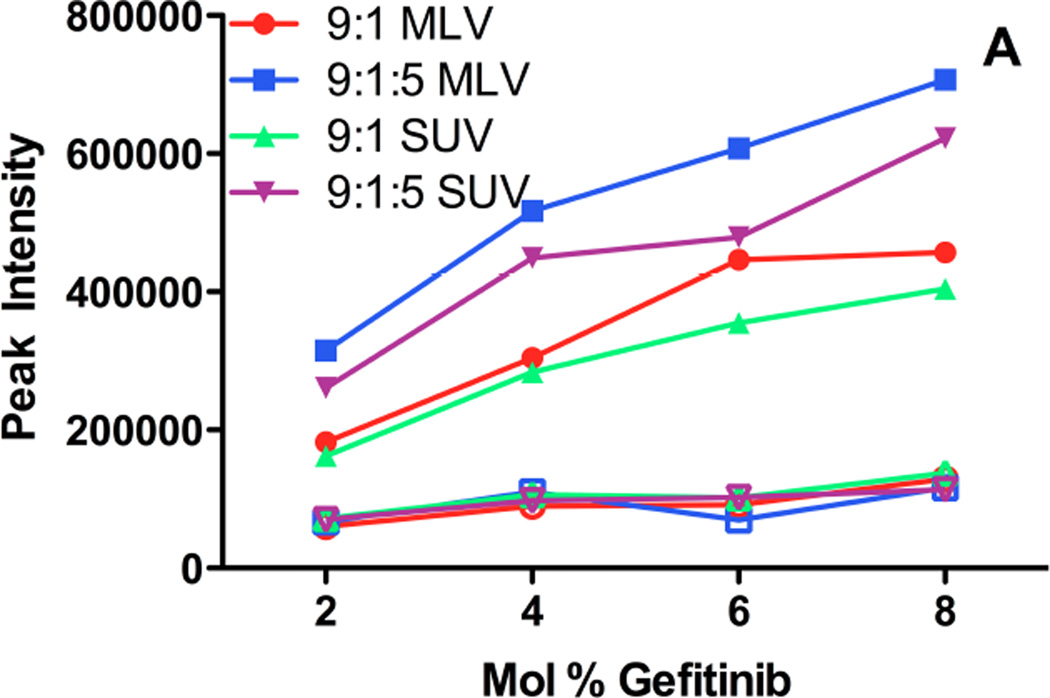
Gefitinib fluorescence properties were used to probe the effect of bilayer fluidity upon drug incorporation and the maximum membrane capacity to accommodate drug. Liposomes of varying size, composition, fluidity, and drug:lipid ratios were prepared. As the drug:lipid ratio was increased for fluid (low phase transition) liposomes of egg phosphatidylcholine (ePC):polyethylene glycol (PEG)-distereoylphosphatidylethanolamine (PEG-DSPE) (9:1 mol:mol), fluorescence intensity increased (Fig. 4A). For drug:lipid ratios above 2–4 mol%, florescence did not increase linearly with drug content, suggesting a limit of membrane capacity was reached. Extrusion of the large, multilamellar liposomes (MLV) to smaller liposomes (SUV) resulted in a modest decrease in fluorescence intensity for some formulations (Fig. 4A), suggesting that the gefitinib fluorescence signal intensity for MLV included some contribution from light scattering by the particles.
Figure 4. Fluorescence emission intensity as a function of gefitinib mole fraction added to liposomes of various composition.
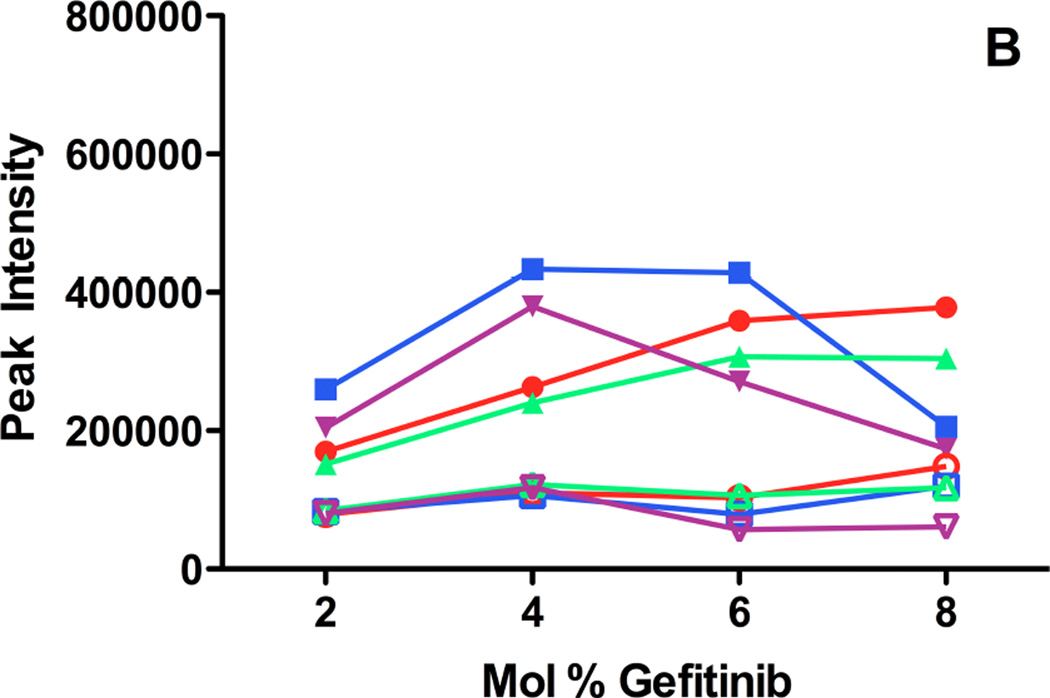
Fluid (low phase transition) or solid (high phase transition) liposomes, with or without 50 mol% cholesterol (9:1:5 mol:mol:mol), were prepared with varying mole fractions of gefitinib incorporated into the bilayer during liposome preparation (Methods). A portion of each MLV preparation was extruded through 80 nm polycarbonate filters to produce SUV. The fluorescence intensity was measured at the peak emission wavelength either immediately after preparation (A) or after 12 days of incubation at 4°C (B). The excitation wavelength was 320 nm to reduce light scattering contributions. (A) Fluorescence intensity of gefitinib in fluid (filled symbols) or solid (open symbols) liposome formulations as a function of the initial drug:lipid mole ratio, measured immediately after preparation. Filled circles: MLV of ePC:PEG-DSPE (9:1 mol:mol); filled squares: MLV of ePC:PEG-DSPE:Chol (9:1:5 mol:mol:mol); filled triangles: SUV of ePC:PEG-DSPE; filled inverted triangles: SUV of ePC:PEG-DSPE:Chol. Open circles: MLV of DSPC:PEG-DSPE (9:1 mol:mol); open squares: MLV of DSPC:PEG-DSPE:Chol (9:1:5 mol:mol:mol); open triangles: SUV of DSPC:PEG-DSPE; open inverted triangles: SUV of DSPC:PEG-DSPE:Chol. (B) Fluorescence intensity of gefitinib in fluid (filled symbols) or solid (open symbols) liposome formulations after 12 days of incubation at 4°C; symbols are the same as in (A). Light scattering contributed somewhat to the signal for formulations prepared with 8 mol% drug , which were highly aggregated.
Peak emission wavelength can reveal characteristics of the bilayer environment of the drug and was evaluated as a function of drug:lipid ratio. For all fluid liposome compositions, the peak emission wavelength varied less than 20 nm (not shown). A small red shift observed for some formulations at higher drug:lipid ratios suggested increased localization of drug in more polar domains of the membrane, or increased water penetration into the membrane because of phospholipid packing defects.
For all compositions and drug:lipid ratios for solid (high phase transition) lipids such as distearoylphosphatidylcholine (DSPC):PEG-DSPE (9:1 mol:mol), gefitinib fluorescence was much lower than for fluid liposomes of equivalent composition (Fig. 4A). The peak emission wavelength was progressively red-shifted as the drug:lipid ratio increased (not shown), and light microscopy revealed the formulations to be aggregated extensively. A combination of high light scattering, poor drug incorporation, and possibly entrapment of micro-precipitated drug within liposome aggregates may explain the apparent red spectral shift and very low fluorescence. Aggregation of liposomes was exacerbated in formulations containing surface-linked PEG; replacement of PEG-DSPE with an equivalent mol% of distearoylphosphatidylglycerol (DSPG), which preserves the electrostatic charge, resulted in formulations that were far less aggregated (not shown). Taken together, the data suggest that solid, PEG-containing liposomes, which should have the longest circulating lifetime in vivo, had the least capacity to incorporate gefitinib in the bilayer, and were prone to aggregation that renders them unsuitable for most in vivo applications.
Cholesterol content
Cholesterol reduces liposome permeability and increases stability in the presence of serum proteins 27. Addition of 50 mol% Chol to fluid liposomes (ePC:PEG-DSPE:Chol; 9:1:5 mol:mol:mol) resulted in higher gefitinib fluorescence at all drug:lipid ratios (Fig. 4A), suggesting improved membrane drug incorporation. Extrusion to SUV reduced fluorescence intensity somewhat, but the intensity of cholesterol-containing SUV was higher than for equivalent cholesterol-free SUV (Fig. 4A). The emission peak did not vary as increasing drug was added to cholesterol-containing fluid liposomes (not shown).
The addition of cholesterol to solid liposomes (DSPC:PEG-DSPE:Chol; 9:1:5 mol:mol:mol) reduced liposome aggregation but did not increase incorporation of gefitinib at any drug:lipid ratio (Fig. 4B). Whereas a red shift in the peak emission wavelength was observed for solid liposomes lacking cholesterol, no red-shift was observed for cholesterol-containing solid liposomes (not shown).
The apparent increase in gefitinib incorporation in fluid, cholesterol-containing liposomes prompted an investigation of potential drug:cholesterol molecular complexation, which might be exploitable to enhance formulation properties. However, 2- and 6-fold molar excesses of cholesterol were added to gefitinib in chloroform, and there was no effect upon gefitinib intensity or peak wavelength (not shown). Thus cholesterol-mediated effects on bilayer polarity 28,29, rather than molecular complexation, may be responsible for improved bilayer incorporation of gefitinib.
Stability of membrane-incorporation
Gefitinib incorporation for some fluid liposome compositions increased as drug:lipid ratios were increased to 8 mol%, but the formulations appeared to be physically unstable, so stability was investigated systematically. After 12 days of storage at 4°C, gefitinib fluorescence in fluid or solid liposomes was reduced for all formulations containing >4 mol% gefitinib (Fig. 4B). Controls ruled out chemical instability as the cause of reduced fluorescence. At any drug:lipid ratio, fluid liposomes showed considerably higher retention of drug fluorescence than solid liposomes. Although cholesterol-containing liposomes incorporated more drug initially (Fig. 4A), fluorescence was reduced after 6 days at 4°C (not shown). Over 12 days at 4°C, cholesterol-free fluid liposomes retained the highest fluorescence (Fig. 4B).
Lumen incorporation of gefitinib by remote loading
The fluorescence properties of gefitinib permitted rapid and systematic evaluation of numerous compositions in an effort to identify optimal formulations for bilayer incorporation. Although 4–6 mol% drug:lipid potentially would be useful for some applications, it was insufficient for those envisaged. Therefore, the second drug loading strategy investigated was ‘remote loading,’ which achieves efficient drug incorporation into pre-formed liposomes via an electrochemical gradient, in conjunction with a multivalent trapping ion of complementary charge within the liposome lumen 30–33. The majority of drugs loaded by this means are lipophilic weak bases 31,34, and where studied, drug appears to reside in the lumen in a highly stable, semi-crystalline state because of molecular complexation 33,35. Under the appropriate conditions, 95–100% of added drug can be encapsulated, and high drug:lipid ratios can be achieved (0.2–0.5 mol:mol). Variables governing the efficiency of drug loading include the nature of the complexing ion, the drug:lipid ratio, the magnitude of the electrochemical gradient, drug solubility, and the loading pH relative to the pKa of ionizable groups of the drug.
Optimal complexing ion
Multivalent anionic complexing agents, including citrate, sulfate, and others have been employed for remote loading 31,33,35–37. Based on preliminary experiments, sodium citrate and ammonium sulfate were compared head-to-head as trapping ions for gefitinib.
Solid, PEG-bearing liposomes (DSPC:PEG-DSPE:Chol; 9:1:5 mol:mol:mol) were chosen as the prototype composition, given their high stability and the covalent PEG coating that provides steric stabilization and long in vivo circulating half-life. The drug:lipid ratio was measured before and during the loading procedure, and after removal of unincorporated drug (Methods). Table 1 shows that for an initial drug:lipid ratio of approx. 0.2 mol:mol, the final drug:lipid ratio was considerably lower with citrate; only 75% of the drug added was encapsulated, and the final, encapsulated drug was significantly less (p<0.05) the amount of drug initially added. In contrast, encapsulation with ammonium sulfate was quantitative.
Table 1.
Selection of complexing ion for remote loading of gefitinib
| Complexing ion |
Gefitinib mM ±s.d. |
Phospholipid mM ±s.d. |
Drug:Lipid Ratio ±s.d. |
|||
|---|---|---|---|---|---|---|
| Initial† | Final | Initial | Final | Initial | Final | |
| Citrate | 2.21 ±0.23 | 0.87 ±0.02 | 10.50 ±0.30 | 5.55 ±0.67 | 0.21 ±0.03 | 0.16 ±0.02 * |
| Ammonium Sulfate | 2.12 ±0.24 | 1.08 ±0.26 | 11.39 ±0.34 | 5.69 ±0.12 | 0.19 ±0.02 | 0.19 ±0.04 |
| Tris/NaCl | 4.59 ±1.88 | 0.23 ±0.01 | 18.35 ±0.67 | 7.67 ±0.29 | 0.25 ±0.11 | 0.03 ±0.002 * |
| Free Drug | 1.51 ±0.78 | 0.25 ±0.01 | - | - | ||
s.d.: standard deviation
n=triplicate determinations for each sample
Decreased significantly from initial value (p<0.05)
Maximal drug loading ratio
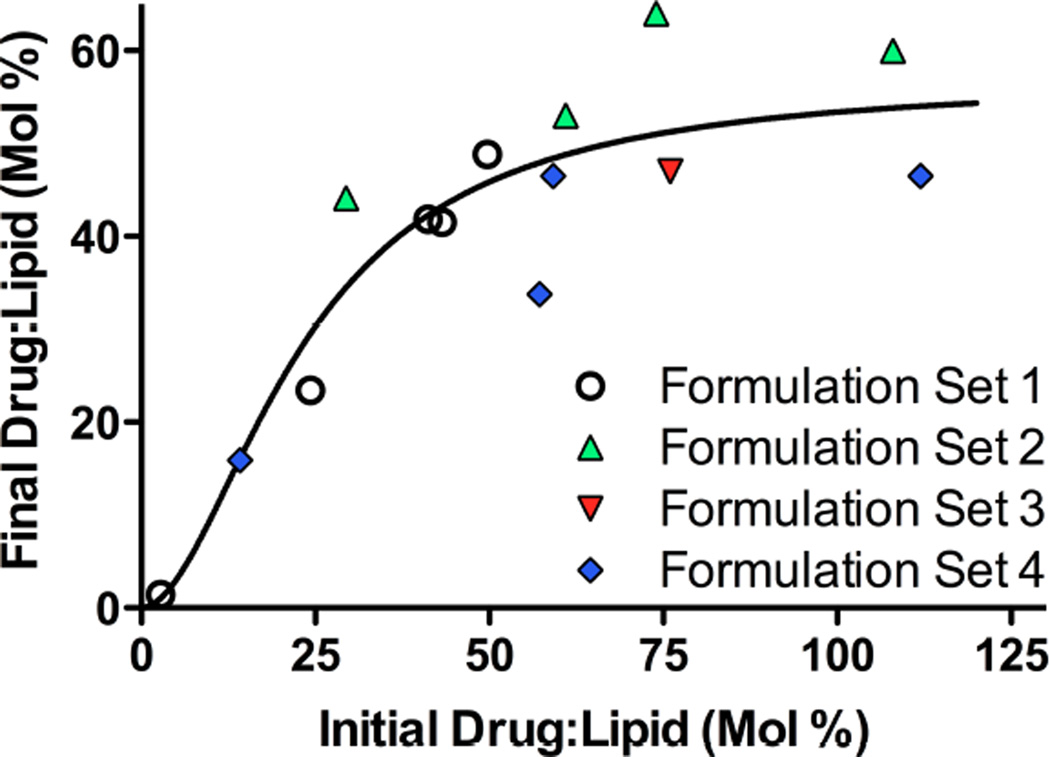
A wide range of drug:lipid ratios was investigated to establish the maximum loading capacity and efficiency of gefitinib loading with ammonium sulfate as the trapping ion. Fig. 5 shows the result of 4 independent sets of encapsulation experiments performed over 5 mos. The fraction of drug encapsulated in DSPC:PEG-DSPE:Chol (9:1:5 mol:mol:mol) liposomes increased proportionally with initial drug:lipid ratio, up to approx. 0.5–0.6 mol:mol gefitinib:lipid. Beyond that plateau, initial drug:lipid ratios as high as 1.30 did not yield significantly higher final drug:lipid ratios. Thus, initial drug:lipid ratios of 0.40–0.60 mol:mol provided an acceptable efficiency of encapsulation (75–100%) and drug loading.
Figure 5. Maximum capture of gefitinib in remote-loaded liposomes.
The efficiency, maximum capacity, and reproducibility of gefitinib encapsulation in DSPC:PEG-DSPE:Chol (9:1:5 mol:mol:mol) liposomes by remote loading was evaluated for 4 sets of formulations differing in initial drug:lipid ratio (0.20–1.30 mol:mol) that were prepared over a period of 5 mos. Ammonium sulfate was the intra-luminal trapping ion. After loading, free drug was removed by dialysis and brief centrifugation (6 min, 7500g) to ensure formulations were free of precipitated drug. Gefitinib was quantified based on absorbance values at 345 nm by comparison to a standard curve after dissolution of the liposomes in 1:1 (v/v) chloroform:methanol. Phospholipid concentrations were determined by inorganic phosphate assay after digestion in sulfuric acid 20. Symbols represent the final drug:lipid ratio achieved (ordinate) at different initial drug:lipid loading ratios (abscissa). The solid line shows fitting of the data using a Hill function (WinNonlin®, Pharsight Inc., St. Louis, MO). The curve fitting indicated that the liposome capacity for drug asymptotically approached a maximum of 57 mol% (drug:lipid), with a standard error of 9%.
Morphology of remote-loaded liposomes
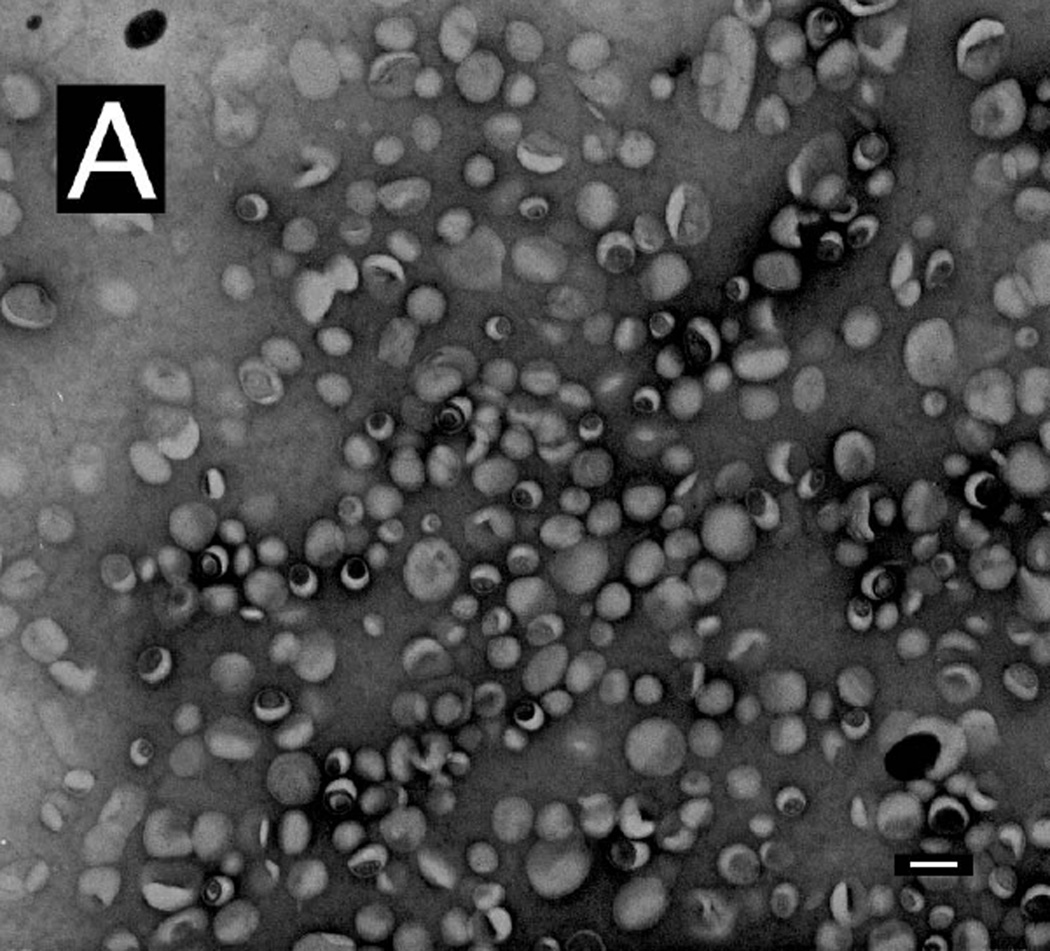
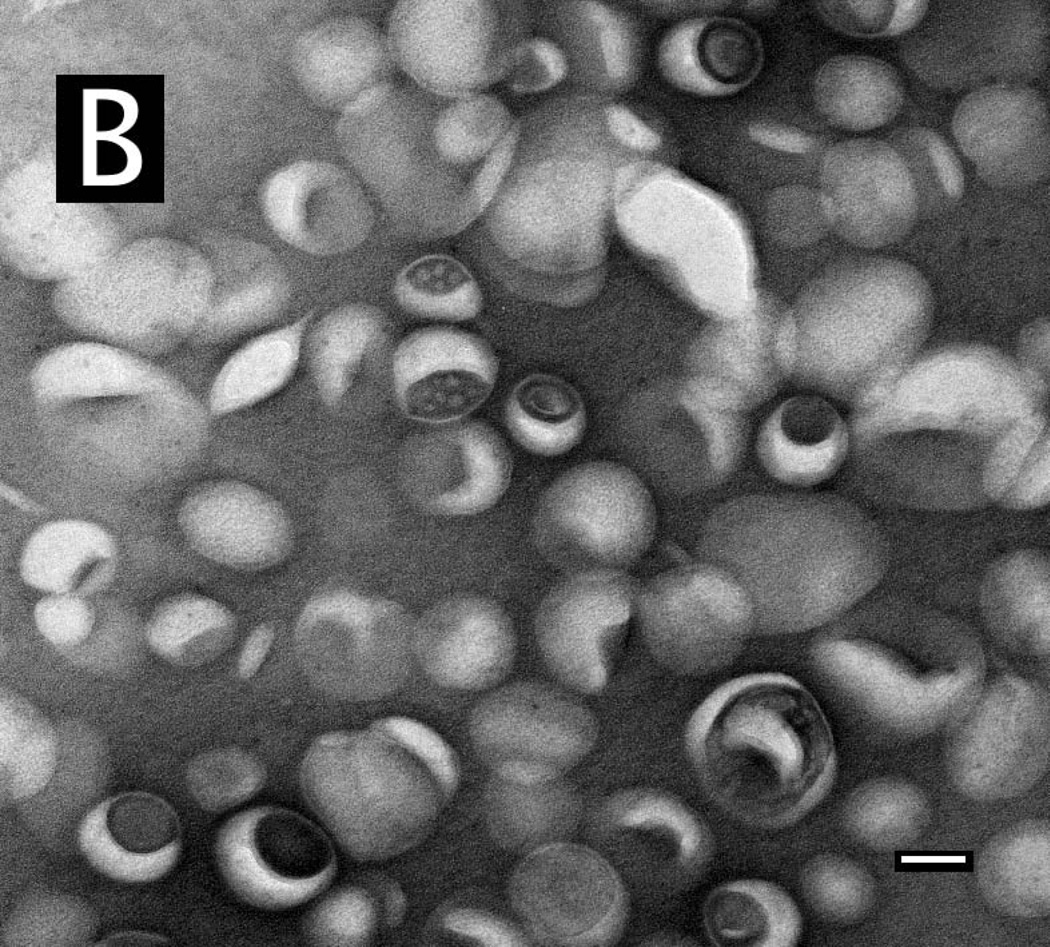
Negative-stain TEM was used to characterize the remote-loaded liposome preparations and to confirm that the process for removal of unencapsulated drug was effective. After post-loading dialysis alone (Methods), precipitates or crystals remained in some formulations (not shown). By adding a brief centrifugation step, only particles having a morphology characteristic of liposomes were observed (Fig. 6A). This finding was confirmed quantitatively; after dialysis alone, the drug:lipid ratio of the formulation in Fig. 6 was 1.30, whereas after centrifugation, the drug:lipid ratio was 0.60, consistent with the loading plateau value obtained with numerous independent loading experiments (Fig. 5). The particle size was relatively homogeneous (Fig. 6B), and particles had a dimpled appearance characteristic of negatively stained liposomes. Many particles appeared to have inclusions of electron-dense material.
Figure 6. Transmission electron microscopy of remote-loaded liposomes.
Remote-loaded liposomes of DSPC:PEG-DSPE:Chol (9:1:5 mol:mol:mol) were dialyzed and centrifuged for 6 min at 7500g. The final drug:lipid ratio was 0.60 mol:mol. Liposomes remaining in the supernatant were diluted in buffered saline and examined by TEM after negative staining in uranyl acetate. (A) Examination of multiple fields showed that the preparation was free of precipitated drug. Bar: 100 nm. (B) Higher-magnification image of the liposome formulation from panel (A), showing apparent electron-dense material associated with structures that appear to be liposomes. Bar: 50 nm.
Stability of remote-loaded gefitinib liposomes
Serum proteins can accelerate the leakage of liposome contents. However, quantification of hydrophobic drug leakage is highly challenging because of the difficulty in separating small liposomes from lipoproteins or other drug-binding plasma components. Therefore, three approaches were investigated to quantify retention of contents of remote-loaded gefitinib liposomes in serum.
First, gefitinib excitation overlaps tryptophan (Trp) emission. Gefitinib is 88%-94% bound to plasma proteins in human, dog, rabbit, rat, and mouse 38, so quenching of protein Trp fluorescence by resonance energy transfer (RET) with bound gefitinib was explored as a means to quantify drug release 39. Addition of free gefitinib to bovine serum albumin (BSA) quenched Trp fluorescence in a concentration-dependent fashion in the low µM range (not shown). Thus Trp quenching would be a feasible approach for quantifying drug leakage in the presence of serum.
Second, gefitinib is highly fluorescent when bound in hydrophobic domains of proteins (Fig. 2C); when known concentrations of drug were mixed with BSA or serum-containing buffer, gefitinib fluorescence was related linearly to drug concentration over approx. two orders of magnitude (not shown). Thus free (or liposome-released) gefitinib could be quantified based upon the fluorescence of serum-bound drug, provided the serum protein concentration remain in molar excess relative to the drug concentration.
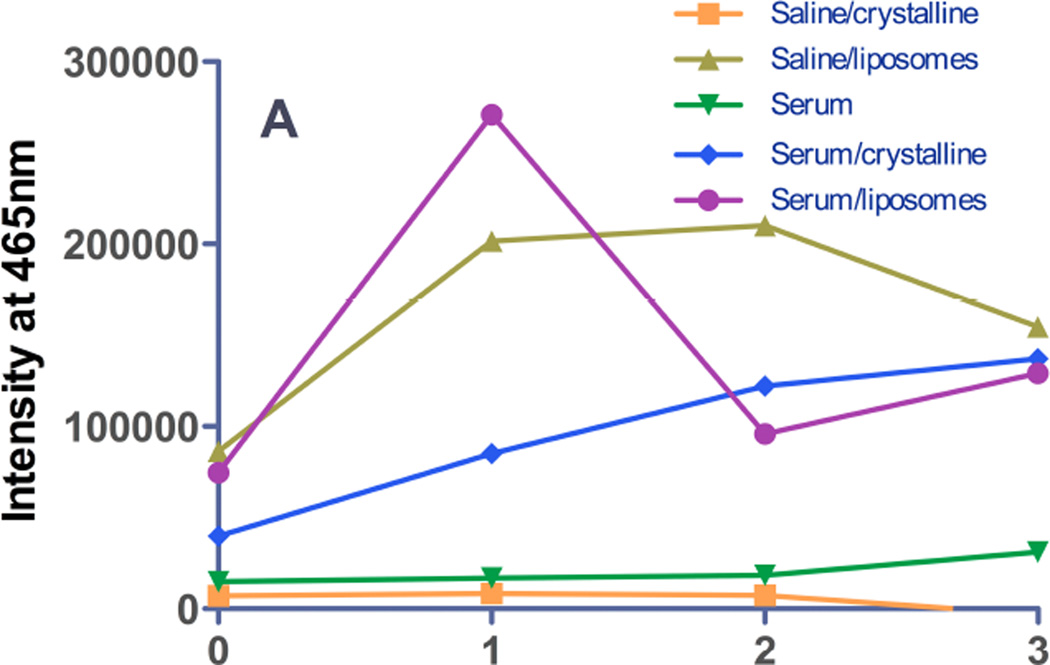
Third, the emission spectrum of gefitinib encapsulated in liposomes by remote loading was observed to undergo a drastic red shift (to 465–473 nm) compared to protein-bound- or membrane-localized drug (Fig. 2C), and in parallel, fluorescence was low in the emission band for protein- or membrane-bound drug (385–395 nm). This unique spectral signature of remote-loaded gefitinib therefore provides a potential window on events in the liposome aqueous core in the absence or presence of serum proteins. During incubation in TBS at 37°C, complex temporal changes were observed in the 465 nm band; intensity increased over the first 24h, remained constant from 24–48h (Fig. 2C, 7A), and then decreased somewhat at 72h. For liposomes incubated in TBS containing 10% serum, intensity of the 465 nm band increased rapidly over the first 24h and fell to baseline by 48h. The observed behavior was hypothesized to reflect an initial physicochemical change in the state of the semi-crystalline drug in the aqueous liposome core that was followed later by drug leakage, which would reduce fluorescence in the 465 nm band. The more rapid rise and decline in fluorescence for samples incubated in serum were interpreted to indicate more rapid leakage mediated by serum proteins.
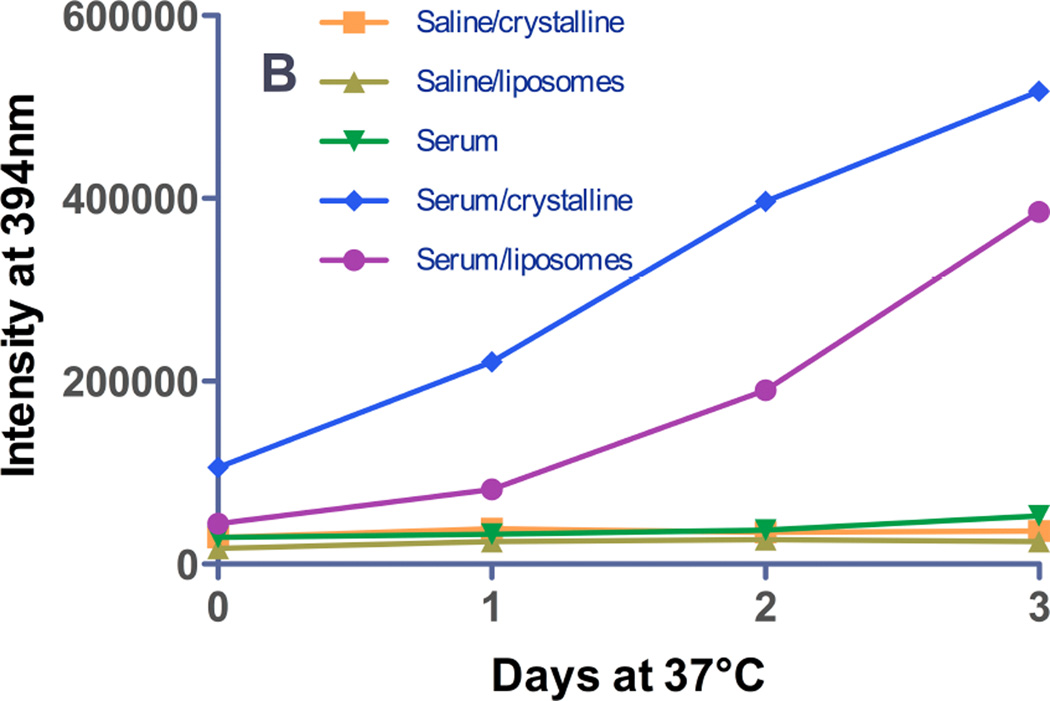
Figure 7. Release of gefitinib from remote-loaded liposomes.
Gefitinib fluorescence from remote-loaded liposomes of DSPC:PEG-DSPE:Chol (9:1:5 mol:mol:mol) during incubation 37°C in the presence or absence of serum was monitored at intervals over several days. The excitation wavelengths were 465 nm (A), a spectral band unique to drug precipitated in the liposome core, and 320 nm (B) the spectral band in which protein-bound drug fluoresces. On day 0, freshly-prepared liposomes were diluted to a final concentration of 20 µM in TBS or in TBS containing 10% newborn calf serum, and incubated at 37°C. An equivalent amount of free crystalline free drug was also incubated under the same conditions in order to estimate effect of drug dissolution rate on the rate of fluorescence signal change if 100% of the drug were present as a precipitate in the liposome formulations. (A) Gefitinib intensity at 465 nm, the peak wavelength characteristic of drug within the aqueous core of remote-loaded liposomes. Squares: crystalline free gefitinib in Tris-buffered saline; triangles: liposomal gefitinib in Tris-buffered saline; diamonds: crystalline gefitinib in serum-containing buffer; circles: liposomal gefitinib in serum-containing buffer; inverted triangles: serum-containing buffer without drug. The progressively increasing intensity from crystalline gefitinib in serum-containing buffer represents a spectral shoulder of the serum-bound drug emission peak at 394 nm, which was intense by day 2–3. (B) Gefitinib intensity at 394 nm, which is the peak wavelength of protein-bound drug. Symbols are the same as in (A). For experiments in which drug fluorescence was measured in serum-containing buffer, a standard curve consisting of known amounts of gefitinib added from a concentrated DMSO stock to the identical buffer was prepared, to ensure that fluorescence varied linearly with the concentration of released (free) gefitinib.
To test this hypothesis, a combination of the second and third approaches were employed: fluorescence was monitored simultaneously at 394 nm, the wavelength characteristic of protein-bound drug (Fig. 7B) and at 465 nm, the wavelength characteristic of semi-crystalline drug in the liposome core (Fig. 7A). In the absence of serum, leaked drug would be undetectable, and it was observed that fluorescence at 394 nm was low at all time points over 72h of incubation in TBS. In the presence of 10% serum, fluorescence at 394 nm was elevated slightly at 24h, and increased progressively at 48 and 72h. Notably, the fluorescence of serum-bound drug (394 nm band) at 24h was elevated only slightly compared to 0h (Fig. 7B), whereas intensity of encapsulated drug in the 465 nm band was maximal at 24h (Fig. 7A). This finding is consistent with the hypothesis that initial changes in the intensity of the 465 nm band reflect changes in the physicochemical state of remote-loaded drug within the liposome core that occur in the absence of significant drug leakage and therefore precede leakage.
Equivalent concentrations of crystalline free drug were investigated as a control to estimate the rate of dissolution of any residual, precipitated unencapsulated drug, or of ion-complexed drug cores if released intact from liposomes during incubation. Free gefitinib in buffer was non-fluorescent at 465 nm at all time points (Fig. 7A). In the presence of 10% serum, intensity of the 465 nm band of free crystalline drug was initially lower than for the equivalent concentration of drug in remote-loaded liposomes, but gradually increased in intensity. By 48–72h, the fluorescence of the liposome-encapsulated and free-drug samples was equal (Fig. 6A). However, full emission spectra were acquired (cf. Fig. 2C), and they revealed that elevation in the 465 nm band at 48–72h for the free drug samples (Fig. 7B) represented the shoulder of the very intense 394 nm fluorescence band of serum-bound drug, rather than a discrete band at 465 nm, as observed with remote-loaded liposomes (Fig. 2C).
For crystalline free drug added to serum-containing buffer, the 394 nm band (representing serum-bound drug) was low on day 0, although it was more intense than the equivalent concentration of drug in remote-loaded liposome (Fig. 7B). This finding confirmed that the remote-loaded liposome sample initially contained no free drug. The fluorescence of crystalline free drug in the serum-containing buffer rose steadily with time, and by 72h approached a maximum, suggesting the approximate time course for dissolution of crystalline drug in amounts equal to that encapsulated in liposomes.
Taken together, these fluorescence data suggested that upon initial incubation of remote-loaded liposomes in buffer at 37°C, a transition took place in the semi-crystalline drug core, observable in the 465 nm band, that was not accompanied by significant leakage (which would have been observed in the 394 nm band) for at least 24h. By 48h, leakage of serum-incubated liposomes had begun, given the increase in the 394 nm band that represents serum-bound drug. For remote-loaded liposomes incubated in buffer without serum, signal in the 394 nm band was low at all time points, but based on the persistence of the 465 nm band associated with remote-loaded drug in the liposome core, significant leakage had not yet occurred (Fig. 7A). The 465 nm peak eventually declined after 48h, likely because of drug leakage to a non-fluorescent state when serum was not present. Similar temporal changes were observed in the 465 nm band for liposomes incubated in the presence of serum, albeit following a more rapid time course (i.e., peaking at 24h before declining), and in serum-incubated samples, the decline in the 465 nm band was accompanied by elevation in the 394 nm band, thus clearly corresponding to drug leakage.
One consideration was whether the time course of fluorescence increase in the 394 nm band truly represented leakage of drug from remote-loaded liposomes in serum-containing buffer, or whether the semi-precipitated drug cores were ejected from liposomes, and the rate of signal change represented the rate of dissolution of the drug cores. We observed that free, crystalline gefitinib dissolved and became fluorescent under these conditions at a considerably more rapid rate than drug was released from remote loaded liposomes (Fig. 7B). Therefore, the fluorescence data confirms that there was neither residual free drug present in the liposome formulation after preparation, nor could delayed dissolution of drug released from liposomes in a precipitated state explain the observed temporal changes in the fluorescence intensity.
To provide a standard to determine the fraction of drug that was released from liposomes in the presence of serum, free gefitinib, dissolved in a DMSO stock solution, was added to serum-containing buffer to the same total concentration as present in liposome- and crystalline-drug samples, thereby permitting calibration of the drug release/dissolution rate data of Fig. 7. By comparison of fluorescence signal intensity to a standard curve of free gefitinib prepared in serum-containing buffer, at 24h, approx. 50% of the drug was released from remote-loaded liposomes in serum. By 72h, essentially 100% of drug was released (not shown).
Discussion
Although EGFR inhibitors are orally active and effective for some cancers, a lack of sufficient ‘addiction’ to EGFR pathway signaling, activating mutations in EGF signaling pathways, side effects, and off-target effects limit clinical efficacy. Our overall hypothesis is that drug delivery approaches could reduce drug deposition in critical normal tissues, increase tumor deposition, and provide sustained intra-tumor drug release. Carrier-mediated alteration in biodisposition could reduce GI toxicity by reducing free drug concentrations, and reduce accumulation in the skin, a site of significant clinical gefitinib toxicity 7. Furthermore, by reducing free drug concentrations in the blood, the severe myelotoxicity arising from drug combinations such as gefitinib and vinorelbine 13,14 might be lessened because of lower drug concentrations in bone marrow 12.
Because of their high cargo capacity and the existence of several clinically-approved products, nanoparticulate liposomal drug carriers were selected. Development of optimal liposome-based formulations required evaluation of a large range of parameters that determine performance in vivo, including size, charge, membrane fluidity, particle surface characteristics, and drug loading. For hydrophobic, weakly basic drugs such as the EGFR inhibitors, loading of both the membrane bilayer and the internal aqueous core was feasible; both strategies have yielded clinically-useful formulations of other drugs. Evaluation of the potentially large parameter space for carrier optimization was accelerated by the novel observation that gefitinib, erlotinib, and other EGFR inhibitors are not only fluorescent, but also the fluorescence is environment-sensitive. Gefitinib is not fluorescent in aqueous solutions, and therefore monitoring of drug loading into the membrane bilayer, where it fluoresces intensely, did not require separation of liposomes from unincorporated drug. Furthermore, spectral characteristics provided insight into the environment in which the drug was localized in the membrane bilayer as drug concentration and membrane composition were varied. Overall, the fluorescence properties of gefitinib enabled facile evaluation of liposome compositional effects upon drug encapsulation, investigation of drug interactions with serum proteins, and evaluation of drug release from the carrier in the presence of serum proteins. Preliminary data also suggest the possibility of evaluating intra-tumor drug disposition based upon fluorescence.
The solvent dependence of gefitinib fluorescence suggested superior incorporation of gefitinib by fluid bilayers, and revealed a maximum bilayer capacity to incorporate drug of only 4–6 mol%. Temporal changes in fluorescence intensity also informed as to stability of formulations during storage, and demonstrated that compositions providing the highest initial drug:lipid ratios displayed kinetically-delayed instability.
Given the low amount of gefitinib incorporated stably in the membrane bilayer, alternative encapsulation strategies were explored. Poor aqueous solubility precluded passive encapsulation of drug. Therefore, a remote-loading strategy was developed that selected the pH so as to provide sufficient drug solubility to permit loading, yet maintain the electrochemical gradient necessary for loading. High phase-transition lipids and a PEG surface coating were selected based on abundant work showing improved circulating half-life and retention of encapsulated contents at both 4°C and 37°C 40–42. The numerous key variables that determine the efficiency of drug incorporation, including drug:lipid ratio, nature of the multivalent trapping ion, drug solubility, loading pH, and liposome composition were expeditiously explored based upon the drug’s fluorescence properties. Poor gefitinib solubility presented a significant challenge to establishing sufficient external concentrations to permit loading. Solubility at pH 5 is approximately 60-fold higher than at pH 7.0 21; pH 6.2 was chosen for the loading pH as a compromise among higher aqueous solubility, acceptable chemical stability of the phospholipids, and maintenance of an electrochemical gradient to drive loading. Divalent anionic complexing agents inside the liposome, such as citrate and sulfate 33,35,37 were compared, and ammonium sulfate appeared to be superior for trapping gefitinib. The upper limit of drug incorporation was approx. 50–60 mol% gefitinib encapsulated at an efficiency of 75–100%. Transmission electron microscopy showed that many nanoparticles contained an electron-dense core, suggesting that the drug resided in a semi-precipitated state.
The spectral characteristics of gefitinib also permitted investigation of drug leakage and protein binding in serum-containing media, which is a significant challenge. Protein-associated gefitinib fluoresced at 385–395 nm, and a direct relationship was observed between the concentration of drug and the emission intensity in serum. It was observed that gefitinib could participate in resonance energy transfer with protein Trp residues, resulting in Trp fluorescence quenching and enhanced gefitinib (acceptor) fluorescence at 385–395 nm. RET analysis could potentially discriminate between bilayer-inserted drug and protein-bound drug. However, this approach was not necessary to achieve the experimental objectives; it was observed that gefitinib within the core of remote-loaded liposomes displays a unique spectral signature that is distinct from the emission peak of protein-bound- or membrane-inserted drug. Therefore, temporal changes in these two fluorescence bands provided insights into events leading to drug leakage in the presence and absence of serum. The release of drug from remote-loaded liposomes was low in serum-containing medium for the first 24h of incubation at 37°C and increased to nearly 100% over 72h. Thus formulation stability would be sufficient to achieve nanoparticle deposition in tumor prior to leakage of liposome contents. Simultaneous comparison of dual fluorescence bands provided the insight that over the first 24h of incubation at 37°C in saline, spectral changes in the 465 nm band suggested alterations in the physical state of gefitinib occurred within in the liposome core prior to efflux. Drug within remote-loaded liposomes reportedly can exist in a gelled or semi-crystalline state 33,35, and the observed spectral changes could result from hydration of the drug core, a change in intra-liposomal pH during incubation, or dissolution of the drug. The eventual decrease in the 465 nm fluorescence band resulted from drug leakage, because the intensity of serum-bound drug (394 nm band) underwent an increase in parallel. Overall, it appeared that similar processes were occurring in the liposome core during incubation in the presence or absence of serum, but that the process was accelerated by leakage induced by serum proteins.
In conclusion, a liposome formulation was developed that contains a high payload of the EGFR inhibitor gefitinib. Remote-loading of erlotinib was also feasible (not shown), and suggests that many RTK inhibitors may be encapsulated by this approach, given their structural and physicochemical similarities. The amount of gefitinib incorporated per mole of phospholipid carrier was high enough to suggest the feasibility to achieve therapeutic levels in humans. The PEG-coated nanoparticulate carrier would be expected to have higher tumor:skin and tumor:bone marrow deposition ratios, and thus could reduce toxicity alone or in combination with other cytotoxic anticancer agents. Finally, the fluorescence properties of gefitinib, which are shared by the clinically-approved EGFR inhibitor erlotinib (Fig. 1B, 2B), not only can be exploited for developing and analyzing the properties of liposomal formulations containing EGFR inhibitors, but also enable the investigation of drug deposition in cells and tissues. Given the structural similarities among diverse RTK inhibitors, fluorescence may be a widely-useful tool to study biophysical behavior as well as biodistributional and intracellular disposition. Overall, the formulations developed and tools to analyze them thus mutually support each other as a means to improve the efficacy of therapies based upon this and potentially other RTK inhibitors.
Acknowledgements
We thank A. Siegel for performing the negative-stained TEM, and Dr. W. Sigurdsen for assistance with the confocal fluorescence microscopy. Partial support for the work was from National Institutes of Health (NIH) grant CA107570 to RMS, and a Mark Diamond Research grant to BJT from the University at Buffalo, State University of New York. BJT received the Paul Calabresi Medical Student Research Fellowship from the Pharmaceutical Research and Manufacturers of America Foundation, and fellowship support from the Roswell Park Cancer Inst. The spectrofluorometer was obtained with Shared Instrumentation grant S10RR015877 from the National Center for Research Resources, NIH.
Abbreviations
- BSA
Bovine serum albumin
- Chol
Cholesterol
- DMSO
Dimethylsulfoxide
- DSPC
Distearoylphosphatidylcholine
- DSPG
Distearoylphosphatidylglycerol
- EGF
Epidermal growth factor
- EGFR
Epidermal growth factor receptor
- ePC
Egg phosphatidylcholine
- EPR
Enhanced permeability and retention phenomenon
- MAPK
Mitogen-activated protein kinase
- MDR
Multi-drug resistance
- MLV
Multilamellar vesicle
- PEG-DSPE
distereoylphosphatidylethanolamine covalently linked to 2000 KDa polyethylene glycol
- RET
Resonance energy transfer
- RTK
Receptor tyrosine kinase
- SUV
Small unilamellar vesicle
- TEM
Transmission electron microscopy
- Trp
Tryptophan
References
- 1.Rocha-Lima CM, Soares HP, Raez LE, Singal R. EGFR targeting of solid tumors. Cancer Control. 2007;14(3):295–304. doi: 10.1177/107327480701400313. [DOI] [PubMed] [Google Scholar]
- 2.Wakeling AE, Guy SP, Woodburn JR, Ashton SE, Curry BJ, Barker AJ, Gibson KH. ZD1839 (Iressa): an orally active inhibitor of epidermal growth factor signaling with potential for cancer therapy. Cancer Res. 2002;62(20):5749–5754. [PubMed] [Google Scholar]
- 3.Paez JG, Janne PA, Lee JC, Tracy S, Greulich H, Gabriel S, Herman P, Kaye FJ, Lindeman N, Boggon TJ, Naoki K, Sasaki H, Fujii Y, Eck MJ, Sellers WR, Johnson BE, Meyerson M. EGFR mutations in lung cancer: correlation with clinical response to gefitinib therapy. Science. 2004;304(5676):1497–1500. doi: 10.1126/science.1099314. [DOI] [PubMed] [Google Scholar]
- 4.Lynch TJ, Bell DW, Sordella R, Gurubhagavatula S, Okimoto RA, Brannigan BW, Harris PL, Haserlat SM, Supko JG, Haluska FG, Louis DN, Christiani DC, Settleman J, Haber DA. Activating mutations in the epidermal growth factor receptor underlying responsiveness of non-small-cell lung cancer to gefitinib. N Engl J Med. 2004;350(21):2129–2139. doi: 10.1056/NEJMoa040938. [DOI] [PubMed] [Google Scholar]
- 5.Guo A, Villen J, Kornhauser J, Lee KA, Stokes MP, Rikova K, Possemato A, Nardone J, Innocenti G, Wetzel R, Wang Y, MacNeill J, Mitchell J, Gygi SP, Rush J, Polakiewicz RD, Comb MJ. Signaling networks assembled by oncogenic EGFR and c-Met. Proc Natl Acad Sci U S A. 2008;105(2):692–697. doi: 10.1073/pnas.0707270105. [DOI] [PMC free article] [PubMed] [Google Scholar]
- 6.Kim ES, Hirsh V, Mok T, Socinski MA, Gervais R, Wu YL, Li LY, Watkins CL, Sellers MV, Lowe ES, Sun Y, Liao ML, Osterlind K, Reck M, Armour AA, Shepherd FA, Lippman SM, Douillard JY. Gefitinib versus docetaxel in previously treated non-small-cell lung cancer (INTEREST): a randomised phase III trial. Lancet. 2008;372(9652):1809–1818. doi: 10.1016/S0140-6736(08)61758-4. [DOI] [PubMed] [Google Scholar]
- 7.Albanell J, Rojo F, Averbuch S, Feyereislova A, Mascaro JM, Herbst R, LoRusso P, Rischin D, Sauleda S, Gee J, Nicholson RI, Baselga J. Pharmacodynamic studies of the epidermal growth factor receptor inhibitor ZD1839 in skin from cancer patients: histopathologic and molecular consequences of receptor inhibition. J Clin Oncol. 2002;20(1):110–124. doi: 10.1200/JCO.2002.20.1.110. [DOI] [PubMed] [Google Scholar]
- 8.Zhuang Y, Fraga CH, Hubbard KE, Hagedorn N, Panetta JC, Waters CM, Stewart CF. Topotecan central nervous system penetration is altered by a tyrosine kinase inhibitor. Cancer Res. 2006;66(23):11305–11313. doi: 10.1158/0008-5472.CAN-06-0929. [DOI] [PubMed] [Google Scholar]
- 9.Higgins CF. Multiple molecular mechanisms for multidrug resistance transporters. Nature. 2007;446(7137):749–757. doi: 10.1038/nature05630. [DOI] [PubMed] [Google Scholar]
- 10.Swaisland HC, Smith RP, Laight A, Kerr DJ, Ranson M, Wilder-Smith CH, Duvauchelle T. Single-dose clinical pharmacokinetic studies of gefitinib. Clin Pharmacokinet. 2005;44(11):1165–1177. doi: 10.2165/00003088-200544110-00004. [DOI] [PubMed] [Google Scholar]
- 11.Polli JW, Humphreys JE, Harmon KA, Castellino S, O'Mara MJ, Olson KL, John-Williams LS, Koch KM, Serabjit-Singh CJ. The role of efflux and uptake transporters in [N-{3-chloro-4-[(3-fluorobenzyl)oxy]phenyl}-6-[5-({[2-(methylsulfonyl)ethy l]amino}methyl)-2-furyl]-4-quinazolinamine (GW572016, lapatinib) disposition and drug interactions. Drug Metab Dispos. 2008;36(4):695–701. doi: 10.1124/dmd.107.018374. [DOI] [PubMed] [Google Scholar]
- 12.Cui J, Li C, Guo W, Li Y, Wang C, Zhang L, Zhang L, Hao Y, Wang Y. Direct comparison of two pegylated liposomal doxorubicin formulations: is AUC predictive for toxicity and efficacy? J Control Release. 2007;118(2):204–215. doi: 10.1016/j.jconrel.2006.12.002. [DOI] [PubMed] [Google Scholar]
- 13.Yoshimura M, Nakamura S, Imamura F, Ueno K, Yamamoto S, Igarashi T. Severe myelotoxicity in a combination of gefitinib and vinorelbine. Lung Cancer. 2004;45(1):121–123. doi: 10.1016/j.lungcan.2004.01.006. [DOI] [PubMed] [Google Scholar]
- 14.Sirotnak FM, Zakowski MF, Miller VA, Scher HI, Kris MG. Efficacy of cytotoxic agents against human tumor xenografts is markedly enhanced by coadministration of ZD1839 (Iressa), an inhibitor of EGFR tyrosine kinase. Clin Cancer Res. 2000;6(12):4885–4892. [PubMed] [Google Scholar]
- 15.McKillop D, Partridge EA, Kemp JV, Spence MP, Kendrew J, Barnett S, Wood PG, Giles PB, Patterson AB, Bichat F, Guilbaud N, Stephens TC. Tumor penetration of gefitinib (Iressa), an epidermal growth factor receptor tyrosine kinase inhibitor. Mol Cancer Ther. 2005;4(4):641–649. doi: 10.1158/1535-7163.MCT-04-0329. [DOI] [PubMed] [Google Scholar]
- 16.Charrois GJ, Allen TM. Rate of biodistribution of STEALTH liposomes to tumor and skin: influence of liposome diameter and implications for toxicity and therapeutic activity. Biochim Biophys Acta. 2003;1609(1):102–108. doi: 10.1016/s0005-2736(02)00661-2. [DOI] [PubMed] [Google Scholar]
- 17.Matsumura Y, Maeda H. A new concept for macromolecular therapeutics in cancer chemotherapy: mechanism of tumoritropic accumulation of proteins and the antitumor agent smancs. Cancer Res. 1986;46(12 Pt 1):6387–6392. [PubMed] [Google Scholar]
- 18.Maeda H, Wu J, Sawa T, Matsumura Y, Hori K. Tumor vascular permeability and the EPR effect in macromolecular therapeutics: a review. J Control Release. 2000;65(1–2):271–284. doi: 10.1016/s0168-3659(99)00248-5. [DOI] [PubMed] [Google Scholar]
- 19.Dreher MR, Liu W, Michelich CR, Dewhirst MW, Yuan F, Chilkoti A. Tumor vascular permeability, accumulation, and penetration of macromolecular drug carriers. J Natl Cancer Inst. 2006;98(5):335–344. doi: 10.1093/jnci/djj070. [DOI] [PubMed] [Google Scholar]
- 20.Bartlett GR. Phosphorus assay in column chromatography. J Biol Chem. 1959;234:466–468. [PubMed] [Google Scholar]
- 21.Bergman E, Forsell P, Persson EM, Knutson L, Dickinson P, Smith R, Swaisland H, Farmer MR, Cantarini MV, Lennernas H. Pharmacokinetics of gefitinib in humans: the influence of gastrointestinal factors. Int J Pharm. 2007;341(1–2):134–142. doi: 10.1016/j.ijpharm.2007.04.002. [DOI] [PubMed] [Google Scholar]
- 22.Ghods AJ, Irvin D, Liu G, Yuan X, Abdulkadir IR, Tunici P, Konda B, Wachsmann-Hogiu S, Black KL, Yu JS. Spheres isolated from 9L gliosarcoma rat cell line possess chemoresistant and aggressive cancer stem-like cells. Stem Cells. 2007;25(7):1645–1653. doi: 10.1634/stemcells.2006-0624. [DOI] [PubMed] [Google Scholar]
- 23.Minchinton AI, Tannock IF. Drug penetration in solid tumours. Nature reviews Cancer. 2006;6(8):583–592. doi: 10.1038/nrc1893. [DOI] [PubMed] [Google Scholar]
- 24.Tredan O, Galmarini CM, Patel K, Tannock IF. Drug resistance and the solid tumor microenvironment. J Natl Cancer Inst. 2007;99(19):1441–1454. doi: 10.1093/jnci/djm135. [DOI] [PubMed] [Google Scholar]
- 25.White SH, Wimley WC. Hydrophobic interactions of peptides with membrane interfaces. Biochim Biophys Acta. 1998;1376(3):339–352. doi: 10.1016/s0304-4157(98)00021-5. [DOI] [PubMed] [Google Scholar]
- 26.Wiener MC, White SH. Structure of a fluid dioleoylphosphatidylcholine bilayer determined by joint refinement of x-ray and neutron diffraction data. III. Complete structure. Biophys J. 1992;61(2):434–447. doi: 10.1016/S0006-3495(92)81849-0. [DOI] [PMC free article] [PubMed] [Google Scholar]
- 27.Drummond DC, Meyer O, Hong K, Kirpotin DB, Papahadjopoulos D. Optimizing liposomes for delivery of chemotherapeutic agents to solid tumors. Pharmacological Reviews. 1999;51(4):691–743. [PubMed] [Google Scholar]
- 28.Huang J, Feigenson GW. A microscopic interaction model of maximum solubility of cholesterol in lipid bilayers. Bioph J. 1999;76(4):2142–2157. doi: 10.1016/S0006-3495(99)77369-8. [DOI] [PMC free article] [PubMed] [Google Scholar]
- 29.Parasassi T, Di Stefeno M, Loiero M, Ravagnan G, Gratton E. Influence of cholesterol on phospholipid bilayers phase domains as detected by Laurdan fluorescence. Biophys J. 1994;66:120–132. doi: 10.1016/S0006-3495(94)80763-5. [DOI] [PMC free article] [PubMed] [Google Scholar]
- 30.Mayer LD, Bally MB, Cullis PR. Uptake of adriamycin into large unilamellar vesicles in response to a pH gradient. Biochim Biophys Acta. 1986;857(1):123–126. doi: 10.1016/0005-2736(86)90105-7. [DOI] [PubMed] [Google Scholar]
- 31.Madden TD, Harrigan PR, Tai LC, Bally MB, Mayer LD, Redelmeier TE, Loughrey HC, Tilcock CP LWR, Cullis PR. The accumulation of drugs within large unilamellar vesicles exhibiting a proton gradient: a survey. Chem Phys Lipids. 1990;53:37–46. doi: 10.1016/0009-3084(90)90131-a. [DOI] [PubMed] [Google Scholar]
- 32.Lasic D, Martin F, Gabizon A, Huang S, Papahadjopoulos D. Sterically-stabilized liposomes: a hypothesis on the molecular origin of the extended circulation times. Biochimica et Biophysica Acta. 1991;1070:187–192. doi: 10.1016/0005-2736(91)90162-2. [DOI] [PubMed] [Google Scholar]
- 33.Lasic DD, Frederik PM, Stuart MC, Barenholz Y, McIntosh TJ. Gelation of liposome interior. A novel method for drug encapsulation. FEBS Letters. 1992;312(2–3):255–258. doi: 10.1016/0014-5793(92)80947-f. [DOI] [PubMed] [Google Scholar]
- 34.Haran G, Cohen R, Bar LK, Barenholz Y. Transmembrane ammonium sulfate gradients in liposomes produce efficient and stable entrapment of amphipathic weak bases. Biochim Biophys Acta. 1993;1151:201–215. doi: 10.1016/0005-2736(93)90105-9. [DOI] [PubMed] [Google Scholar]
- 35.Li X, Hirsh DJ, Cabral-Lilly D, Zirkel A, Gruner SM, Janoff AS, Perkins WR. Doxorubicin physical state in solution and inside liposomes loaded via a pH gradient. Biochimica et Biophysica Acta. 1998;1415(1):23–40. doi: 10.1016/s0005-2736(98)00175-8. [DOI] [PubMed] [Google Scholar]
- 36.Abraham SA, Edwards K, Karlsson G, MacIntosh S, Mayer LD, McKenzie C, Bally MB. Formation of transition metal-doxorubicin complexes inside liposomes. Biochim Biophys Acta. 2002;1565(1):41–54. doi: 10.1016/s0005-2736(02)00507-2. [DOI] [PubMed] [Google Scholar]
- 37.Tu S, McGinnis T, Krugner-Higby L, Heath TD. A mathematical relationship for hydromorphone loading into liposomes with trans-membrane ammonium sulfate gradients. J Pharm Sci. 2010;99(6):2672–2680. doi: 10.1002/jps.22017. [DOI] [PMC free article] [PubMed] [Google Scholar]
- 38.McKillop D, Hutchison M, Partridge EA, Bushby N, Cooper CM, Clarkson-Jones JA, Herron W, Swaisland HC. Metabolic disposition of gefitinib, an epidermal growth factor receptor tyrosine kinase inhibitor, in rat, dog and man. Xenobiotica. 2004;34(10):917–934. doi: 10.1080/00498250400009171. [DOI] [PubMed] [Google Scholar]
- 39.Parikh HH, McElwain K, Balasubramanian V, Leung W, Wong D, Morris ME, Ramanathan M. A rapid spectrofluorimetric technique for determining drug-serum protein binding suitable for high-throughput screening. Pharm Res. 2000;17(5):632–637. doi: 10.1023/a:1007537520620. [DOI] [PubMed] [Google Scholar]
- 40.Allen TM, Chonn A. Large unilamellar liposomes with low uptake into the reticuloendothelial system. FEBS Lett. 1987;223:42–46. doi: 10.1016/0014-5793(87)80506-9. [DOI] [PubMed] [Google Scholar]
- 41.Gabizon A, Papahadjopoulos D. Liposome formulations with prolonged circulation time in blood and enhanced uptake by tumors. Proc Natl Acad Sci USA. 1988;85:6949–6953. doi: 10.1073/pnas.85.18.6949. [DOI] [PMC free article] [PubMed] [Google Scholar]
- 42.Anderson M, Omri A. The effect of different lipid components on the in vitro stability and release kinetics of liposome formulations. Drug Deliv. 2004;11(1):33–39. doi: 10.1080/10717540490265243. [DOI] [PubMed] [Google Scholar]


