

Abstract
The development and optimization of immune therapies in patients has been hampered by the lack of preclinical models in which their effects on human immune cells can be studied. As a result, observations that have been made in preclinical studies have suggested mechanisms of drug action in murine models that may not be confirmed in clinical studies. We have utilized a humanized mouse reconstituted with human hematopoetic stem cells to circumvent these limitations. We have studied the effects of teplizumab in this model, a Fc receptor non-binding humanized monoclonal anti-CD3 antibody that has been used to treat patients with Type 1 diabetes mellitus. A novel mechanism of action was identified where human gut tropic CCR6+ T cells leave the circulation and secondary lymph organs and migrate to the small intestine. They become producers of IL-10 which can be detected in the peripheral circulation. Blockade of migration of T cells to the small intestine by natalizumab abolishes the treatment effects of teplizumab. Direct translation of these findings was possible in patients with Type 1 diabetes treated with teplizumab since we found there is increased expression of IL-10 by CD4+CD25highCCR6+FoxP3 cells when they emerge into the peripheral circulation. These findings demonstrate that humanized mice may be used to identify novel immunologic mechanisms that occur in patients treated with immune modulators.
Introduction
In recent years the number of immunomodulatory agents available to treat human disease has grown exponentially (Colombel et al., 2010; Feldmann and Maini, 2010; Kremer et al., 2006; Martin and Chan, 2006; Polman et al., 2006). These drugs typically target immunological mechanisms that have been studied in rodent preclinical models of human disease combined with studies of human cells in vitro. Then early stage clinical trials are undertaken to test the safety and efficacy of treatment in patients. This approach takes many years to optimize a successful therapy, is costly, and potentially has risks for patients (Chen et al., 2009; Keane et al., 2001; Roep and Peakman, 2010; Suntharalingam et al., 2006; Waldron-Lynch and Herold, 2011). Importantly, studies of the mechanism of action of these reagents using samples of peripheral blood often do not confirm observations in the preclinical studies that led to the development of the biologic. The reasons for this include differences in murine and human immune responses as well as lack of access to tissue compartments where important immune response may be occurring in patients(Hayday and Peakman, 2008; von Herrath and Nepom, 2009).
Preclinical studies in the non obese diabetic (NOD) mouse model originally demonstrated that treatment with a brief course of murine anti-CD3 mAb at onset of diabetes induced sustained remission by induction of tolerance to pancreatic β cells (Chatenoud et al., 1997; Chatenoud et al., 1994). These studies identified an initial reduction in T cells followed by the restoration of tolerance by the induction and activation of a T regulatory population(Chatenoud, 2010). In mice, the remission from diabetes is complete and sustained, precluding the need for repeat administration(Chatenoud et al., 1994). Similarly, in humans treated with FcR non-binding anti-CD3 mAb, there was a rapid reduction in T cells at initiation of anti-CD3 treatment followed by a rapid recovery of T cells post treatment (Herold et al., 2009; Keymeulen et al., 2005). This reduction and reappearance in T cells in humans may be due to depletion but also margination of T-cells from the peripheral circulation (Hirsch et al., 1989). In addition to the trafficking of T cells, non FcR non-binding anti-CD3 mAbs have been found to induce adaptive regulatory T cells in mice, that have been characterized by expression of CD25 and regulation through a TGFβ-dependent mechanism (Chatenoud and Bluestone, 2007).
Initial clinical trials of humanized monoclonal anti-CD3 antibodies teplizumab (hOKT3γ1(Ala-Ala)) and otelixizumab (ChAglyCD3) shown efficacy in human clinical trials for treatment of new onset type 1 diabetes (T1D) (Herold et al., 2005; Herold et al., 2002; Keymeulen et al., 2005; Keymeulen et al., 2010). However, further phase II clinical trial of Teplizumab and Otelixizumab has had mixed results. Teplizumab has been shown to be effective in the preservation of endogenous insulin production at high dose while Otelixizumab was ineffective at low dose (Sherry et al., 2011; Tolex, acesssed March 31 2011). Analysis of peripheral blood from study subjects have failed to identify human Treg populations similar to those found in mice. IL-10+CD4+ T cells, not described in the preclinical rodent models, have been identified transiently in the peripheral circulation of treated patients but their location and the way in which these cells are generated is unclear(Herold et al., 2003). Understanding the mechanisms of action of these mAbs in humans is essential for the effective design and implementation of future clinical trials.
Therefore, to clarify the mechanism of action of teplizumab on human cells in vivo, we have utilized a tolergenic humanized mouse model to study the effects of the drug (Lepus et al., 2009). The use of the humanized mouse engrafted with human hemopoietic stem cells allows for the reconstitution of human immune systems without the development of graft versus host responses that would preclude the evaluation of immune modulators(Choi et al., 2011; Ito et al., 2009). The humanized mouse permits access to tissue compartments and secondary lymph organ that are unavailable in humans for study. The model facilitates the direct in vivo study of human biologics and monoclonal therapies.
We found that teplizumab treatment induced human T cells to migrate to the small intestine. We identified a population of gut tropic human regulatory T cells that migrate to the duodenum in response to increased expression of chemokine CCL20 by cells of the small intestine and infiltrating human T cells. When in the gut, the CD4 T cells express Foxp3 and produce IL-10. When we blocked entry of CD4 T cells to the small intestine in teplizumab treated mice with a second therapeutic antibody natalizumab, that binds alpha 4 integrin (α4) migration of CD4 T cells to the small intestine was decreased. As was the increase in serum IL-10 associated with teplizumab treatment. Using a mismatched humanized mouse skin allograft system we show that blockade of teplizumab induced migration of human CD4 T cells to the lamina propria and ablated the treatment effects of the drug on graft survival.
From these observations it was possible to identify this specific population of CD4+ CCR6+IL-10+ T cells in treated patients. We found that the gut tropic Tregs transiently decline during therapy, but express higher levels of IL-10 and Foxp3 after completion of treatment in patients.
Results
Humanized mouse reconstitution and treatment with anti-CD3 mAb
We screened reconstituted NOD/SCID IL2γc-/- (NSG) mice by analysis of peripheral blood cells at 12-14 weeks of age. Figure 1A shows staining for human lymphocytes (hCD45), T cells (hCD4/hCD8) and B lymphocytes (hCD19) in a representative mouse and Figure 1B shows the cell populations in all of the mice used for these studies. The mean percentages of hCD45+ cells in the group treated with teplizumab (N=11) was 37.44% ± 7.48 (mean ± SEM) v hIg group (N=11) 30.01% ± 7.6; CD4 2.56% ± 0.74 v 3.84% ± 1.5; CD8 6.3% ± 3.29 v 6.34% ± 2.76; and hCD19 27.43 ± 6.97% v 18.07 ± 7.79 (all p values NS).
Fig.1. Humanized mouse reconstitution and treatment with teplizumab.

(A) FACS dot plot from peripheral blood of a representative humanized mouse prior to treatment showing the degree of human reconstitution. Staining for mouse CD45(mCD45), humanCD45 (hCD45), human CD8(hCD8), human CD4(hCD4), and human CD19(hCD19) after gating on total lymphocyte populations. (B) Humanized mouse reconstitution prior to treatment with teplizumab or control Ig (N=22). The percentage of hCD45+, CD4+, CD8+, and CD19+ human cells are shown for individual mice (the line designates median value). (C) CD4:CD8 ration in mice treated with tepilizumab or hIg showing decrease in the ratio following teplizumab treatment (* p < 0.05). (D) Coating of human CD3-T cell receptor (CD3-TCR) complex after a single injection of 5 μg of teplizumab (line histogram) or control Ig (gray histogram). Binding of OKT3 to T cells was significantly reduced in the teplizumab treated group (***p < 0.001, N= 11). The percent coating was 39 ± 8.39% (mean ± SEM).
To replicate the effects of drug treatment in patients, we treated mice with a single 5μg dose of drug which is the equivalent to the total dose administered to clinical trial subjects adjusted for weight of the mice. Control animals received 5μg of hIg. Following teplizumab treatment the CD4:CD8 ratio decreased in the peripheral blood from 2.03 ± 0.53 to 1.01 ± 0.50; p < 0.05, analogous to the decline seen in patients who were treated with the drug (Figure 1C) (Herold et al., 2005). We measured the coating of CD3 by staining PBMC with OKT3 which competes with teplizumab for binding to CD3ε. The mean fluorescence intensity (MFI) of CD3 staining decreased from 2405 ± 414 to 1031 ± 226 MFI units; P < 0.001 which corresponds to 39% ± 8.39 coating of CD3 molecules (Fig. 1D). This is similar to that reported in patients after the first full dose of drug (Herold et al., 2005).
Decrease in human T cells following treatment with anti-CD3 mAb
The effects of teplizumab treatment on the populations of total human lymphocytes (hCD45), total human T cells (hCD2), hCD4 cells, hCD8 cells and hCD19 cells were examined in five tissue compartments (peripheral blood, spleen, lung, bone marrow, and the small intestine). In the peripheral blood, there was a decline in circulating hCD4 cells following treatment with teplizumab (11.03 ± 5.65%) as compared to control hIg (26.2 ± 8.47%; p < 0.05) (Fig 2A). In the spleen the total number of hCD45 cells did not shown a significant change (4.5 × 10⁶ ± 1 × 10⁶ vs 2.1 × 10⁶ ± 7.2 × 10⁵; p = 0.1). However there was an increase in the proportion and absolute number of CD19 cells (3.3 × 10⁶ ± 9 × 10⁴ vs 1.2 × 10⁶ ± 5 × 10⁴; p < 0.05) (Fig 2B), a significant decrease in the proportion of CD4+ cells (8.38% ± 4.613 v control hIg 24.23% ± 7.9; p < 0.05), and a trend for a similar decrease in the CD8+ T cells (4.85% ± 2 v control hIg 14.37% ± 5.6; p=NS) (Fig 2B). There was also a small reduction in the proportion of T cells in the bone marrow and lung in the teplizumab treated group (p = ns)(Fig 2C).
Fig 2. Analysis of T cells in tissue compartments of humanized mice following treatment with teplizumab.

(A) Analysis of peripheral blood: (L) Dot plot of peripheral blood from a representative mouse in the teplizumab treated group showing decline in the population of human T cells 18 hours after anti-CD3 treatment. Analysis of T cell and B cell populations comparing the teplizumab and hIg treated groups with gating on hCD45+ cells. There was a significant decline of the hCD4 population in the anti-CD3 treated group (N=11, *p < 0.05)(mean±SEM). (B) Analysis of spleen from the anti-CD3 and hIg treated mice. There was a decline in the proportion of hCD4 cells in the anti-CD3 group 44 spleens (*p < 0.05)(L). This is accompanied by an increase in the number of CD19 cells (*p <0.05) and a modest decline in the absolute number of CD4+ and CD8+ T cells (N=11). (C) Analysis of the lung and bone marrow of showed no evidence of accumulation of human lymphocytes with anti-CD3 treatment at those locations. Dot plots and bar graphs were gated on total live hCD45 cells and percentages of human T and B cells were then expressed in terms of total live human lymphocytes.
T cells migrate to the lamina propria of the small intestine following treatment with teplizumab
Eighteen hours after treatment with anti-CD3 mAb, there was an increase in the total number of human CD45+ cells infiltrating the lamina propria of the small intestine (359 ± 92 vs 26 ± 5; p < 0.002)(Fig. 3A,B). Both CD4+ and CD8+ T cells were found but there was a slightly greater proportion of CD4 cells 22.75 % ± 6.15 as compared to CD8 cells 18.55% ± 3.35. Immunohistochemistry studies confirmed these findings. There were scattered hCD45+ cells but no evidence of an organized infiltrate in the duodenum. The architecture of the villi, crypts and luminal epithelial surfaces was intact (Fig 3C). We did not identify any human lymphocytes in the IEL compartment of the small intestine from the anti-CD3 mAb treated mice by FACS analysis.
Fig 3. Migration of human T cells to the lamina propria of the small intestine.

(A) Analysis of human lymphocytes extracted from the lamina propria of the small intestine from representative animals. Dot plots on the L show live hCD45 cells as a percentage of total cells gated on scatter in a teplizumab treated mouse as compared to a hIg treated control. The R plot shows the phenotypes of these cells. Data from a single mouse representative of 11 mice is shown. (FSA=forward scatter area) (B) The number and phenotype of hCD45+ cells were determined by FACS analysis of cells isolated from the gut. In the teplizumab group there was an increase in the total count of human lymphocytes. Each dot represents a single mouse (***p < 0.0005). The phenotypes included CD4+ and CD8+ T cells. (C) Immunhistochemistry of duodenum from showing human lymphocytes in a teplizumab but not control Ig treated mice. The arrows show hCD45+ (brown) T cells located in the lamina propria of the teplizumab treated mouse (red arrow). There is no evidence of inflammation and epithelial surfaces are intact A: teplizumab (X40); B: hIg treated (X40); C: teplizumab treated (X20); D: hIg treated (X20)). Individual animals representative of 6 in each group are shown.
Mircoarray analysis of migrating T cells
These studies suggested that cells from the periphery migrated to the lamina propria in response to anti-CD3 mAb treatment. To identify markers that distinguished the migrating lymphocytes, we compared, by microarray, gene expression in sorted hCD4 splenocytes after anti-CD3 mAb treatment in vivo (n=4) to CD4+ cells harvested from splenocytes treated with anti-CD3 mAb in vitro (n=4) both 18 hours after treatment. With this analysis, the comparison between the cells treated in vitro, in which migrating cells were trapped in the culture wells, and in vivo, in which migrating cells had left the spleen, allowed us to identify the differential expression of genes by the migrating cells. We confirmed the expression of these genes among the gut-infiltrating by quantitative PCR (QPCR). This analysis identified increased expression of IL-10 (6 fold), IL-8(7 fold), and CCR6 (3 fold) and 7 other genes (Fig 4A).
Fig 4. Teplizumab induces migration of human CD4 T cells to the small intestine by the CCR6/CCL2Q axis.

(A) Microarray analysis of the migrating CD4 cell population to the gut from the spleen of humanized mice (N=4). The genes shown were increased 2 fold with p < 0.05 in comparison of CD4+ T cells from the spleens from mice treated with teplizumab vs CD4+ splenocytes that were cultured with teplizumab in vitro. The migrating hCD4 cells had increased expression of CCR6, the immunoregulatory gene IL-10 and IL-8. (B) Expression of CCR6 on splenocytes from humanized mice cultured with teplizumab (red), control Ig (blue) for 18 hrs. Isotype staining is shown in green. There was a significant increase in the expression of CCR6 (N=6)(*p<Q.Q5) but not CCR9 on CD4+ T cells during culture with teplizumab. (C) hCD4 cells have increased expression of CCR6 and reduced expression of CD62L within the small intestine (***p<0.001, ** p< 0.01, *p<0.05) (E) The expression of mouse CCL20(mCCL20) was measured by QPCR as described in cellular isolates of the duodenum and ileum. mCCL20 was increased in the duodenum, of the anti-CD3 mAb treated mice as compared to ileum or to control hIg treated mice (**p<0.01). (F) The expression of human CCL20 was measured by QPCR in sorted human CD4 cells and cellular isolates from teplizumab and hIg treated mice. Expression was increased in hCD4 cells isolated from the small intestine (***p < 0.001).
T cells increase expression of CCR6 and reduce expression of CD62 ligand expression after teplizumab treatment
Our array screen suggested that CCR6, induced by anti-CD3 mAb, might be a homing receptor used by cells that migrate to the GI tract. We therefore studied the expression of CCR6 on splenocytes from the humanized mice cultured with teplizumab. There was a modest but significant increase in expression of CCR6 on CD4+ T cells (36.12% ± 5.17 v 31.28% ± 4.25; p < 0.05, N=5)(Fig 4B), whereas the expression of another chemokine receptor, CCR9, was unchanged. We then analyzed CCR6+CD4+ T cells in the peripheral circulation after treatment with control Ig or teplizumab. We found a trend towards a reduced proportion of hCD4CCR6+ cells in the circulation (34.82% ± 1.19 v 42.68 ± 3.27; p = ns, n=6). At the same time, we found increased expression of CCR6 mRNA in the CD4+ T cells in the gut compared to cells in the spleen (p<0.00l n=4, Fig 4C). In addition, we found by QPCR, lower levels of CD62L on these cells (p<0.05)(Fig 4D).
CCL20 is the known homing ligand for CCR6. We extracted total RNA from the duodenum and ileum from mice that had been treated with anti-CD3 mAb and analyzed expression of both human and mouse CCL20 by QPCR using species specific primers. We found increased expression of both human and mouse CCL20 in the duodenum but not the ileum in teplizumab treated mice (Fig 4D and E). The increased expression of hCCL20 was on CD4+ T cells because we found increased gene expression of hCCL20 in these cells when compare to the total duodenal and ileum cell isolates (p < 0.001) (Fig 4E). In other studies (not shown), we found increased expression of IL-8 mRNA in the gut infiltrating cells compared to splenocytes from these mice (p<0.001).
Gut migrating T cells express IL-10, Foxp3 and increased regulatory function compared to splenocytes
Based on our findings from gene arrays, we compared the expression of IL-10 and other associated genes in the T cells from the spleen and gut of the drug and control Ig-treated mice by QPCR. Since there were few human cells in the lamina propria of control mice we compared gene expression by the gut infiltrating cells to splenocytes from anti-CD3 mAb-treated (N=6), hIg-treated (N=6) (Fig 5A), The QPCR analysis confirmed increased expression of IL-10 among the CD4+ that had migrated to the gut compared to the spleen from the anti-CD3 mAb or control Ig-treated groups (n=4, P<0.01 Fig 5A). In addition, the relative expression of Foxp3 in hCD4 T cells from the small intestine was significantly higher in the teplizumab treated humanized mice compared to resident spleen T cells from teplizumab treated or hIg treated controls (P < 0.01). (Fig 5B). Surprisingly, TGFβ expression was lower in the gut T cells than in the spleen of anti-CD3 mAb treated mice (Suppl Fig 1, p<0.05). IFNγ and IL-17 mRNA were undectable in the CD4 cells that infiltrated the lamina propria
Fig 5. Human CD4 cells have increased expression of Il 10 and FoxP3 in the small intestine lamina propria.

(A) IL-10 and (B) FoxP3 expression were determined by quantitative PCR analysis in CD4+ cells from the small intestine and spleens of the treatment groups. IL-10 (***p< 0.001) and FoxP3 (***p< 0.001) is increased in the small intestine in anti-CD3 treated mice as compared to anti-CD3 treated, hIg treated, anti-CD3 + natalizumab treated and hIg + natlizumab treated CD4+ splenocytes.
To determine the function of ex vivo of human CD4 T cells that have migrated to the small intestine lamina propria we isolated human CD4 cells from the LP and spleens from four teplizumab treated animals and tested the ability to inhibit proliferation of CD25-depleted splenocytes activated with anti-CD3/28 beads. We found that the CD4+ cells from the LP of Teplizumab treated animals where 10 times more effective at inhibiting the proliferation of CD4+CD25- cells from untreated animals than CD4+ splenocytes at 1:2 and even 1:8 Treg:responder ratios (p < 0.001), but the overall level of inhibition was modest (8.46 ± 0.39% v 0.81 ± 0.33%).
Natalizumab blocks the migration of T cells to the small intestine following teplizumab treatment and the induction of Tregs
It was not clear from these studies whether migration to the lamina propria was needed for the CD4+ T cells to become producers of IL-10 and to acquire regulatory function. The earliest events in lymphocyte migration to the GI tract involves the direct binding of α4β7 to MAdCAM-1 that is expressed on the endothelial cells. Therefore, to determine the role of T cell migration to the small intestine for the induction of IL-10 and Foxp3, we co-treated mice with natalizumab (anti-human α4 mAb) and teplizumab. We found that with co-administration of the mAbs, there was no longer a decrease in the number of CD4+CCR6+ cells in the spleen (n=8) when compare to the teplizumab treatment group (N=6) (4.2 × 10⁵ ± 1.6 × 10⁵ V 2.3 × 10⁶ ± 4.5 × 10⁵; P < 0.05)(Fig 6A).
Fig 6. Natalizumab blocks the migration of T cells to the small intestine following teplizumab treatment.
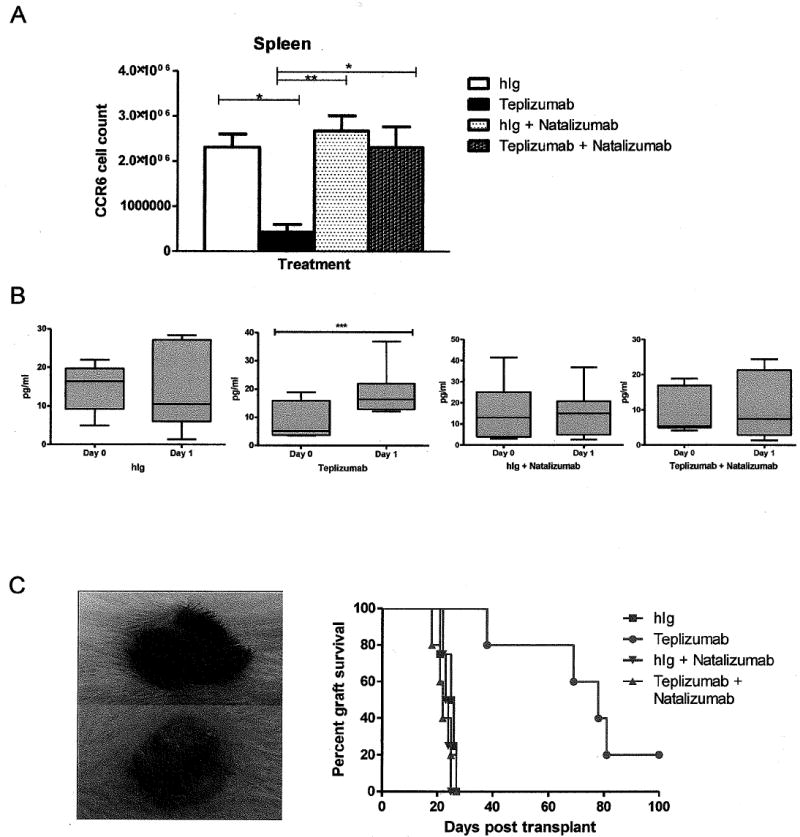
(A) The total number of CCR6+CD4+ splenocytes was determined by flow cytometry (n=8 mice/group). There was a significant decrease in the number of CCR6+CD4+ T cells after teplizumab treatment (*p<0.05) that was reversed with natalizumab treatment, the changes in CD4+CCR6+ cells were not significantly different when compared to teplizumab treatment (N=6) alone (p < 0.005). (B) The levels of IL-10 were measured in the serum of mice by Luminex, before and after treatment with teplizumab in the four treatment groups. There was a significant increase in the concentration of IL-10 only in the teplizumab group (*** p<0.001 by paired t-test, n=6-9/group, plots show median and 10th and 90th percentiles). Co treatment with natalizumab ablated this rise in IL-10. (C) Murine allogenic skin graft from B6 donor to reconstituted NSG mouse at day 15 following treatment with teplizumab (top) and hIg (below). The hIg treated mouse shows evidence of rejection. Co-treatment with natalizumab and teplizumab abated the treatment effect of teplizumab on graft survival. Each symbol represents an individual mouse (p=0.003 hIg v teplizumab, p=0.004 teplizumab v teplizumab + natalizumab).
We also extracted lymphocytes from the lamina propria of the mice groups treated with natalizumab to determine the number of hCD45 following treatment. There was a 73% reduction in the number of hCD45+ cells infiltrating the lamina propria of the small intestine in the teplizumab + natalizumab group (97±14) compared to the teplizumab alone group (359 ± 92; p < 0.05). There was not a significant difference in the number of human cells in the lamina propria in the hIg treated, hIg + natalizumab (56 ± 13) (n=8) and teplizumab + natalizumab groups (p =NS). In addition, to the reduced number of cells, the expression of IL-10 and Foxp3 were reduced in the gut as well as in the spleen cells (Fig 5 A and B).
Our findings of anti-CD3 mAb induced IL-10 expression in the gut-migrating CD4 cells suggested that an early marker of these events might be the release of IL-10 into the serum. We therefore measured the concentrations of IL-10 in the serum on day 1 after anti-CD3 mAb treatment and tested the effects of natalizumab treatment to determine the requirement for gut migration for cytokine expression. There was an increase in the concentration of IL-10 following teplizumab treatment when compared to pre treatment levels (Day 0: 8.45 pg/ml + 2.1 v Day 1 18.46 pg/ml + 2.66; p < 0.005), but no overall change in serum IL-10 levels in the hIg treated group (N=6) (Fig 6B). Furthermore, we found that natalizumab treatment ablated the increase in systemic IL-10 mediated by teplizumab treatment (N=6) (Fig 6B). There was no significant change in serum levels of IFNγ or TNFα in treatment groups and IL-6 was not detectable in the serum (not shown).
Finally, to test the functional consequences of inhibition of gut mitration, we tested the effects of teplizumab with and without natalizumab co-treatment on rejection of mouse skin allografts. In this model, we transplanted, complete MHC mismatched, C57BL/6 skin onto the reconstituted mice. (Syngeneic skin was not rejected in the reconstituted mice.) We found that teplizumab treatment alone prolonged skin graft survival compare to hIg (73 ± 10 days v 25 ± 1 days; p < 0.003)(Fig 6C). However when the anti-CD3 mAb treated mice also received natalizumab, there was rapid rejection of allogeneic skin (22 ± 1 days; p < 0.004). Natalizumab treatment + hIg had no effect on graft survival compared to hIg alone (24 ± 0.5 days v 25 ± 1 days) (Fig 6C)
Teplizumab treatment causes decline in CD4+ and CCR6+ cells in treated subjects
To determine whether the mechanisms we had identified in the humanized mice occurred in patients, we first measured the concentrations of IL-10 in the serum of patients with T1D who received a 14 day course of teplizumab (n=11) as part of a clinical trial. There was a rise in the concentration of IL-10 on the day following the first full dose of drug (day 6, p < 0.05, Figure 7A). We found a decline in CD4+CCR6+ T cells when study day 0 (untreated) was compared to study day 14 (prior to last treatment) (8.64 ± 0.96% v 3.32± 0.38%; p < 0.001, Figure 7B and C). Approximately two months after treatment at study day 60 the population of CD4+CCR6+ cells had increased to 6.54 ± 0.9% but remained lower than before teplizumab treatment (p< 0.05)(Fig 7C). We did not identify a significant change in the CD4+CCR9+ or CD4+CD49d+ population of circulating T cells in the teplizumab treated subjects. We did not detect changes in CCR6+ populations in placebo-treated control subjects (N=3) analyzed. We then stained the CD4+CD25+CCR6+ cells for intracellular IL-10 and Foxp3, without activation ex vivo, in two cohorts of treated patients (n=10 and 7), and found that expression of both were increased compared to before treatment (Fig 7D-G). On day 14, at the conclusion of teplizumab treatment, the percentage of CD4+CD25+CCR6+Foxp3+ cells increased from 3.9±0.98% to 18.2±3.45% (p<0.01) and the percentage of CD4+CD25+CCR6+IL-10+ cells increased from 6.6±0.7% to 15.13±2.1% (p<0.05)(Fig 7F). The frequency of the Foxp3+ and IL-10+ cells remained increased even 2 months after anti-CD3 mAb treatment compared to baseline but the difference did not reach statistical significance. Finally, we found that the absolute number of CD4+CD25+CCR6+FoxP3+ cells expressing IL-10 increased in teplizumab treated subjects (n=4) from Day 0 to Day 14 (0.99 × 10⁻⁶ ± 0.17 v 1.5 × 10⁻⁶; p < 0.05) without a signficant change in absolute lymphocyte count (p=ns).
Fig 7. Teplizumab treatment induces IL-10 production and a population of CCR6+CD4+CD25+Foxp3+ T cells in patients.

(A) Serum cytokine analysis from the treated patients subjects showing increase in systemic IL-10 on the day following full dose teplizumab treatment (* p < 0.05 by paired t-test). (B) Representative FACS plot showing decline of CD4CCR6+ T cells in the peripheral blood during treatment. Day 0 before treatment, Day 14 immediately after treatment, and Day 60 (2 months) after treatment). Data from a single patient, representative of 10 is shown. (C) In teplizumab treated subjects CD4+CCR6+ cells decline in the peripheral blood with treatment (*** p < 0.001) and remain lower after treatment (** p < 0.01 by paired t-test). (D) During treatment there is an increase in the expression of Foxp3 on CD4+CD25hiCCR6+ (**p< 0.01). (E) Representative FACS plot showing changes in IL-10 expression among CCR6+ and – cells with gates on CD4+CD25+ cells. The increase in IL-10 production is primarily on the CCR6+ cells. A single subject representative of 7 is shown. Cross hairs were drawn at < 1.5% staining with control Abs. (F) Increased expression of IL-10 by CD4+CD25hiCCR6+cells from day 0 to day 14 (*p< 0.01). (G) Increase in the numbers of CD4+CD25hiCCR6+Foxp3 cells expressing IL-10 in the peripheral circulation during teplizumab treatment (*p<0.05 by paired t-test of Ln(counts (×10-6) +1). The cell counts were calculated from the blood counts obtained during the clinical trial.
Discussion
We used humanized NOD/scid IL2γc-/- mice to study the initial events that occur with human cells following treatment with FcR non-binding anti-CD3 mAb. Immune deficient mice, reconstituted with human hematopoietic stem cells develop lymphoid and myeloid lineage cells without graft versus host disease (Choi et al., 2011; Ito et al., 2009). In previous studies, these mice have been shown to develop productive adaptive immune responses to Salmonella typhi (Libby et al., 2010; Song et al., 2010). They also have been found to have a functional Treg compartment (Onoe et al., 2011). Although the extent of lymphoid development in the mice is incomplete compared to normal humans, the model provides a functional human immune system that can be used to investigate the mechanism of action human monoclonal antibodies in vivo without the use of human subjects. To our knowledge, this is the first use of the model to study the effects of human immunotherapies.
We found that non-FcR binding anti-CD3 mAb causes migration of T lymphocytes to the proximal small bowel. This occurs following induction of CCR6 on T cells and expression of murine and human CCL20 in the cells of the GI tract. The migrating cells produce IL-10 and then appear in the peripheral circulation. The cells that we extracted from the GI tract had modest effects in a standard Treg assay compared to conventional natural Tregs, but this may reflect that fact that in our assay, we used the entire gut-infiltrating CD4+ cell population, rather than a subpopulation selected on phenotypic or functional markers. Nonetheless, our studies with the MHC mismatch mouse skin graft model were able to show the requirement for gut migration for the immune modulating effects of the anti-CD3 mAb and the requirements for migration for their regulatory function. We used the anti-human α4 antibody, natalizumab, which is used for treatment of Crohn’s disease (Ghosh et al, 2003; Sandborn et al, 2005) to test the postulated mechanism of action (Coisne et al., 2009; Hyams et al., 2007; Mikulowska-Mennis et al., 2001). Blockade of α4 integrin inhibits one of the earliest steps in T cell migration across the GI endothelium, and therefore, entry into the small intestine was inhibited even though other homing molecules such as CCR6 were still expressed by the cells. When migration of CD4+ T cells was blocked, the teplizumab treatment effect on prolongation of graft survival was abolished. Data from humans treated with teplizumab has suggested that lymphocytes may migrate out of the systemic circulation in response to therapy. This is based on the kinetics of change in the T cell compartment and the absence of T cell receptor excision circles when the cell counts recover after treatment suggesting that the recovering cells were not new thymic emigrants (Herold et al., 2009; Keymeulen et al., 2005; Keymeulen et al., 2010). A recent study of FcR non-binding anti-CD3 mAb in mice suggested that there was at least some depletion of T cells, a possibility that we cannot exclude in our studies since we do not know the total number of cells in every compartment(Penaranda et al., 2011). Nonetheless, our finding that the decrease in CD4+ T cells in the spleen was blocked when natalizumab was added to teplizumab suggests that cell migration was the most important basis for changes in cell counts. Curiously, we found an increase in the absolute number of B lymphocytes in the spleen together with a decrease in the proportion of T cells. We cannot be certain whether the increase in B cells reflects homeostatic proliferation, perhaps in response to “space” created by migration or even depletion of T cells in the spleen and peripheral blood.
Once in the lamina propria of the small intestine the CCR6+ T cells increased their expression of FoxP3 and IL-10 as compared to the spleen. Interestingly, the changes were site specific to the small intestine, and required migration to that site because it was not seen when the migration was blocked with natalizumab. This suggests that the CD4CCR6 cells acquire a regulatory phenotype in the small intestine. There was no increased in systemic IL-10 and no decrease in the number of CD4+CR6+ T cells in the spleen when migration to the small intestine was blocked.
Our array studies initially identified IL-10 as one of the factors produced by the migrating cells, but the array studies could not identify the requirements for tissue migration. Treatment with teplizumab leads to T cell activation (Herold et al., 2003) and up regulation of CCR6 on CD4 T cells. This was a selective effect of anti-CD3 mAb on T cells since we did not see increased expression of CCR9 or CD49d (α4 integrin). In addition, the CD3 mAb treatment increased expression of the ligand, CCL20, in the GI track. Previous studies by GI biopsy have demonstrated that the CCR6/CCL20 interaction mediates migration of T cells to the upper GI tract in humans (Kaser et al., 2004; Wu et al., 2007). The reasons why both human and murine CCL20 were increased are not clear but suggests activity of a soluble factor. We did not find histologic evidence of inflammation but we did find increased expression of IL-8 on the gut infiltrating cells which may induce expression of human and murine CCL20. Recent evidence suggests that IL-8 could be involved in the regulation of CCL20 expression by the intestinal epithelial cells (Ivison et al., 2010). Recently Esplunges et al found that anti-CD3 mAb induced expression of IL-17 in gut infiltrating T cells (Esplungues et al, 2011). However we were unable to detect any IL-17 expression by the human CD4 T cells. The reasons for the difference between our study and the previous report in mice and in a humanized mouse model may be due to the use of matured PBMC that may include more IL-17+ precursor cells.
Importantly, the model was able to recapitulate many of the features that occur with treatment of patients with anti-CD3 mAb such as coating of human CD3, reversal of the CD4:CD8 ratio and induction of IL-10. From our experience in human trials, we selected a teplizumab dose for treatment of the mice that was equivalent to the dose given to patients. We studied the mice 18 hours post treatment in mice to represent day 1 post treatment in human studies since we were interested in determining if migration of T cells out of the systemic circulation occurred follow first dose in humans. However, in human trials, the drug is given over 14 days, so there may be other changes in cells that occur over a more extended period of time in patients that we have not detected. Our studies of the mAb treatment in mice identified cell subsets and mechanisms that we found to be similar in patients who were treated with the same drug. This included an increase in serum IL-10 and induction of an IL-10+CCR6+ population of CD4+ T cells that we postulate also migrate to the gut in patients. Indeed, we were able to identify this subpopulation in patients with type 1 diabetes who had been treated with teplizumab in a recent clinical trial of the drug. In previous studies we had found CD4+IL-10+ cells transiently in the systemic circulation after treatment. These new finding have identified the subpopulations of CD4CD25hiCCR6FoxP3+ T regulatory cells that can produce IL-10 and the basis for their induction. Importantly, the IL-10 production was found on T cells on day 14 following the last dose of mAb without stimulation ex vivo, While the frequency of the cells that spontaneously produce IL-10 appears to decline after that time (at month 3 following treatment), these cells would be expected to again produce IL-10 in response to antigen, which may account for lasting effects of the drug even beyond the period of drug administration. This information may be useful for monitoring the effects of drug treatment in clinical trials with teplizumab
The ability of the reconsituted mice to accurately replicate immunological mechanisms with human immune cells is an advance over current murine models since there are inherent differences in human and murine immune cells. Furthermore, our findings highlight the limitations of mechanistic studies that restrict themselves to analysis of peripheral blood in humans. In the case of anti-CD3 mAb treatment, analysis of the peripheral blood in patients was previously able to identify a decline in circulating cells but neither the basis for the change in cell number or the phenotype of the migrating cells. This use of the humanized mouse may now be extended to investigate the mechanism of action of other human immunotherapies.
Methods
Mice
NOD/SCIDIL2γc-/- (NSG) and C57BL6 mice were purchased from the Jackson Laboratory and bred at our animal facility. Mice were kept under specific pathogen free conditions. Experiments were approved by the Institutional Animal Care and Use Committee of Yale University. Samples were obtained from participants in clinical trial NCT 00378508 (“Delay”). The trial as well as use of human umbilical vein blood were approved by the Yale University Institutional Review Board. Written informed consent was given for the use of the samples for mechanistic studies.
Mabs for staining
Prior to staining, all samples were pre incubated with Mouse BD Fc Block (BD Biosciences). The following conjugated mAbs were used for flow cytometry analysis: murine CD45 (30-Fll)(peridinin chlorophyll protein complex, (PerCP)), CD45 (NS-1 fluoroscein isothyocyanate(FITC) or PerCP), CD19 (HIB19)(FITC), CD4 (RPA-T4)(allophycocyanin(APC) or FITC), human CD45 (HI30)(phycoerythrin (PE) or Pacific Blue (PB)), CD8 (HITa)(PECP), CD2 (RPA-2.10)(APC). CD25(M-A251)(PE), CD127(HCD127)(PerCP), CD8(RPA-T8)(APC) CCR6 (TG7)(PE), CD8 (RPA-T8)(PerCP-Cy5.5), CCR9 (BL) (Alex Fluro 647), CD49d (9F10)(PE), CD62L (DREG-56)(PE-Cy5), APC CD8(RPA-T8), Foxp3(206D (FITC)), or IL-10 (IL-10 JES3-9D7 (PECy7). Viability of cells was confirmed by use of a Live/Dead fixable dead stain kit (Invitrogen).
Isolation of human CD34+ stem cells and reconstitution of humanized mice
Human umbilical cord blood was obtained from human placentas within 4 hours of delivery. CD34+ cells were isolated on a discontinuous density gradient of Ficoll-Paque Plus (GE Healthcare) and purified with magnetically labeled microbeads conjugated to anti human CD34+ (Miltenyi Biotec). 2 × 10⁵ fresh CD34+ cells were then injected intrahepatically into 1 to 2 day old NSG pups that had been irradiated (1 Gray). The reconstitution of these mice with human cells was determined in peripheral blood at 12 weeks by fluorescence activated cell sorting (FACS) analysis on a FACSCalibur (BD). All FACS staining was carried out in phosphate buffered saline(PBS) supplemented with 3% heat inactivated fetal calf serum FCS (Atlanta Biologicals) and 0.01% sodium azide (Sigma-Aldrich). Results from FACS were analyzed with Flow Jo software (Version 7.6.3).
Teplizumab dose, Natalizumab dose, T cell ratio and CD3 coating studies
The total dose of teplizumab (hOKT3γ1(Ala-Ala)) administered to a 70kg human subject in NCT00378508 is 17 mg (0.24mg/kg). We administered 5μg of Teplizumab intraperitoneally per mouse(0.025kg) which is equivalent to the human dose at 0.2mg/kg. Control mice were administered human 5μg of human IgG (hIg)(Sigma) intraperitoneally. The same dose of Teplizumab/hIg and duration of treatment (18 hours) was used in all in vivo and ex vivo experiments. For coating studies and measurement of CD4:CD8 ratio, mice where bled immediately before treatment and at sacrifice. Coating of the CD3-T cell receptor(TCR) complex was assessed by competitive staining with mAb human CD3 (OKT3)(FITC). Coating of CD3 on circulation T cells and the CD4:CD8 ratio were calculated as previously described (Herold et al., 2002; Woodle et al., 1999). In some experiments we also administered 600μg of Natalizumab (IgG4κ humanized mAb to human α4-integrin) intravenously 2 hours prior to treatment with 5μg of teplizumab or hIg.
Extraction, purification and analysis of human lymphocytes
Cells were isolated from the lung, bone marrow and spleen by tissue homogenization. Peripheral blood was collected in lithium heparin coated tubes (BD Microtainer) Harvested lymphocytes were treated with ACL lysing buffer (Lonza) to remove red blood cells. Lamina propria lymphocytes (LPL) and intra epithelial lymphocytes (IEL) from the small intestine were isolated as described with the following modifications (Lefrancois L, 1996). Extracted and homogenized small intestines were incubated with 10% FCS RPMI (Cellgro), 2 units/ml collagenase (Sigma) and 10μg/ml Dnase I (Roche) for 45 minutes in a shaker at 37°C. After washing with PBS were loaded onto a Percoll Plus (GE Healthcare) gradient and centrifuged. Lymphocytes where harvested between the 44-67% interfaces with debris discarded. FACS analysis was carried out on a LSRII (BD Biosciences). In certain experiments, peripheral blood mononuclear cells from normal donors were isolated by Ficoll discontinuous density gradient. These were cultured in AIM-V media with teplizumab (5μg/ml) or control hIg. Isolated mouse splenocytes were cultured in a similar manner.
Unless indicated, an electronic gate was placed on live hCD45 cells. Human T and B cell lymphocyte quantities were then expressed either as percent of hCD45+ cells or as absolute counts (by multiplying by the cell counts). Human CD4 cells from spleen and small intestine where purified by positive selection on magnetic-activated Dynabeads (Invitrogen). We were unable to amplify murine actin from the hCD4+ cells isolated from the small intestine in this manner.
Immunohistochemistry of humanized mouse small intestine
After treatment of humanized mice with teplizumab or hIg, the small intestine was harvested and fixed in 1% paraformaldehyde overnight at 4°C. Tissue was then placed in a PBS dextrose gradient of 5% for 30 minutes, 10% for 1 hour, 20% for 1 hour and 30% overnight at 4°C. They were then washed and mounted in OCT followed by snap freezing. Frozen sections were cut at 5 microns on Leica CM1850 microtome at -20°C. Antigen retrieval was carried out by heating the section to 85°C for 2 hours in a Coppin jar in target retrieval solution pH 9 (Dako). After washing, the sections were incubated for 15 minutes with 1% goat serum in PBS followed avidin/biotin blocking as per the manufactures protocol (Vector Labs). Anti-human CD45 (2B11+PD7/26) was applied overnight at 4°C followed by biotinylated goat anti mouse (DAKO) at room temperature and then with Streptavidin-HRP (BD) and staining with peroxidase substrate (Vector Labs). Hematoxylin counter stain was applied and sections were then mounted in crystal/mount (Biomeda).
Microarray analysis of migration T cell population
In order to identify genes expressed by cells that leave the spleen, the spleens were harvested from untreated reconstituted mice and a single cell suspension was prepared in AIM-V serum free medium (GIBCO). The cultures were treated with either teplizumab or hIg for 18 hrs. Splenocytes were also harvested 18 hrs after reconstituted mice were treated with teplizumab. RNA was prepared from cells with the RNAeasy purification system (Qiagen). 100ng of RNA from each sample was amplified as per the manufacturer protocol with an Illumina totalprep RNA amplification kit (Ambion). 1000ng of biotinylated cRNA was provided for expression analysis with 2 HumanHT-12 v3 Expression BeadChips (Illumina). 12 samples (4 in vivo anti-CD3 treated group, 4 ex vivo anti-CD3 treated group 4 ex vivo hIg treated group) for hCD4 were analyzed with GeneSPring GX 10 (Agilent Technologies). Genes of interested were defined as having at least two fold change in expression in at least three samples from each group (P < 0.05).
Quantitative PCR analysis
RNA from cells was converted to cDNA with reverse transcriptase (Superscript II, Invitrogen) and oligo(dT) primers following the manufacturer’s protocol. Quantitative PCR was carried out using a Quantitect SyBR green PCR kit (Qiagen) on a IQ5 multicolor real time PCR (Biorad). Primers were designed for genes of interest (Sequences in Supp Table 1). All results were normalized to the human or mouse actin genes that were quantified in parallel PCR reactions. Individual assays were performed as duplicates or triplicates. Results were analyzed with Qgene software (Simon, 2003).
Cytokine analysis
Humanized mice were bled and serum was isolated immediately before treatment and at 18 hours after treatment. Samples were obtained from participants in clinical trials at pre determined time points. All serum samples were stored at -80°C. Human cytokines were measured with an ultrasensitive Milliplex XMap assay (Millipore). The reported sensitivity of this assay for the cytokines tested is 1 pg/ml (Bhakta S, 2007). Samples were analyzed on a Bioplex analyzer (Biorad). To ensure the sensitive of this assay we validated our results with a second assay Human Multi-spot (Mesoscale).
Suppression assays
Lymphocytes were isolated and pooled from the spleens and LP of 4 reconstituted mice mice treated with teplizumab. Responder lymphocytes where harvested from the spleens of 2 untreated reconstituted mice engrafted with hCD34+ cells from the same umbilical cord. Contaminating mouse lymphocytes where removed by positive selection with anti-mouse CD45 magnetic beads on LS column (Miltenyi Biotec). Human CD4+ cells were purified by negative selection with magnetic beads(Stemcell) and the CD4+CD25+ cell were removed by positive selection. CFSE (lμM) labeled T responder cells at 1×10⁴ cells/well were cultured in 96 well round bottom plates in the presence of dilutions of hCD4+ cells isolated from the LP and spleen. Cell cultures were stimulated with CD2:CD3:CD28 beads (Miltenyi Biotech). After four days cells were harvested and analyzed by flow cytometry. Inhibition of proliferation was calculated as {1-(%divided with added cells/%divided without added cells)} × 100.
Murine skin allografts
The mouse skin allografts was carried out as previously described with the following modifications(Garrod and D. Cahalan, 2008). Donor skin was harvested from adult C57B6 mice (H2b) and engrafted onto adult reconstituted NSG mice. Post-op mice received Meloxicam (1.64mg/ml) in drinking water for five days. Dressings where removed at day 7 post graft. Skin graft where monitored daily and the day of rejection was defined as complete loss of the graft.
Analysis of lymphocytes from patients treated with Teplizumab
Patient samples were obtained from subjects enrolled in trial NCT00378508 and had been treated with teplizumab. For each individual subject serum cytokines and lymphocytes were analyzed before treatment (Day 0), immediately after the last dose (Day 14), 2 months post treatment (Day 60). Absolute lymphocyte counts were determined in local clinical laboratory. Peripheral blood mononuclear cells for FACS were extracted on the day of the patient visit by a Ficoll discontinuous density gradient and cryopreserved in liquid nitrogen until further processing. Intracellular staining was performed for FoxPS or IL-10 as described above.
Statistical analysis
A Student’s t-test for paired data or unpaired data was used where indicated. A Mann-Whitney test for unpaired data was used for data that was not normally distributed. Cytokine levels were log transformed and compared by a t-test. For multiple groups analysis of variance (ANOVA) test with Bonferroni’s multiple comparison test was applied. A p value of less than 0.05 was considered statistically significant.
Supplementary Material
(A) TGFβ expression is lower in hCD4 cells in the intestine of anti-CD3 treated mice when compared to spleen (**p<0.01). Co treatment of natalizumab and teplizumab had no effect on TGF expression in the hCD4+ splenocytes.
Acknowledgments
The authors would like to thank J Alderman for his assistance in procuring umbilical cord blood. We would also like to thank E. Esplugues and S Humber for their assistance with total gut RNA extractions. We also thank J Lyon for expert help regard FACS staining. FWL is supported by the Dr. Richard Steevens’ Scholarship from the Health Service Executive (Ireland). Supported by grants JDRF 2007-1059, NIH DK057846, UL1 RR024139, JDRF 2006-351, and 2006-502.
Footnotes
Author contributions
FWL and KH designed the study and wrote the manuscript. RAF assisted with design of the study, provided umbilical cord samples and contributed to the critical reading of the manuscript. OH assisted with the microarray and quantitative PCR analysis. PPH assisted with the extract and sorting of cells from the mice. SD optimized the immunohistochemistry staining. JT conducted tissue culture studies. FWL conducted all other experiments and analyzed data.
References
- Bhakta S, L N, Fu Y, Brodey MM, Wang J. Ultrasenitive Human Cytokine 10-Pex for Luminex xMap Patform. Journal of Immunology. 2007;178:B200. [Google Scholar]
- Chatenoud L. Immune therapy for type 1 diabetes mellitus-what is unique about anti-CD3 antibodies? Nat Rev Endocrinol. 2010;6:149–157. doi: 10.1038/nrendo.2009.275. [DOI] [PubMed] [Google Scholar]
- Chatenoud L, Bluestone JA. CD3-specific antibodies: a portal to the treatment of autoimmunity. Nat Rev Immunol. 2007;7:622–632. doi: 10.1038/nri2134. [DOI] [PubMed] [Google Scholar]
- Chatenoud L, Primo J, Bach JF. CD3 antibody-induced dominant self tolerance in overtly diabetic NOD mice. J Immunol. 1997;158:2947–2954. [PubMed] [Google Scholar]
- Chatenoud L, Thervet E, Primo J, Bach JF. Anti-CD3 antibody induces long-term remission of overt autoimmunity in nonobese diabetic mice. Proc Natl Acad Sci U S A. 1994;91:123–127. doi: 10.1073/pnas.91.1.123. [DOI] [PMC free article] [PubMed] [Google Scholar]
- Chen Y, Bord E, Tompkins T, Miller J, Tan CS, Kinkel RP, Stein MC, Viscidi RP, Ngo LH, Koralnik IJ. Asymptomatic reactivation of JC virus in patients treated with natalizumab. N Engl J Med. 2009;361:1067–1074. doi: 10.1056/NEJMoa0904267. [DOI] [PMC free article] [PubMed] [Google Scholar]
- Choi B, Chun E, Kim M, Kim SY, Kim ST, Yoon K, Lee KY, Kim SJ. Human T cell development in the liver of humanized NOD/SCID/IL-2Rγ(null)(NSG) mice generated by intrahepatic injection of CD34(+) human (h) cord blood (CB) cells. Clin Immunol. 2011 doi: 10.1016/j.clim.2011.02.019. [DOI] [PubMed] [Google Scholar]
- Coisne C, Mao W, Engelhardt B. J Immunol. United States: 2009. Cutting edge: Natalizumab blocks adhesion but not initial contact of human T cells to the blood-brain barrier in vivo in an animal model of multiple sclerosis; pp. 5909–5913. [DOI] [PubMed] [Google Scholar]
- Colombel JF, Sandborn WJ, Reinisch W, Mantzaris GJ, Kornbluth A, Rachmilewitz D, Lichtiger S, D’Haens G, Diamond RH, Broussard DL, Tang KL, van der Woude CJ, Rutgeerts P Group S.S. Infliximab, azathioprine, or combination therapy for Crohn’s disease. N Engl J Med. 2010;362:1383–1395. doi: 10.1056/NEJMoa0904492. [DOI] [PubMed] [Google Scholar]
- Feldmann M, Maini RN. Anti-TNF therapy, from rationale to standard of care: what lessons has it taught us? J Immunol. 2010;185:791–794. doi: 10.4049/jimmunol.1090051. [DOI] [PubMed] [Google Scholar]
- Garrod KR, Cahalan MD. Murine Skin Transplantation. J Vis Exp. 2008:e634. doi: 10.3791/634. [DOI] [PMC free article] [PubMed] [Google Scholar]
- Hayday AC, Peakman M. The habitual, diverse and surmountable obstacles to human immunology research. Nat Immunol. 2008;9:575–580. doi: 10.1038/ni0608-575. [DOI] [PubMed] [Google Scholar]
- Herold KC, Burton JB, Francois F, Poumian-Ruiz E, Glandt M, Bluestone JA. Activation of human T cells by FcR nonbinding anti-CD3 mAb, hOKT3gamma1(Ala-Ala) J Clin Invest. 2003;111:409–418. doi: 10.1172/JCI16090. [DOI] [PMC free article] [PubMed] [Google Scholar]
- Herold KC, Gitelman S, Greenbaum C, Puck J, Hagopian W, Gottlieb P, Sayre P, Bianchine P, Wong E, Seyfert-Margolis V, Bourcier K, Bluestone JA. Treatment of patients with new onset Type 1 diabetes with a single course of anti-CD3 mAb Teplizumab preserves insulin production for up to 5 years. Clin Immunol. 2009;132:166–173. doi: 10.1016/j.clim.2009.04.007. [DOI] [PMC free article] [PubMed] [Google Scholar]
- Herold KC, Gitelman SE, Masharani U, Hagopian W, Bisikirska B, Donaldson D, Rother K, Diamond B, Harlan DM, Bluestone JA. A single course of anti-CD3 monoclonal antibody hOKT3gamma1(Ala-Ala) results in improvement in C-peptide responses and clinical parameters for at least 2 years after onset of type 1 diabetes. Diabetes. 2005;54:1763–1769. doi: 10.2337/diabetes.54.6.1763. [DOI] [PMC free article] [PubMed] [Google Scholar]
- Herold KC, Hagopian W, Auger JA, Poumian-Ruiz E, Taylor L, Donaldson D, Gitelman SE, Harlan DM, Xu D, Zivin RA, Bluestone JA. Anti-CD3 monoclonal antibody in new-onset type 1 diabetes mellitus. N Engl J Med. 2002;346:1692–1698. doi: 10.1056/NEJMoa012864. [DOI] [PubMed] [Google Scholar]
- Hirsch R, Gress RE, Pluznik DH, Eckhaus M, Bluestone JA. Effects of in vivo administration of anti-CD3 monoclonal antibody on T cell function in mice. II. In vivo activation of T cells. J Immunol. 1989;142:737–743. [PubMed] [Google Scholar]
- Hyams JS, Wilson DC, Thomas A, Heuschkel R, Mitton S, Mitchell B, Daniels R, Libonati MA, Zanker S, Kugathasan S. J Pediatr Gastroenterol Nutr. United States: 2007. Natalizumab therapy for moderate to severe Crohn disease in adolescents; pp. 185–191. [DOI] [PubMed] [Google Scholar]
- Ito R, Katano I, Kawai K, Hirata H, Ogura T, Kamisako T, Eto T, Ito M. Highly sensitive model for xenogenic GVHD using severe immunodeficient NOG mice. Transplantation. 2009;87:1654–1658. doi: 10.1097/TP.0b013e3181a5cb07. [DOI] [PubMed] [Google Scholar]
- Ivison SM, Wang C, Himmel ME, Sheridan J, Delano J, Mayer ML, Yao Y, Kifayet A, Steiner TS. Oxidative stress enhances IL-8 and inhibits CCL20 production from intestinal epithelial cells in response to bacterial flagellin. Am J Physiol Gastrointest Liver Physiol. 2010;299:G733–741. doi: 10.1152/ajpgi.00089.2010. [DOI] [PubMed] [Google Scholar]
- Kaser A, Ludwiczek O, Holzmann S, Moschen AR, Weiss G, Enrich B, Graziadei I, Dunzendorfer S, Wiedermann CJ, Mürzl E, Grasl E, Jasarevic Z, Romani N, Offner FA, Tilg H. Increased expression of CCL20 in human inflammatory bowel disease. J Clin Immunol. 2004;24:74–85. doi: 10.1023/B:JOCI.0000018066.46279.6b. [DOI] [PubMed] [Google Scholar]
- Keane J, Gershon S, Wise RP, Mirabile-Levens E, Kasznica J, Schwieterman WD, Siegel JN, Braun MM. Tuberculosis associated with infliximab, a tumor necrosis factor alpha-neutralizing agent. N Engl J Med. 2001;345:1098–1104. doi: 10.1056/NEJMoa011110. [DOI] [PubMed] [Google Scholar]
- Keymeulen B, Vandemeulebroucke E, Ziegler AG, Mathieu C, Kaufman L, Hale G, Gorus F, Goldman M, Walter M, Candon S, Schandene L, Crenier L, De Block C, Seigneurin JM, De Pauw P, Pierard D, Weets I, Rebello P, Bird P, Berrie E, Frewin M, Waldmann H, Bach JF, Pipeleers D, Chatenoud L. Insulin needs after CD3-antibody therapy in new-onset type 1 diabetes. N Engl J Med. 2005;352:2598–2608. doi: 10.1056/NEJMoa043980. [DOI] [PubMed] [Google Scholar]
- Keymeulen B, Walter M, Mathieu C, Kaufman L, Gorus F, Hilbrands R, Vandemeulebroucke E, Van de Velde U, Crenier L, De Block C, Candon S, Waldmann H, Ziegler AG, Chatenoud L, Pipeleers D. Four-year metabolic outcome of a randomised controlled CD3-antibody trial in recent-onset type 1 diabetic patients depends on their age and baseline residual beta cell mass. Diabetologia. 2010;53:614–623. doi: 10.1007/s00125-009-1644-9. [DOI] [PubMed] [Google Scholar]
- Kremer JM, Genant HK, Moreland LW, Russell AS, Emery P, Abud-Mendoza C, Szechinski J, Li T, Ge Z, Becker JC, Westhovens R. Effects of abatacept in patients with methotrexate-resistant active rheumatoid arthritis: a randomized trial. Ann Intern Med. 2006;144:865–876. doi: 10.7326/0003-4819-144-12-200606200-00003. [DOI] [PubMed] [Google Scholar]
- Lefrancois L, N L. Isolation of Mouse Samll Intestinal Intraepithelial Lymphocytes, Peyers Patch, Lamina Propria Cells. Current Protocols in Immunology. 1996:3.19.11–13.19.16. doi: 10.1002/0471142735.im0319s17. [DOI] [PubMed] [Google Scholar]
- Lepus CM, Gibson TF, Gerber SA, Kawikova I, Szczepanik M, Hossain J, Ablamunits V, Kirkiles-Smith N, Herold KC, Donis RO, Bothwell AL, Pober JS, Harding MJ. Comparison of human fetal liver, umbilical cord blood, and adult blood hematopoietic stem cell engraftment in NOD-scid/gammac-/-, Balb/c-Ragl-/-gammac-/-, and C.B-17-scid/bg immunodeficient mice. Hum Immunol. 2009;70:790–802. doi: 10.1016/j.humimm.2009.06.005. [DOI] [PMC free article] [PubMed] [Google Scholar]
- Libby SJ, Brehm MA, Greiner DL, Shultz LD, McClelland M, Smith KD, Cookson BT, Karlinsey JE, Kinkel TL, Porwollik S, Canals R, Cummings LA, Fang FC. Humanized nonobese diabetic-scid IL2rgammanull mice are susceptible to lethal Salmonella Typhi infection. Proc Natl Acad Sci USA. 2010;107:15589–15594. doi: 10.1073/pnas.1005566107. [DOI] [PMC free article] [PubMed] [Google Scholar]
- Marelli-Berg FM, Cannella L, Dazzi F, Mirenda V. The highway code of T cell trafficking. J Pathol. 2008;214:179–189. doi: 10.1002/path.2269. [DOI] [PubMed] [Google Scholar]
- Martin F, Chan AC. B cell immunobiology in disease: evolving concepts from the clinic. Annu Rev Immunol. 2006;24:467–496. doi: 10.1146/annurev.immunol.24.021605.090517. [DOI] [PubMed] [Google Scholar]
- Mikulowska-Mennis A, Xu B, Berberian JM, Michie SA. Am J Pathol. United States: 2001. Lymphocyte migration to inflamed lacrimal glands is mediated by vascular cell adhesion molecule-1/alpha(4)beta(1) integrin, peripheral node addressin/1-selectin, and lymphocyte function-associated antigen-1 adhesion pathways; pp. 671–681. [DOI] [PMC free article] [PubMed] [Google Scholar]
- Onoe T, Kalscheuer H, Danzl N, Chittenden M, Zhao G, Yang YG, Sykes M. J Immunol. United States: 2011. Human natural regulatory T cell development, suppressive function, and postthymic maturation in a humanized mouse model; pp. 3895–3903. [DOI] [PMC free article] [PubMed] [Google Scholar]
- Penaranda C, Tang Q, Bluestone JA. J Immunol. United States: 2011. Anti-CD3 therapy promotes tolerance by selectively depleting pathogenic cells while preserving regulatory T cells; pp. 2015–2022. [DOI] [PMC free article] [PubMed] [Google Scholar]
- Polman CH, O’Connor PW, Havrdova E, Hutchinson M, Kappos L, Miller DH, Phillips JT, Lublin FD, Giovannoni G, Wajgt A, Toal M, Lynn F, Panzara MA, Sandrock AW A. Investigators. A randomized, placebo-controlled trial of natalizumab for relapsing multiple sclerosis. N Engl J Med. 2006;354:899–910. doi: 10.1056/NEJMoa044397. [DOI] [PubMed] [Google Scholar]
- Roep BO, Peakman M. Surrogate end points in the design of immunotherapy trials: emerging lessons from type 1 diabetes. Nat Rev Immunol. 2010;10:145–152. doi: 10.1038/nri2705. [DOI] [PubMed] [Google Scholar]
- Sherry N, Hagopian W, Ludvigsson J, Jain SM, Wahlen J, Ferry RJ, Jr, Bode B, Aronoff S, Holland C, Carlin D, King KL, Wilder RL, Pillemer S, Bonvini E, Johnson S, Stein KE, Koenig S, Herold KC, Daifotis AG. Lancet. Elsevier Ltd; England: 2011. Teplizumab for treatment of type 1 diabetes (Protege study): 1-year results from a randomised, placebo-controlled trial; pp. 487–497. [DOI] [PMC free article] [PubMed] [Google Scholar]
- Simon P. Q-Gene: processing quantitative real-time RT-PCR data. Bioinformatics. 2003;19:1439–1440. doi: 10.1093/bioinformatics/btg157. [DOI] [PubMed] [Google Scholar]
- Song J, Willinger T, Rongvaux A, Eynon EE, Stevens S, Manz MG, Flavell RA, Galán JE. A mouse model for the human pathogen Salmonella typhi. Cell Host Microbe. 2010;8:369–376. doi: 10.1016/j.chom.2010.09.003. [DOI] [PMC free article] [PubMed] [Google Scholar]
- Suntharalingam G, Perry MR, Ward S, Brett SJ, Castello-Cortes A, Brunner MD, Panoskaltsis N. Cytokine storm in a phase 1 trial of the anti-CD28 monoclonal antibody TGN1412. N Engl J Med. 2006;355:1018–1028. doi: 10.1056/NEJMoa063842. [DOI] [PubMed] [Google Scholar]
- Tolex. [March 31 2011];Tolex and GSK announce Phase 3 Defend-1 study of Otelixizumab in type 1 diabetes did not meet its primary endpoint. http://www.tolerx.com/index.php?page=prdetail&id=204.
- von Herrath M, Nepom GT. Remodeling rodent models to mimic human type 1 diabetes. Eur J Immunol. 2009;39:2049–2054. doi: 10.1002/eji.200939429. [DOI] [PubMed] [Google Scholar]
- Waldron-Lynch F, Herold KC. Nat Rev Drug Discov. England: 2011. Immunomodulatory therapy to preserve pancreatic beta-cell function in type 1 diabetes; pp. 439–452. [DOI] [PubMed] [Google Scholar]
- Woodle ES, Xu D, Zivin RA, Auger J, Charette J, O’Laughlin R, Peace D, Jollife LK, Haverty T, Bluestone JA, Thistlethwaite JR. Phase I trial of a humanized, Fc receptor nonbinding OKT3 antibody, huOKT3gamma1(Ala-Ala) in the treatment of acute renal allograft rejection. Transplantation. 1999;68:608–616. doi: 10.1097/00007890-199909150-00003. [DOI] [PubMed] [Google Scholar]
- Wu YY, Tsai HF, Lin WC, Hsu PI, Shun CT, Wu MS, Hsu PN. Upregulation of CCL20 and recruitment of CCR6+ gastric infiltrating lymphocytes in Helicobacter pylori gastritis. Infect Immun. 2007;75:4357–4363. doi: 10.1128/IAI.01660-06. [DOI] [PMC free article] [PubMed] [Google Scholar]
Associated Data
This section collects any data citations, data availability statements, or supplementary materials included in this article.
Supplementary Materials
(A) TGFβ expression is lower in hCD4 cells in the intestine of anti-CD3 treated mice when compared to spleen (**p<0.01). Co treatment of natalizumab and teplizumab had no effect on TGF expression in the hCD4+ splenocytes.