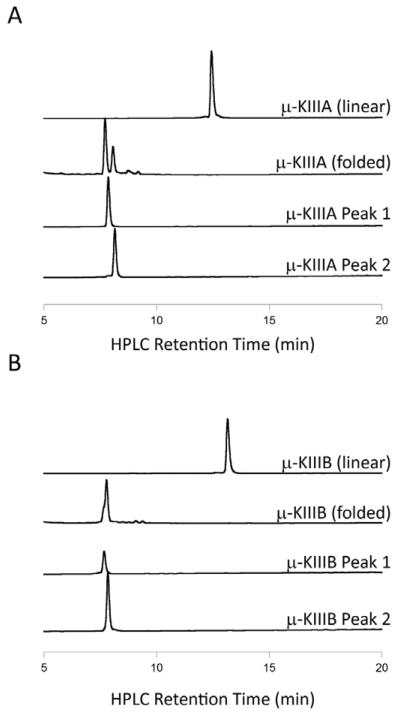
Figure 1.
Representative reversed-phase HPLC chromatograms of the oxidative folding of (A) μ-KIIIA and (B) μ-KIIIB. μ-KIIIA Peaks 1 and 2 represent the [C1-C15,C2-C9,C4-C16] and [C1-C16,C2-C9,C4-C15] connectivities, respectively (see text). Folding was carried out in buffered solution (pH 7.5) containing a 1:1 mM mixture of oxidized and reduced glutathione for 2 h at room temperature.

