

Abstract
Background
Understanding speech in the presence of background noise often becomes increasingly difficult with age. These age-related speech processing deficits reflect impairments in temporal acuity. Gap detection is a model for temporal acuity in speech processing, in which a gap inserted in white noise acts as a cue that attenuates subsequent startle responses. Lesion studies have shown that auditory cortex is necessary for the detection of brief gaps, and auditory cortical neurons respond to the end of the gap with a characteristic burst of spikes called the gap termination response (GTR). However, it remains unknown whether or how the GTR plays a causal role in gap detection. We tested this by optogenetically suppressing the activity of somatostatin- or parvalbumin-expressing inhibitory interneurons, or CaMKII-expressing excitatory neurons, in auditory cortex of behaving mice during specific epochs of a gap detection protocol.
Results
Suppressing interneuron activity during the post-gap interval enhanced gap detection. Suppressing excitatory cells during this interval attenuated gap detection. Suppressing activity preceding the gap had the opposite behavioral effects, whereas prolonged suppression across both intervals had no effect on gap detection.
Conclusions
In addition to confirming cortical involvement, here we demonstrate for the first time a causal relationship between post-gap neural activity and perceptual gap detection. Furthermore, our results suggest that gap detection involves an ongoing comparison of pre- and post-gap spiking activity. Finally, we propose a simple, yet biologically plausible neural circuit that reproduces each of these neural and behavioral results.
INTRODUCTION
Understanding speech in noisy environments, such as a crowded restaurant, often becomes increasingly difficult with age. Age-related speech processing deficits can occur even with completely normal audiometric hearing, and are instead associated with temporal processing deficits [1, 2]. In contrast to declines in audiometric hearing, which are associated with the peripheral auditory system [3], age-related temporal processing deficits involve higher-order structures [4-6]. Lesion studies suggest that auditory cortex is essential for temporal acuity [7-9]. However, lesions cannot reveal the contributions of specific cortical circuits or cell types, nor can they reveal any of the dynamic processing by which these circuits mediate temporal processing. Moreover, most neurophysiological studies of temporal processing have been only correlative. As a result, the mechanisms underlying temporal processing in cortex are not well understood.
A well-established measure of temporal processing in both humans and animals is gap detection. In this variant of pre-pulse inhibition, a silent gap is inserted into continuous background noise. The gap acts as a cue that reduces the startle response evoked by a subsequent loud noise burst. Gaps as brief as 2-4ms measurably attenuate the startle response in species as diverse as mice [7], zebra finches [10] and humans [11]. Cortical deactivation studies have shown that auditory cortex is necessary for the detection of brief gaps (≤50ms), but not for long gaps (75-100ms; [7, 9]). The duration of the briefest detectable gap is referred to as the minimum gap threshold (MGT). Auditory cortical neurons respond to the end of the gap with a characteristic burst of spikes called the gap termination response (GTR). The cortical GTR has a similar minimum gap threshold as behavioral startle attenuation, and both grow with increasing gap durations [7, 9, 12]. The cortical GTR has therefore been proposed as a neural correlate of brief gap detection [12, 13].
Demonstrating a causal link between the cortical GTR and perceptual gap detection requires manipulating the GTR itself. The challenge lies in manipulating neural activity only during the brief interval (50ms) when the GTR occurs, between the gap termination and the onset of the startle stimulus. Here we used optogenetic suppression to specifically manipulate the GTR. We measured gap detection in transgenic mice expressing Archaerhodopsin (Arch; [14]) in one of three different neuronal populations: parvalbumin-expressing GABAergic interneurons (PV), somatostatin-expressing GABAergic interneurons (SOM), or CaMKII-expressing pyramidal neurons (PNs). Both PV and SOM interneurons have a predominantly inhibitory role, reducing excitatory PN activity [15-19]. We predicted that suppressing the activity of these inhibitory cells during the post-gap interval would increase the GTR and enhance gap detection. Conversely, we predicted that suppressing CaMKII-expressing pyramidal neurons during the same interval would decrease the GTR and reduce gap detection. We also tested the effects of cortical manipulation during other epochs of the task to test the specificity with which the GTR is responsible for brief gap detection, and how it interacts with activity during other epochs of the task.
We found that suppressing SOM- or PV-expressing inhibitory interneurons immediately following brief gaps enhanced gap detection. Suppressing CaMKII-expressing excitatory neurons during this period reduced gap detection. This demonstrates for the first time the functional relationship between cortical GTRs and perceptual gap detection. By contrast, suppression limited to the pre-gap interval elicited the opposite behavioral effects. Prolonged suppression throughout both pre- and post-gap intervals had no effect on gap detection. Taken together, these data indicate that gap detection involves a comparison between pre- and post-gap neuronal activity. We illustrate this idea with a simple neural circuit model that implements such a comparison and reproduces our neural and behavioral results.
RESULTS
We tested the ability of mice to detect gaps of 2, 4, 6, 8, 10, 25 and 50ms embedded in continuous 80dB white noise. Gap detection was measured by the attenuation of the startle response evoked by a 100dB burst of noise, presented 50ms after the gap. On alternating trials, we suppressed the activity of SOM- or PV-expressing inhibitory interneurons, or CaMKII-expressing excitatory PNs, during either: (1) the 50ms interval between gap termination and startle onset, which includes the GTR (“post-gap” suppression), (2) the 940ms interval preceding gap onset (“pre-gap” suppression), or (3) the entire 1000ms preceding startle onset (“prolonged” suppression both before and after the gap). In separate experiments in anesthetized mice we determined the optimal coordinates for optical fiber placement (Fig. S2), measured the spread of suppression at different laser intensities (Fig. S3), and electrophysiologically verified the efficacy of optogenetic suppression. We also verified in awake mice the electrophysiological effects of suppression directly on the GTR (Fig. S4). We used two laser intensities: 300mW/mm2, which affected only auditory cortex and provided moderate suppression, and 1000mW/mm2, which provided more robust suppression in auditory cortex but may have affected adjacent cortical and subcortical regions (Fig. S3).
Effects of SOM Interneuron Suppression
Auditory cortex is necessary for brief gap detection, and the amplitude of the cortical GTR is correlated with both detection threshold and the degree of startle attenuation [7, 9, 12]. SOM interneurons are found throughout the depth of cortex and therefore could be highly effective at suppressing auditory cortical activity [20-22]. We verified that SOM cells expressed Arch (Fig. 1A), that their laminar distribution was consistent with previous reports (Fig. 1B; [20-22]), and that suppression of SOM cells significantly increased PN spiking activity (Fig. 1C). If a causal link exists between the GTR and gap perception, we hypothesized that suppression of SOM activity during the post-gap interval would increase the GTR and result in greater attenuation of the startle reflex. Consistent with this prediction, suppression during the post-gap period significantly attenuated startle responses following gaps ≤25ms, but not 50ms (Fig. 1D). In other words, detection was improved for brief gaps. This effect was more pronounced with the higher laser intensity (1000mW/mm2, Fig. 1E). The minimum gap threshold (MGT) was 4ms and was not affected by SOM suppression at either intensity. SOM suppression in the 0ms gap condition had no effect, indicating a specific effect of suppression on gap detection. Moreover, the laser had no effect in Arch-negative SOM littermate controls (Fig. 1H).
Figure 1. Optogenetic suppression of somatostatin-expressing (SOM) interneurons enhances gap detection.
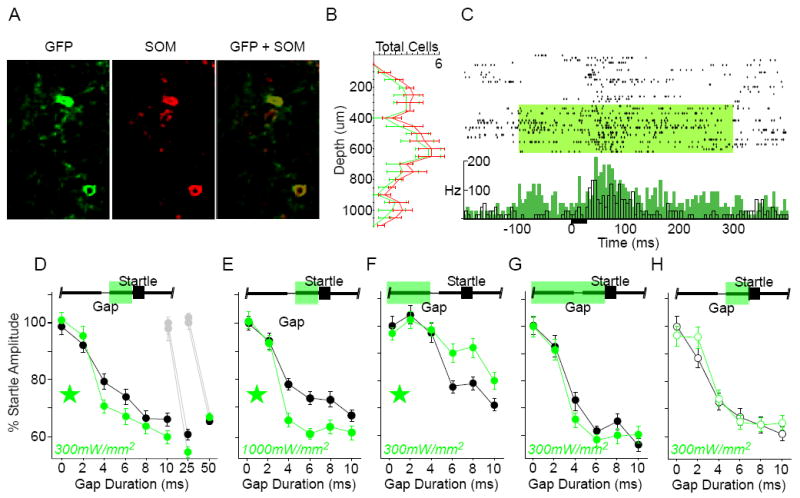
A) Co-localization of Arch-GFP native fluorescence (GFP) and somatostatin antibody labeling. 84% of somatostatin-positive cells expressed GFP (n = 4 sections, 2 mice). B) SOM interneurons were distributed throughout layers 2-6 in auditory cortex. The laminar distribution of GFP-labeled cells matched that of the overall somatostatin-positive population. Error bars show S.E.M. C) To confirm that activating Arch increased spiking activity in PNs, we recorded single-unit and multi-unit activity in anesthetized SOM mice. Illustrated is an example multi-unit recording from an anesthetized SOM animal. Top: raster plot of responses to a 25ms white noise burst (black bar), grouped by “laser off” and “laser on” trials (green shading: 300mW/mm2). Bottom: same data, shown as mean firing rate (black: “laser off”, green: “laser on”; 5ms bins). Suppressing SOM interneurons caused a significant increase in driven (0-100ms) and spontaneous (-100-0ms) spiking activity. Efficacy was verified in 4 mice. Suppressing SOM interneurons (300mW/mm2) significantly increased sound-evoked spiking activity for 9/23 (39%) recordings, 4 of which also showed a significant increase in spontaneous activity. Interestingly, most of these effects were seen in the subgranular layers: 75% of multi-unit sites deeper than 500μm showed significant effects of laser illumination. D-H) Gap detection behavior. The green bar at the top of each panel indicates the laser duration relative to Gap and Startle stimuli; green stars indicate significance within the ANOVA; error bars are S.E.M. D) Post-gap suppression, low intensity: Suppression of SOM interneurons specifically during the post-gap interval significantly attenuated startle responses (indicating enhanced gap detection) following gaps of ≤10ms [interaction F(5,1430) = 2.22, p = .049; 3 mice, 12 sessions] and 25ms (df = 718, t = 2.6, p = .009; 3 mice, 10 sessions), but not 50ms (4 mice, 12 sessions). Gray symbols correspond to the 0ms gap presentations during separate assessment of 25ms or 50ms gap detection. E) Post-gap suppression, high intensity: Increasing the laser intensity to 1000mW/mm2 further attenuated the startle following gaps ≤10ms [main effect F(1,206) = 14.98, p = .0001, and interaction F(5,1030) = 3.338, p = .006; 2 mice, 10 sessions]. F) Pre-gap suppression, low intensity: Suppression restricted to the pre-gap interval, beginning 1000ms prior to startle onset, enhanced startle responses to gaps ≤10ms [main effect F(1,234) = 4.71, p = .031, and interaction F(5,1170) = 3.37, p = .005; 4 mice, 10 sessions). G) Prolonged suppression, low intensity: Prolonged suppression, beginning 1000ms prior to startle onset and continuing through the post-gap interval, had no effect on gap detection (3 mice, 12 sessions). H) Gap detection was unaffected by the laser in Arch-negative SOM littermate controls (open circles; 3 mice, 10 sessions).
We next suppressed SOM interneurons during other temporal epochs of the gap detection protocol. Surprisingly, suppressing SOM activity in the pre-gap period increased startle amplitudes (Fig. 1F), indicating a decrease in gap detection. Even more interestingly, when we instead suppressed SOM interneurons uniformly across both the pre-gap and post-gap intervals (“prolonged suppression”), there was no effect on startle responses (Fig. 1G). These two results suggest the existence of a dynamic comparison between pre-gap and post-gap spiking activity.
Effects of PV Interneuron Suppression
PV-expressing interneurons also inhibit pyramidal neurons, and have distinct neurochemical, morphological and electrophysiological phenotypes compared to SOM interneurons [22-25]. We therefore expected that, like SOM interneurons, suppressing this population would improve gap detection. Here, too, our expectations were confirmed, although the effect was less robust. We first verified that PV cells expressed Arch (Fig. 2A), that their laminar distribution was consistent with previous reports (Fig. 2B; [26]), and that suppression of PV cells significantly increased PN spiking activity (Fig. 2C). Post-gap suppression of PV cells significantly reduced startle amplitudes following gaps of ≤10ms, but had no effect for gaps of 25ms or 50ms (Fig. 2D). As with the SOM animals, the effect was more robust with the higher laser intensity (1000mW/mm2, Fig. 2E). The MGT was reduced from 4ms to 2ms at the higher intensity (df = 179, t = 3.83, p = .0002), but was unaffected at the lower intensity.
Figure 2. Optogenetic suppression of parvalbumin-expressing (PV) interneurons enhances gap detection.
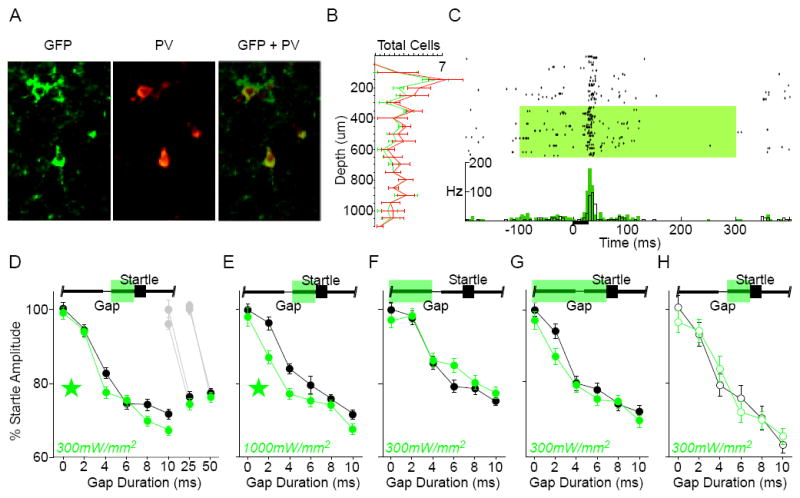
A) Co-localization of Arch-GFP native fluorescence and parvalbumin antibody labeling. 82% of parvalbumin-positive cells expressed GFP (n = 4 sections, 2 mice). B) PV interneurons were distributed throughout layers 2-6 in auditory cortex. The laminar distribution of GFP-labeled cells matched that of the overall parvalbumin-positive population. Error bars show S.E.M. C) To confirm that activating Arch increased spiking activity in PNs, we recorded single-unit activity in anesthetized PV mice. Illustrated is an example single-unit recording from an anesthetized PV animal. Top: raster plot of responses to a 25ms white noise burst (black bar), grouped by “laser off” and “laser on” trials (green shading: 300mW/mm2). Bottom: same data, shown as mean firing rate (black: “laser off”, green: “laser on”; 5ms bins). Suppressing PV interneurons caused a significant increase in driven (0-100ms) and spontaneous (-100- 0ms) spiking activity. Efficacy was verified in 4 mice. Suppressing PV interneurons (300mW/mm2) significantly increased sound-evoked spiking for 24/28 (85%) of recorded cells, 12 of which also showed a significant increase in spontaneous activity. D-H) Gap detection behavior. The green bar at the top of panels indicates the laser duration relative to Gap and Startle stimuli; green stars indicate significance within the ANOVA; error bars are S.E.M. D) Post-gap suppression, low intensity: Suppression of PV interneurons specifically during the post-gap interval significantly attenuated startles following gaps of ≤10ms [main effect F(1,403) = 4.2, p = .04; 4 mice, 18 sessions], but not 25ms or 50ms (2 mice, 11 sessions; 2 mice, 10 sessions). Gray symbols correspond to the 0ms gap presentations during separate assessment of 25ms or 50ms gap detection. E) Post-gap suppression, high intensity: Increasing the laser intensity to 1000mW/mm2 further attenuated the startle following gaps ≤10ms [main effect F(1,358) = 15.591, p < .0001; 3 mice, 15 sessions]. F) Pre-gap suppression, low intensity: Suppression restricted to the pre-gap interval did not significantly impact detection of gaps ≤10ms, though reduced attenuation was evident at several gap durations (2 mice, 16 sessions). G) Prolonged suppression, low intensity: Prolonged suppression did not significantly influence detection of gaps ≤10ms (4 mice, 12 sessions). H) Gap detection was unaffected by the laser in Arch-negative PV littermate controls (open circles; 2 mice, 9 sessions).
No significant effect was seen with pre-gap PV suppression, although as with SOM suppression the trend was in the direction of increased startle amplitudes (Fig. 2F). Prolonged PV suppression, in turn, had no effect on gap detection (Fig. 2G). Illumination again had no effect in Arch-negative PV littermate controls (Fig. 2H).
Finally, to test whether the effects of interneuron suppression were specific to gap detection, or more generally affected the gain of startle response circuitry, we measured conventional pre-pulse inhibition (using white noise bursts as the pre-pulses, presented in a silent background). PV and SOM suppression had no effect on pre-pulse inhibition (Fig. S5), indicating that the effects we observed were specific for gap detection.
Effects of CaMKII Pyramidal Neuron Suppression
We verified that CaMKII cells expressed Arch (Fig. 3A), that their laminar distribution was consistent with previous reports (Fig. 3B; [27]), and that suppression of CaMKII cells significantly reduced PN spiking activity (Fig. 3C). Suppressing SOM or PV inhibitory neurons during the post-gap interval improved gap detection. We predicted that suppressing pyramidal neurons during this interval would have the opposite effect. Indeed, post-gap suppression of CaMKII neurons following gaps of ≤10ms significantly reduced startle attenuation (i.e., impaired gap detection; Fig. 3D). No effects were seen following gaps of 25ms or 50ms. The effect was more pronounced with the higher laser intensity (1000mW/mm2, Fig. 3E). The MGT of 4ms was not affected at either intensity. Suppressing CaMKII neurons during the pre-gap interval conversely decreased startle amplitudes (Fig. 3F), indicating improved gap detection. Prolonged suppression again produced no effect (Fig. 3G). Laser illumination had no effect on Arch-negative CaMKII littermate controls (Fig. 3H).
Figure 3. Optogenetic suppression of CaMKII-expressing principal neurons reduces gap detection.

A) Dual fluorescent in situ hybridization shows co-localization of CaMKII and Arch. White boxes show the laminar position of the high magnification photos (“LI”: layer I; “wm”: white matter). 64% of CaMKII-positive neurons were positive for Arch (n = 5 sections, 5 mice). B) Arch expression was distributed across cortical layers (data averaged across 5 sections from 5 mice). Error bars show S.E.M. C) To confirm that Arch suppressed spiking activity in PNs, we recorded single-unit and multi-unit activity in anesthetized CaMKII mice. Illustrated is an example multi-unit recording from an anesthetized CaMKII animal. Top: raster plot of responses to a 25ms white noise burst (black bar), grouped by “laser off” and “laser on” trials (green shading: 300mW/mm2). Bottom: same data, shown as mean firing (black: “laser off”, green: “laser on”; 5ms bins). Illumination significantly suppressed driven (0-100ms) and spontaneous (-100-0ms) spiking activity (note the complete absence of spikes during suppression). Efficacy was verified in 5 mice. Illumination (300mW/mm2) significantly suppressed sound-evoked spiking activity in 16/22 (72%) recordings, and suppressed spontaneous activity in 20/22 (90%) recordings. D-H) Gap detection behavior. The green bar at the top of panels indicates the laser duration relative to Gap and Startle stimuli; green stars indicate significance within the ANOVA; error bars are S.E.M. D) Post-gap suppression, low intensity: Suppressing principal neurons during the post-gap interval significantly increased startle responses following gaps of ≤10ms [interaction F(5,1550) = 2.75, p = .018; 3 mice, 13 sessions], but not 25ms or 50ms (2 mice, 7 sessions; 3 mice, 9 sessions). Gray symbols correspond to the 0ms gap presentations during separate assessment of 25ms or 50ms gap detection. E) Post-gap suppression, high intensity: Increasing the laser intensity to 1000mW/mm2 robustly increased the startle enhancement following gaps ≤10ms [main effect F(1,382) = 9.51, p = .002; 3 mice, 16 sessions]. F) Pre-gap suppression, low intensity: Suppression restricted to the pre-gap interval significantly reduced startles following gaps ≤10ms [main effect F(1,238) = 5.107, p = .025; 2 mice, 10 sessions]. G) Prolonged suppression, low intensity: Prolonged suppression did not significantly influence detection of gaps ≤10ms (4 mice, 10 sessions). H) Gap detection was unaffected by the laser in Archnegative CaMKII littermate controls (open circles; 2 mice, 8 sessions).
A Circuit Model for Gap Detection
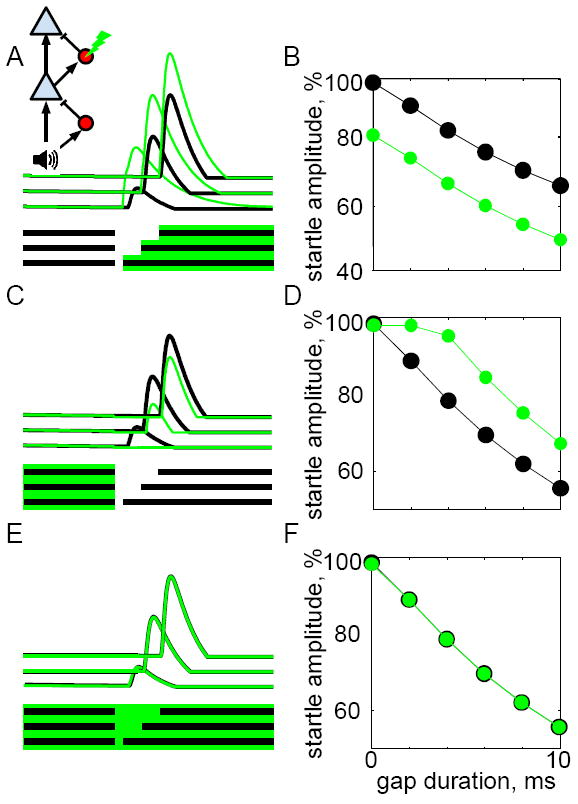
We found that increasing or decreasing the activity of pyramidal neurons during either the pre-gap or post-gap periods caused opposing effects on gap detection, whereas prolonged suppression throughout the pre- and post-gap period had no effect. This suggests the existence of a process that compares post-gap activity to pre-gap activity. One simple yet biologically plausible mechanism that could perform such a comparison is a circuit that subtracts the recent history of PNs. Inhibitory interneurons would be well-suited to this operation, but other forms of adaptation (such as synaptic depression) could perform similar operations. To test whether such a mechanism could account for our results, we constructed a simple neural model which is schematized in Figure 4A (inset). Sound input is passed sequentially through two PNs; at each step an inhibitory interneuron (shown in red) computes a running average of its recent input and provides subtractive inhibition. This circuit motif produced GTRs that depended on gap duration (Fig. 4A, black lines). The final PN output proportionally reduced startle responses, so that the model simulated gap detection with the same units (% startle amplitude) as our behavioral data. The model accurately captured how startle amplitude is progressively decreased by longer gaps (Fig. 4B, black points).
Figure 4. A simple circuit model reproduces the neural and behavioral effects of optogenetically suppressing pyramidal neurons (PNs).
A) Inset: in the circuit model, sound input is passed through two layers, each consisting of a PN (blue triangle) and an IN (interneuron: red circle). The IN computes an exponentially weighted running average of its input, and produces a subtractive output to its target. Optogenetic suppression of the lower PN is indicated by a lightning bolt symbol and was simulated by a subtractive term. Gap stimuli are indicated by horizontal black bars; gaps of 2, 6, and 10ms are shown. Black lines show the responses of the upper PN to each gap stimulus; green lines show the same responses when simulated optogenetic suppression was applied during the time indicated by the green shaded region below. Note that post-gap suppression reduced the PN gap termination response. B) We modeled behavioral gap detection readout (black symbols) by reducing startle amplitude proportional to the amplitude of the PN gap termination response. Green symbols show gap detection during suppression of the post-gap period as indicated in (A). Compare to Figure 3D-E. C-D) Suppression applied during the pre-gap period had the opposite effect of increasing PN gap termination responses (C), and enhancing gap detection (D). E-F) Prolonged suppression applied during the entire pre- and post-gap period had no effect on PN responses (E) or gap detection performance (F).
We simulated optogenetic suppression of PNs as a subtractive term indicated by green shaded regions in Figs. 4A,C,E. Post-gap suppression reduced the GTR (Fig. 4A, green lines), producing a gap detection deficit (i.e., increased startle amplitude, green symbols in Fig. 4B). This qualitatively matches the gap detection deficit that was caused by suppressing PNs in mice (Fig. 3D,E). When we instead applied PN suppression to the pre-gap period, the GTR was actually enhanced, as shown by the green lines in Figure 4C. This enhancement can be thought of as a type of rebound from inhibition. When pre-gap PN activity is optogenetically reduced, the amount of inhibition is also reduced. This inhibition remains reduced during the post-gap period, because the weighted running average continues to be affected by pre-gap PN activity. This reduced inhibition increases post-gap PN activity and enhances gap detection performance (Fig. 4D), which matches the results in mice (Fig. 3F). Finally, we simulated prolonged suppression throughout the pre- and post-gap periods (Fig. 4E). Here, suppression had no effect on PN responses or simulated gap detection behavior (Fig. 4F), similar to what we observed in mice (Fig. 3G). This makes sense, because the gap detection circuit motif is sensitive only to changes in activity. Prolonged optogenetic suppression merely adds a constant offset to activity in the circuit, which is removed by the inhibitory interneurons, producing no net effect. This pattern of results was qualitatively unchanged across a wide range of model parameters, and even different model architectures (see Supplemental Methods), as long as the circuit included an inhibitory interneuron sensitive to recent history. These results suggest that this simple and biologically plausible circuit motif could explain the opposing effects caused by suppressing PNs during different task epochs.
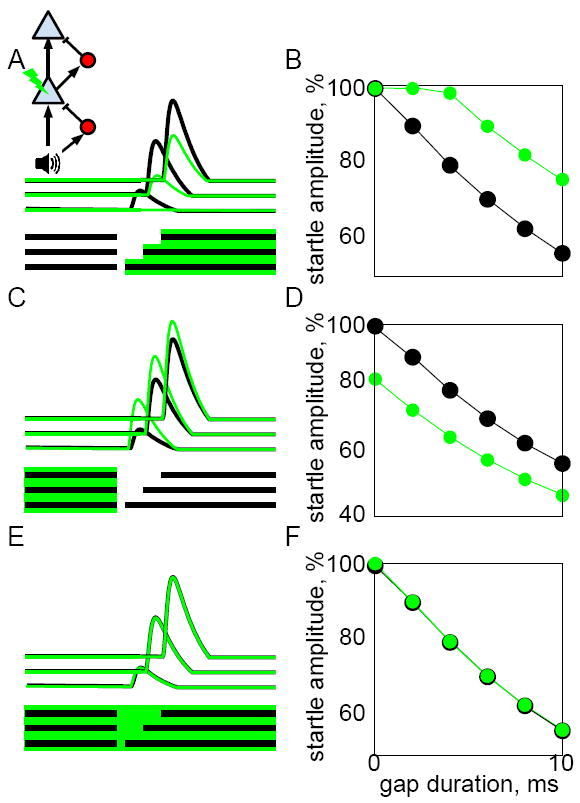
The same circuit model also accounted for the effects of suppressing inhibitory interneurons (Fig. 5). Here, we simulated suppressing SOM or PV cells by applying a subtractive term to the second interneuron (red cell in Fig. 5A, inset). This produced the opposite pattern of results as suppressing PNs: suppressing INs during the post-gap period enhanced the PN GTR (Fig. 5A), thereby enhancing gap detection (i.e., reducing startle amplitudes, Fig. 5B). This makes sense, because removing inhibition during the post-gap interval should directly increase the strength of the GTR. Suppressing INs during the pre-gap period decreased the PN GTR (Fig. 5C) and thereby decreased gap detection (Fig. 5D). Intuitively, this occurs because suppressing INs causes elevated PN activity during the pre-gap period, which in turn leads to excess inhibition in the post-gap period after INs are released from suppression. Prolonged suppression of INs during the pre- and post-gap periods produced no net effect on PN activity or behavioral output, for the same reason that prolonged suppression of PNs has no effect in the change-detection circuit. If INs mediate the comparison that subserves gap detection, as we propose, why then does suppressing them not eliminate gap detection? While complete suppression (as with a lesion) would indeed eliminate gap detection according to our model, our partial optogenetic suppression instead affects the gain of cortical responses while still allowing residual IN function to mediate the subtractive comparison. Alternatively, the comparison could be mediated by another form of adaptation, such as synaptic depression.
Figure 5. A simple circuit model reproduces the neural and behavior effects of optogenetically suppressing inhibitory interneurons (INs).
A-B) Inset: Same circuit model as in Fig. 6A, but optogenetic suppression was applied to the upper cortical interneuron (red circle with lightning bolt symbol). Format is as in Figure 4. Post-gap suppression of the IN increased the pyramidal neuron (PN) gap termination response (A) and enhanced gap detection performance (B). Compare to Figure 1D-E. C-D) Suppression applied during the pre-gap period had the opposite effect of decreasing PN gap termination responses (C), and impairing gap detection (D). E-F) Prolonged suppression applied during the entire pre- and post-gap period had no effect on PN responses (E) or gap detection performance (F).
DISCUSSION
Gap detection is a measure of auditory temporal acuity and a model for speech perception. Detection of brief gaps, which are analogous to the dips in spectrotemporal energy occurring within and between phonemes in speech, is cortically dependent, although the mechanisms underlying this process have remained unclear. Here we provide evidence suggesting a causal link between the cortical gap termination response (GTR) and perceptual gap detection. By optogenetically manipulating neural activity specifically during the interval containing the GTR, we altered the gap-induced attenuation of startle responses. Suppressing cortical pyramidal neuron activity reduced perceptual gap detection, whereas suppressing cortical PV or SOM inhibitory interneurons enhanced gap detection. Suppression had no effect on pre-pulse inhibition, indicating that the effects we observed were specific for gap detection. In general, manipulating cortical activity affected the degree of startle attenuation without affecting the MGT, suggesting that cortical manipulation affects gap salience rather than temporal acuity (although PV suppression at higher intensities did reduce the MGT). Furthermore, by suppressing activity either before the gap, directly after the gap, or both, we demonstrate that gap perception involves a comparison between pre- and post-gap neuronal activity. These results are summarized in Table 1. Finally, we show that a simple yet biologically plausible neural model implementing such a comparison can reproduce these results. These findings illustrate how shifts in the balance of cortical activity directly impact auditory processes that may be involved in speech perception.
Table 1.
Behavioral summary by suppression protocol.
| Post-Gap Suppression | Pre-Gap Suppression | Prolonged Suppression | |
|---|---|---|---|
|
|
|
|
|
| SOM | Decreases Startle | Increases Startle | No Effect |
| PV | Decreases Startle | Increases Startle* | No Effect |
| CaMKII | Increases Startle | Decreases Startle | No Effect |
non-significant trend
Importantly, our experimental design rules out the possibility of non-specific suppression effects, or that laser illumination acted as a visual cue. Because of the temporal precision with which we could suppress neural activity, we were able to show distinct and opposing effects of neural suppression before and after the gap, as well as the null effect of suppressing activity across both intervals. Furthermore, we saw these effects at 300mW/mm2, for which suppression was restricted to auditory cortex. This spatial and temporal specificity of suppression supports a causal role of the GTR in auditory cortex for gap detection. We can rule out the possibility that the laser acted as a visual cue with two observations. First, we saw no effect of light delivery in control animals (littermates not expressing Arch). Second, there was no effect of laser for a gap of 0ms (i.e., no gap). Suppression only affected behavior when coupled with the presentation of a gap, and therefore in and of itself did not modify startle responses. The effect of suppression was modest (7-10% at 300mW/mm2, 10-16% at 1000 mW/mm2), but was within the range reported for other paradigms that measure effects on startle response [e.g., 28].
In auditory cortex, transient onset responses can distinguish between similar sounds such as phonemes [29-33]. Onset responses following gaps in noise (i.e., GTRs) increase with gap duration [12]. This scaling of response amplitude may provide one of the critical cues for accurate perception of phonemes and other sounds. Our results support this idea. By increasing or decreasing the GTR, we evoked startle responses characteristic of shorter or longer gaps, respectively. For example, startles elicited by a 4ms gap during SOM suppression were comparable to startles elicited by an 8ms gap in control conditions. These results not only indicate a change in gap perception, but also demonstrate how the GTR encodes the temporal properties of auditory events. This has important implications for age-related hearing loss, since both PV and SOM inhibition decline with age [34-37]. The loss of inhibition with age may not just generally disrupt temporal processing, but may specifically shift perception (such that an 8ms gap, for example, is perceived as a 4ms gap). This could cause misclassification of phonemes that are distinguished by parametric variation in temporal structure, such as voice-onset time. Since both onset and offset responses in auditory cortex are frequency tuned [38]; it will be also interesting to see if these results that we obtained using gaps in broadband noise also generalize to tones of a specific frequency.
While our data support a role for auditory cortex in brief gap detection, the effects we observed for PN suppression during the post-gap interval (Fig. 3D) were modest compared with those obtained using conventional lesion techniques [7-9]. The most likely explanation for this is that our CaMKII-Arch optogenetic system suppressed spiking by between 8-73% (Fig. S3), depending on the distance from the fiber tip, at a laser intensity of 300mW/mm2. Therefore, the GTR was not completely silenced in our experiments, but rather was reduced in amplitude, resulting in incomplete disruption of gap detection. The greater neural and behavioral suppression seen with 1000mW/mm2 (Figs. 3E and S3B) supports this explanation. Lesion and inactivation studies have shown that auditory cortex is necessary for detection of brief (≤50ms) gaps, but not longer gaps, indicating that non-cortical brain regions can mediate longer gap detection [7-9]. By demonstrating that our manipulation only affected responses to brief gaps (≤25ms) but not longer gaps (50ms), our data confirm cortical involvement in processing these brief events.
How might auditory cortex mediate these effects on gap detection? Startle responses are mediated by a brainstem circuit in which the cochlear nucleus projects to motor neurons via the nucleus reticularis pontis caudalis (PnC; [39]). Pre-pulse inhibition, such as that involved with our gap detection task, is thought to act via a circuit from the inferior colliculus (IC), to the superior colliculus (SC), to the cholinergic pedunculo-pontine tegmental area (PPTg), which suppresses pre-motor activity in the PnC [40]. Layer 5 neurons in auditory cortex project to IC, SC, and the PPTg [40], and these corticofugal projections would therefore be well-suited to mediate cortical effects on gap detection. One might ask why there should be a role for auditory cortex in gap detection, given that IC neurons also have GTRs and are directly involved in the pre-pulse inhibition circuit. We speculate that auditory cortex may provide the ability to associate gaps or other temporally structured sounds (such as phonemes) with meaning, and that associative learning in auditory cortex may be able to impact behavioral output by means of its corticofugal projections to IC, SC, PPTg, and related structures.
One of the unexpected findings from our study was the evidence of active comparison of pre- and post-gap activity in gap detection. It seems likely that this is mediated by some form of adaptation, which strongly shapes cortical responses to auditory events [41-44]. We illustrated how this could work using a simple neural circuit model in which the recent history of pyramidal neurons is subtracted by inhibitory neurons, although other forms of adaptation (such as synaptic depression) could also perform similar operations. This circuit motif qualitatively reproduced both the basic properties of gap detection as well as the opposing effects of our optogenetic manipulations of the circuit. This qualitative agreement suggests that gap detection indeed involves a comparison mechanism, but it should be noted that there are some quantitative differences between behavioral and model performance (e.g. between Figs. 1D-E & 5B), which suggests that additional mechanisms must be at play. While cortical circuits are undoubtedly more complex than our model, our results provide a plausible biological mechanism for performing a comparison of spiking activity between pre- and post-gap periods. The model also makes testable predictions about the gap response properties of pyramidal and inhibitory neurons at different positions in the circuit. It will be of great interest to test these predictions by recording from these cell types in auditory cortex during optogenetic manipulation of gap detection behavior.
We found that reducing inhibition led to an increase in PN GTR amplitude (Figs. 1C, 2C), which improved gap detection (Figs. 1D-E, 2D-E). However, it is still unclear whether the critical effect of reducing inhibition is to increase PN firing rate (i.e., a gain change), or instead to alter the temporal structure of PN responses, or both. In light of the known roles of interneurons in controlling the timing of PN spiking activity [24, 44, 45], it will be very interesting to examine how INs shape the temporal dynamics of PN gap responses, and how perceptual gap detection depends on that temporal structure.
METHODS
Animals
All procedures were performed in strict accordance with the National Institutes of Health guidelines, as approved by the University of Oregon Institutional Animal Care and Use Committee. See Supplemental Information for detailed surgical procedures.
We measured gap detection behavior in heterozygous offspring (both males and females) of crosses between a cre-dependent Arch line, CAG-Arch-eGFP, and two interneuron lines: Pvalb-IRES-Cre (“PV”, n = 5), or SOM-IRES-Cre (“SOM”, n = 9). We also measured behavior in mice expressing Arch in pyramidal neurons by crossing a CaMKII-tTA line (“CaMKII”, n = 6) to a tTA-dependent Arch line, which we report here for the first time. The generation of the line is described in Supplemental Information (“tetO-ArchT2 Generation”). Arch-negative littermates were used as behavioral controls (PV, n = 2; SOM, n = 3, CaMKII, n = 2). Data were collected from a total of 70 mice, including those used in additional electrophysiological and anatomical expression experiments detailed below and in Supplemental Information. Mean age was 10 ± 0.3 weeks (SE), well under the age at which C57BL/6J mice become susceptible to age-related hearing loss [46].
Behavioral Experiments
Fiber Implantation
All mice assessed for gap detection were chronically implanted with a pair of 200μm optic fibers bilaterally targeting primary auditory cortex using coordinates derived from cortical mapping experiments (see Supplemental Information “Fiber Implantation”, “Fiber Coordinate Mapping” and Fig. S2 for details).
Data Acquisition and Stimuli
All behavioral data were collected in a sound-attenuating chamber. Sounds were delivered from a free-field speaker facing the animal’s right ear. Mice were loosely restrained in a plastic tube with a flat base. To measure startle responses, movement signals from a piezo transducer beneath the tube were amplified 200x and digitized at 10 kHz.
White noise served as both the continuous background (80dB SPL) and startle stimulus (25ms burst, 100dB SPL). Startle stimuli were separated by a random intertrial interval of 15 ± 5s. Gaps in the continuous background noise preceded the startle stimulus, separated by a 50ms ISI. Gap detection was assessed for gaps of 0, 2, 4, 6, 8, 10, 25 and 50ms. Optogenetic suppression of neural activity was applied on alternating trials.
We used three different optogenetic suppression protocols. “Post-gap” suppression targeted the interval between gap offset and startle stimulus onset (for example, see Fig. 1D). “Pre-gap suppression began 1000ms prior to startle onset, and terminated with gap onset (see Fig. 1F). “Prolonged” suppression began 1000ms prior to, and terminated with, startle onset, resulting in suppression during both “pre-gap” and “post-gap” intervals (see Fig. 1G). The light intensity was 300mW/mm2 at the fiber tip (i.e. 9.4mW of total power through each 200μm fiber), except where use of the alternative higher intensity of 1000mW/mm2 is indicated (31.4mW total power).
Analysis
We quantified startle amplitudes by integrating the rectified piezo signal within a 100ms window following startle onset. Startle amplitudes were normalized within sessions to the mean laser “off” 0ms gap startle amplitude. Our goal in these experiments was to ascertain whether the suppression of neural activity altered gap-attenuation of startle responses. Therefore, only data from sessions with a significant (paired t-test, p<.05) attenuation of startle responses between the 0ms and the longest “laser off” gaps (10, 25, or 50ms) were included in the group analyses. Data were collected from multiple sessions across days for each mouse. All comparisons were performed using data from individual trials. Repeated-measures Analyses of Variance were performed to identify group differences and interactions by gap duration. T-tests were performed to assess differences in startle amplitude both between and within gaps. A Bonferroni correction for multiple comparisons was applied for minimum gap threshold (MGT) tests, resulting in a minimum significance thresholds of p < 0.01. MGTs were determined by comparing gaps of 2-10ms with 0ms gap presentations separately for “laser on” and “laser off” trials, and were defined as the shortest gap duration eliciting a significant reduction in startle amplitude. Note that gaps below the MGT were unaffected by suppression, whereas detection of gaps longer than the MGT were typically affected by suppression. A significant effect of suppression can therefore be indicated by either an ANOVA interaction or a main effect. Startle response amplitudes were not normally distributed (Lilliefors test), but we note that the ANOVA is very robust to deviations from normality [47], and also that our pattern of results was very similar when we used non-parametric tests (see Table S1).
Electrophysiological Experiments
We performed four types of electrophysiological experiments. First, we determined the optimal fiber coordinates for delivering light to the auditory cortex of C57BL/6 mice (see Supplemental Information “Fiber Coordinate Mapping”; Fig. S2). Second, we confirmed that Arch activation had the expected effect on neural activity in auditory cortex in the three lines used in the behavioral experiments (see Supplemental Information “Electrophysiological Verification”). Third, we determined the working range of light power for suppressing activity in auditory cortex, using optical fibers implanted as in our behavioral animals (see Supplemental Information “Light Intensity Mapping”; Fig. S3). Fourth, we demonstrated that optogenetic suppression of neural activity significantly affects the amplitude of the gap termination response (see Supplemental Information “GTR Manipulation”; Fig. S4).
Circuit Model
We implemented a simple circuit model that qualitatively captured the structure of our results. The model (Fig. 4A, inset) consisted of a sound envelope, which served as input to a pyramidal (excitatory) neuron (PN) and an inhibitory interneuron (IN). The inhibitory neuron integrated its input with an exponentially weighted time window. The PN integrated the sound input and subtractive inhibition [41]. The PN output then served as input to a second PN and IN pair, identical to the first. Behavioral performance depended on the output of the second PN. We modeled optogenetic suppression as a subtractive term applied to either the first PN (Fig. 4A, inset), or the second IN (Fig. 5A, inset). For full details of the model see Supplemental Information, “Circuit Model.”
Histology
All fiber placements were verified postmortem. Brains were fixed in 4% paraformaldehyde and then sectioned at 50μm. The presence of eGFP fluorescence and the appropriate location of optic fiber tracks were both confirmed.
We assessed the specificity of Arch expression using the co-localization of native GFP fluorescence and antibody-labeled inhibitory markers (PV, SOM), or, for the CaMKIIa cross, the co-localization of ArchT2 mRNA and CaMKIIa mRNA, visualized by in situ hybridization. All tissue processing and quantification procedures are described in Supplemental Information “Histological Procedures”.
Supplementary Material
HIGHLIGHTS.
Suppressing auditory cortex immediately after a gap in noise impairs gap detection.
Suppressing cortical inhibition after a gap improves perceptual gap detection.
Manipulations prior to the gap have the opposite behavioral effects.
Gap detection thus involves a comparison of auditory cortical activity before and after the gap.
Acknowledgments
We would like to thank Jennifer Linden for fruitful discussion. This work was supported by the NIH (1R01DC011379).
Footnotes
Author Contributions:
APW – designed and performed experiments, performed analysis, wrote paper
CL – performed experiments and histology
AKM – performed experiments and analysis
LD – generated CaMKII line
HW – performed in situ hybridizations
CK – designed CaMKII line
MW – designed experiments, performed analysis and modeling, wrote paper
References
- 1.Helfer KS, Vargo M. Speech recognition and temporal processing in middle-aged women. J Am Acad Audiol. 2009;20:264–271. doi: 10.3766/jaaa.20.4.6. [DOI] [PMC free article] [PubMed] [Google Scholar]
- 2.Ben-David BM, Chambers CG, Daneman M, Pichora-Fuller MK, Reingold EM, Schneider BA. Effects of aging and noise on real-time spoken word recognition: evidence from eye movements. J Speech Lang Hear Res. 2011;54:243–262. doi: 10.1044/1092-4388(2010/09-0233). [DOI] [PubMed] [Google Scholar]
- 3.Ohlemiller KK. Age-related hearing loss: the status of Schuknecht’s typology. Curr Opin Otolaryngol Head Neck Surg. 2004;12:439–443. doi: 10.1097/01.moo.0000134450.99615.22. [DOI] [PubMed] [Google Scholar]
- 4.Harris KC, Wilson S, Eckert MA, Dubno JR. Human evoked cortical activity to silent gaps in noise: effects of age, attention, and cortical processing speed. Ear Hear. 2012;33:330–339. doi: 10.1097/AUD.0b013e31823fb585. [DOI] [PMC free article] [PubMed] [Google Scholar]
- 5.Suta D, Rybalko N, Pelanova J, Popelar J, Syka J. Age-related changes in auditory temporal processing in the rat. Exp Gerontol. 2011;46:739–746. doi: 10.1016/j.exger.2011.05.004. [DOI] [PubMed] [Google Scholar]
- 6.Walton JP, Barsz K, Wilson WW. Sensorineural hearing loss and neural correlates of temporal acuity in the inferior colliculus of the C57BL/6 mouse. J Assoc Res Otolaryngol. 2008;9:90–101. doi: 10.1007/s10162-007-0101-z. [DOI] [PMC free article] [PubMed] [Google Scholar]
- 7.Ison JR, O’Connor K, Bowen GP, Bocirnea A. Temporal resolution of gaps in noise by the rat is lost with functional decortication. Behav Neurosci. 1991;105:33–40. doi: 10.1037//0735-7044.105.1.33. [DOI] [PubMed] [Google Scholar]
- 8.Syka J, Rybalko N, Mazelova J, Druga R. Gap detection threshold in the rat before and after auditory cortex ablation. Hear Res. 2002;172:151–159. doi: 10.1016/s0378-5955(02)00578-6. [DOI] [PubMed] [Google Scholar]
- 9.Threlkeld SW, Penley SC, Rosen GD, Fitch RH. Detection of silent gaps in white noise following cortical deactivation in rats. Neuroreport. 2008;19:893–898. doi: 10.1097/WNR.0b013e3283013d7e. [DOI] [PMC free article] [PubMed] [Google Scholar]
- 10.Okanoya K, Dooling RJ. Detection of gaps in noise by budgerigars (Melopsittacus undulatus) and zebra finches (Poephila guttata) Hear Res. 1990;50:185–192. doi: 10.1016/0378-5955(90)90044-p. [DOI] [PubMed] [Google Scholar]
- 11.Plomp R. Rate of decay of auditory sensation. J Acoust Soc Am. 1964;36:277–282. [Google Scholar]
- 12.Recanzone GH, Engle JR, Juarez-Salinas DL. Spatial and temporal processing of single auditory cortical neurons and populations of neurons in the macaque monkey. Hear Res. 2011;271:115–122. doi: 10.1016/j.heares.2010.03.084. [DOI] [PMC free article] [PubMed] [Google Scholar]
- 13.Eggermont JJ. The magnitude and phase of temporal modulation transfer functions in cat auditory cortex. J Neurosci. 1999;19:2780–2788. doi: 10.1523/JNEUROSCI.19-07-02780.1999. [DOI] [PMC free article] [PubMed] [Google Scholar]
- 14.Boyden ES, Zhang F, Bamberg E, Nagel G, Deisseroth K. Millisecond-timescale, genetically targeted optical control of neural activity. Nat Neurosci. 2005;8:1263–1268. doi: 10.1038/nn1525. [DOI] [PubMed] [Google Scholar]
- 15.Berger TK, Silberberg G, Perin R, Markram H. Brief bursts self-inhibit and correlate the pyramidal network. PLoS Biol. 2010;8 doi: 10.1371/journal.pbio.1000473. [DOI] [PMC free article] [PubMed] [Google Scholar]
- 16.Cruikshank SJ, Lewis TJ, Connors BW. Synaptic basis for intense thalamocortical activation of feedforward inhibitory cells in neocortex. Nat Neurosci. 2007;10:462–468. doi: 10.1038/nn1861. [DOI] [PubMed] [Google Scholar]
- 17.Fino E, Yuste R. Dense inhibitory connectivity in neocortex. Neuron. 2011;69:1188–1203. doi: 10.1016/j.neuron.2011.02.025. [DOI] [PMC free article] [PubMed] [Google Scholar]
- 18.Silberberg G, Markram H. Disynaptic inhibition between neocortical pyramidal cells mediated by Martinotti cells. Neuron. 2007;53:735–746. doi: 10.1016/j.neuron.2007.02.012. [DOI] [PubMed] [Google Scholar]
- 19.Sohal VS, Zhang F, Yizhar O, Deisseroth K. Parvalbumin neurons and gamma rhythms enhance cortical circuit performance. Nature. 2009;459:698–702. doi: 10.1038/nature07991. [DOI] [PMC free article] [PubMed] [Google Scholar]
- 20.Ma Y, Hu H, Berrebi AS, Mathers PH, Agmon A. Distinct subtypes of somatostatin-containing neocortical interneurons revealed in transgenic mice. J Neurosci. 2006;26:5069–5082. doi: 10.1523/JNEUROSCI.0661-06.2006. [DOI] [PMC free article] [PubMed] [Google Scholar]
- 21.Adesnik H, Bruns W, Taniguchi H, Huang ZJ, Scanziani M. A neural circuit for spatial summation in visual cortex. Nature. 2012;490:226–231. doi: 10.1038/nature11526. [DOI] [PMC free article] [PubMed] [Google Scholar]
- 22.Wang Y, Toledo-Rodriguez M, Gupta A, Wu C, Silberberg G, Luo J, Markram H. Anatomical, physiological and molecular properties of Martinotti cells in the somatosensory cortex of the juvenile rat. J Physiol. 2004;561:65–90. doi: 10.1113/jphysiol.2004.073353. [DOI] [PMC free article] [PubMed] [Google Scholar]
- 23.Kawaguchi Y, Shindou T. Noradrenergic excitation and inhibition of GABAergic cell types in rat frontal cortex. J Neurosci. 1998;18:6963–6976. doi: 10.1523/JNEUROSCI.18-17-06963.1998. [DOI] [PMC free article] [PubMed] [Google Scholar]
- 24.Moore AK, Wehr M. Parvalbumin-expressing inhibitory interneurons in auditory cortex are well-tuned for frequency. J Neurosci. 2013;33:13713–13723. doi: 10.1523/JNEUROSCI.0663-13.2013. [DOI] [PMC free article] [PubMed] [Google Scholar]
- 25.Li LY, Xiong XR, Ibrahim LA, Yuan W, Tao HW, Zhang LI. Differential Receptive Field Properties of Parvalbumin and Somatostatin Inhibitory Neurons in Mouse Auditory Cortex. Cereb Cortex. 2014 doi: 10.1093/cercor/bht417. [DOI] [PMC free article] [PubMed] [Google Scholar]
- 26.Yuan K, Shih JY, Winer JA, Schreiner CE. Functional networks of parvalbumin-immunoreactive neurons in cat auditory cortex. J Neurosci. 2011;31:13333–13342. doi: 10.1523/JNEUROSCI.1000-11.2011. [DOI] [PMC free article] [PubMed] [Google Scholar]
- 27.Ochiishi T, Terashima T, Yamauchi T. Specific distribution of Ca2+/calmodulin-dependent protein kinase II alpha and beta isoforms in some structures of the rat forebrain. Brain Res. 1994;659:179–193. doi: 10.1016/0006-8993(94)90877-x. [DOI] [PubMed] [Google Scholar]
- 28.Berg WK, Davis M. Associative learning modifies startle reflexes at the lateral lemniscus. Behav Neurosci. 1985;99:191–199. doi: 10.1037//0735-7044.99.2.191. [DOI] [PubMed] [Google Scholar]
- 29.Brugge JF, Merzenich MM. Responses of neurons in auditory cortex of the macaque monkey to monaural and binaural stimulation. J Neurophysiol. 1973;36:1138–1158. doi: 10.1152/jn.1973.36.6.1138. [DOI] [PubMed] [Google Scholar]
- 30.DeWeese MR, Wehr M, Zador AM. Binary spiking in auditory cortex. J Neurosci. 2003;23:7940–7949. doi: 10.1523/JNEUROSCI.23-21-07940.2003. [DOI] [PMC free article] [PubMed] [Google Scholar]
- 31.Eggermont JJ. Neural correlates of gap detection in three auditory cortical fields in the Cat. J Neurophysiol. 1999;81:2570–2581. doi: 10.1152/jn.1999.81.5.2570. [DOI] [PubMed] [Google Scholar]
- 32.Phillips DP, Hall SE, Boehnke SE. Central auditory onset responses, and temporal asymmetries in auditory perception. Hear Res. 2002;167:192–205. doi: 10.1016/s0378-5955(02)00393-3. [DOI] [PubMed] [Google Scholar]
- 33.Engineer CT, Perez CA, Chen YH, Carraway RS, Reed AC, Shetake JA, Jakkamsetti V, Chang KQ, Kilgard MP. Cortical activity patterns predict speech discrimination ability. Nat Neurosci. 2008;11:603–608. doi: 10.1038/nn.2109. [DOI] [PMC free article] [PubMed] [Google Scholar]
- 34.Gleichmann M, Zhang Y, Wood WH, 3rd, Becker KG, Mughal MR, Pazin MJ, van Praag H, Kobilo T, Zonderman AB, Troncoso JC, et al. Molecular changes in brain aging and Alzheimer’s disease are mirrored in experimentally silenced cortical neuron networks. Neurobiol Aging. 2012;33:205 e201–218. doi: 10.1016/j.neurobiolaging.2010.08.012. [DOI] [PMC free article] [PubMed] [Google Scholar]
- 35.Martin del Campo HN, Measor KR, Razak KA. Parvalbumin immunoreactivity in the auditory cortex of a mouse model of presbycusis. Hear Res. 2012;294:31–39. doi: 10.1016/j.heares.2012.08.017. [DOI] [PubMed] [Google Scholar]
- 36.Ouda L, Druga R, Syka J. Changes in parvalbumin immunoreactivity with aging in the central auditory system of the rat. Exp Gerontol. 2008;43:782–789. doi: 10.1016/j.exger.2008.04.001. [DOI] [PubMed] [Google Scholar]
- 37.Stanley EM, Fadel JR, Mott DD. Interneuron loss reduces dendritic inhibition and GABA release in hippocampus of aged rats. Neurobiol Aging. 2012;33:431 e431–413. doi: 10.1016/j.neurobiolaging.2010.12.014. [DOI] [PMC free article] [PubMed] [Google Scholar]
- 38.Scholl B, Gao X, Wehr M. Nonoverlapping sets of synapses drive on responses and off responses in auditory cortex. Neuron. 2010;65:412–421. doi: 10.1016/j.neuron.2010.01.020. [DOI] [PMC free article] [PubMed] [Google Scholar]
- 39.Lee Y, Lopez DE, Meloni EG, Davis M. A primary acoustic startle pathway: obligatory role of cochlear root neurons and the nucleus reticularis pontis caudalis. J Neurosci. 1996;16:3775–3789. doi: 10.1523/JNEUROSCI.16-11-03775.1996. [DOI] [PMC free article] [PubMed] [Google Scholar]
- 40.Li L, Du Y, Li N, Wu X, Wu Y. Top-down modulation of prepulse inhibition of the startle reflex in humans and rats. Neurosci Biobehav Rev. 2009;33:1157–1167. doi: 10.1016/j.neubiorev.2009.02.001. [DOI] [PubMed] [Google Scholar]
- 41.Dean I, Robinson BL, Harper NS, McAlpine D. Rapid neural adaptation to sound level statistics. J Neurosci. 2008;28:6430–6438. doi: 10.1523/JNEUROSCI.0470-08.2008. [DOI] [PMC free article] [PubMed] [Google Scholar]
- 42.Scholl B, Gao X, Wehr M. Level dependence of contextual modulation in auditory cortex. J Neurophysiol. 2008;99:1616–1627. doi: 10.1152/jn.01172.2007. [DOI] [PubMed] [Google Scholar]
- 43.Ulanovsky N, Las L, Farkas D, Nelken I. Multiple time scales of adaptation in auditory cortex neurons. J Neurosci. 2004;24:10440–10453. doi: 10.1523/JNEUROSCI.1905-04.2004. [DOI] [PMC free article] [PubMed] [Google Scholar]
- 44.Wehr M, Zador AM. Synaptic mechanisms of forward suppression in rat auditory cortex. Neuron. 2005;47:437–445. doi: 10.1016/j.neuron.2005.06.009. [DOI] [PubMed] [Google Scholar]
- 45.Atencio CA, Schreiner CE. Spectrotemporal processing differences between auditory cortical fast-spiking and regular-spiking neurons. J Neurosci. 2008;28:3897–3910. doi: 10.1523/JNEUROSCI.5366-07.2008. [DOI] [PMC free article] [PubMed] [Google Scholar]
- 46.Ison JR, Allen PD, O’Neill WE. Age-related hearing loss in C57BL/6J mice has both frequency-specific and non-frequency-specific components that produce a hyperacusis-like exaggeration of the acoustic startle reflex. J Assoc Res Otolaryngol. 2007;8:539–550. doi: 10.1007/s10162-007-0098-3. [DOI] [PMC free article] [PubMed] [Google Scholar]
- 47.Zar JH. Biostatistical analysis. 5. Upper Saddle River, N.J.: Prentice-Hall/Pearson; 2010. [Google Scholar]
Associated Data
This section collects any data citations, data availability statements, or supplementary materials included in this article.