

Abstract
Heart failure is characterized by a debilitating decline in cardiac function1, and recent clinical trial results indicate that improving the contractility of heart muscle cells by boosting intracellular calcium handling might be an effective therapy2,3. microRNAs (miRs) are dysregulated with heart failure4,5 but whether they control contractility or constitute therapeutic targets remain speculative. Using high throughput, functional screening of the human microRNAome, we identified miRs that suppress intracellular calcium handling in heart muscle by interacting with mRNA encoding the sarcoplasmic reticulum calcium uptake pump SERCA2a. Of 875 miRs tested, miR-25 potently delayed calcium uptake kinetics in cardiomyocytes in vitro and was upregulated in heart failure, both in mice and humans. Whereas AAV9-mediated overexpression of miR-25 in vivo resulted in a significant loss of contractile function, injection of an antisense oligonucleotide (antagomiR) against miR-25 dramatically halted established heart failure in a mouse model, improving cardiac function and survival relative to a control antagomiR. These data reveal that increased expression of endogenous miR-25 contributes to declining cardiac function during heart failure and suggests that it might be targeted therapeutically to restore function.
Keywords: heart failure, microRNAs, miRNAs, sarcoplasmic reticulum, SERCA2a, calcium
Heart failure is the culmination of diverse cardiovascular diseases, including hypertension, ischemic disease and atherosclerosis, valvular insufficiency, myocarditis, or contractile protein mutations, and is uniformly characterized by a progressive loss of contractile function and reserve1. The prevailing therapeutic strategy is to block the deleterious effects of the renin-angiotensin and sympathetic systems, but existing drugs target few mechanisms within the failing cardiomyocyte and there is a critical need for novel drugs especially in patients with advanced heart failure6,7. A complex intracellular network balances contractility and intracellular Ca2+ handling in relationship to workload8; however, the role of miRs in cardiac contractility remains largely unexplored. miRs fine-tune nearly all normal and pathological processes examined by downregulating proteins that occupy key nodal points in biological control networks9,10. We reasoned that miRs that repress contractility11 might be upregulated during human heart failure, and might therefore constitute novel targets for therapeutic intervention.
The calcium-transporting ATPase SERCA2a, also known as ATP2A2, is the primary mechanism for Ca2+ uptake during excitation–contraction coupling in cardiomyocytes. Impaired Ca2+ uptake resulting from decreased expression and reduced activity of SERCA2a is a hallmark of heart failure2. Accordingly, restoration of SERCA2a by gene transfer has proven effective in improving key parameters of heart failure in animal models12 and more recently in clinical trials13. Thus, miRs that downregulate SERCA2a might be elevated in heart failure and compromise cardiac function. Computational algorithms predict >300 miRs target SERCA2a (miRNA Data Integration Portal14), but are error-prone necessitating empirical evaluation15. We therefore functionally screened a whole-genome collection of miRs for selective downregulation of the Ca2+ pump. To perform the screen, we fused the SERCA2a mRNA 3’UTR sequence downstream of an eGFP coding region, making a “target sensor” construct to permit detection of active miRs by a decrease of eGFP fluorescence (Fig. 1a,b). In the primary screen, 144 miRs reduced eGFP fluorescence by >30% with P<0.05 (Fig. 1c,d), and 82 were confirmed by testing through a dose range (Fig. 1e,f, Supplementary Table 1). 32 were evolutionarily conserved and 15 were both evolutionarily conserved and reported to be upregulated in human heart failure (see Detailed Methods) (Fig. 1e). 4 caused a highly significant (P<0.001, one-tailed ANOVA) prolongation of the decay phase of the Ca2+ transient in the cardiomyocyte HL-1 cell line, shown here as duration from 75% to 25% maximal value, CaTD75-25 (Fig. 1g), measured using an automated platform16. The most potent was miR-25, which elicited a physiological effect comparable to that of siSERCA2a (Fig. 1h). We confirmed that miR-25 is upregulated in human myocardial samples from patients with severe heart failure (Fig. 1i). In situ hybridization revealed that miR-25 is expressed primarily in cardiomyocytes of TAC-induced failing mouse hearts, with no detectable expression in cardiac fibroblasts or vascular endothelial cells, and low expression in vascular smooth muscle (Fig. 2).
Figure 1. High content screening identifies miRs that control SERCA2a.

a,b. Target sensor construct (a) and screening workflow (b).
c. Screening summary.
d,e. Primary (d) and confirmatory (e) screen data plotted as % inhibition relative to siRNA against Serca2a (100% inhibition) and scrambled sequence control (0% inhibition) (X-axis) and P-value from Student’s t-test (Y-axis).
f. eGFP-SERCA2a inhibition by miR-25 and inactive miR-766 relative to scrambled sequence control n = 10.
g. Ca2+ transient kinetic analysis of HL-1 cells transfected with miRs that inhibited eGFP-SERCA2a (panel e) and are evolutionarily conserved and upregulated in human heart failure. CaTD75-25 is decay phase duration from 75% to 25% maximal value (n > 550 cells per group). Box = 25th to 75th percentiles; whiskers = 5th and 95th percentiles; dots = outliers. *, **, *** = P < 0.05, < 0.01, < 0.001. ns = not significant (one-tailed ANOVA).
h. Frequency distribution and log-normal curve fits for CaTD75-25 values from panel f, normalized to sample size. Both siSERCA2a and miR-25 increased CaTD75-25 values.
i. miR-25 is upregulated in human heart failure samples, by Q-PCR. Error bars = s.e.m. ** indicates P < 0.01 (n = 5), Student’s t-test. All replicates (n) are biological.
Figure 2. Endogenous miR-25 expression in the heart.

In situ hybridization revealing endogenous miR-25 expression in failing left ventricular myocardium (red) compared to periostin (a,a’), αSMA (b,b’) and lectin BS-1 (c,c’) staining (each in green). Hoechst 33342 staining marks nuclei (blue). Arrows indicate examples of non-cardiomyocytes. Scale bar equals 20 µm. Data are representative of 2 biological replicates.
To establish a link between miR-25 and cardiac function, we identified putative protein targets involved in Ca2+ handling computationally (DianaLab miRPath with TargetScan Mouse v5.0, see Methods). In addition to SERCA2a, these included inositol-3’-phosphate receptor-1 (IP3R1) that was selectively downregulated by miR-25 transient transfection in HL-1 cells (Fig. 3a, Extended Data Fig. 1a). Other candidate proteins involved in calcium handling, including the sodium-calcium exchanger (NCX1), calmodulin kinase-2 (CaMKII), phospholamban (PLN) and Calmodulin-3 (Calm3) were unaffected in HL-1 cells transfected with miR-25 (Extended Data Fig. 2). miRs bind cognate mRNAs by imprecise base pairing to specific recognition elements9,10. Single putative miR-25 recognition sites were identified within SERCA2a and IP3R1 3’UTR sequences by TargetScan Human v6.2 (Fig. 3b, Extended Data Fig. 1b). Mutation of these sequences abolished the ability of miR-25 to inhibit reporter expression (Fig. 3b, Extended Data Fig. 1b), further supporting selective miR-25 interactions with the mRNAs, and indicating that the single recognition elements identified in the 3’UTRs of the SERCA2a and IP3R1 are sufficient for miR-25 activity.
Figure 3. miR-25 directly targets SERCA2a and regulates contractile Ca2+ kinetics.

a. Effects of miR-25, anti-miR-25 and controls (scrambled sequence and SERCA2a siRNA) on SERCA2a protein levels.
b. Mutagenesis of the putative mir-25 recognition element in the SERCA2a mRNA 3’UTR abolished inhibition by miR-25. *, ** indicate P < 0.05 and 0.01 (n = 10) (Student’s t-test), compared to control.
c. Anti-miR-25 diminished the effect of miR-25 on CaTD75-25 in transfected HL-1 cells. siRNA to IP3R1 had a minimal effect. Extended Data Fig. 3 shows additional parameters and similar results using NRVCs. Box plots as in Fig. 1g. *,# indicate significant difference (* or # = P < 0.05, ** or ## = P < 0.01, *** or ### = P < 0.001, one-tailed ANOVA) from negative control (*) or miR-25 (#) (n > 550 cells per group).
d. Protocol for AAV9 cardiac gene transfer.
e. AAV-miR-25 (n = 4) and AAV-miR-92a (n = 5) increased levels of their respective microRNAs relative to AAV-VLP control (n = 3).
f–h. miR-25, but not miR-92a diminished SERCA2a protein levels (f) and fractional shortening (FS; percentage) following injection (n = 5 for each cohort; g). LV M-mode images (h).
I–k. Pronounced effect of miR-25 on pressure-volume relationship (i) and Pmax (j) showing decreased function relative to miR-92a and control AAV9; and the effect on Tau, the time constant for LV relaxation, suggestive of diastolic dysfunction (n = 5, AAV9-VLP; n = 4, AAV9-miR-25; n = 5, AAV9-miR-92a).
Data are represented as mean ± s.e.m in all panels except c. All replicates (n) are biological.
Having shown that miR-25 regulates SERCA2a and IP3R1, we evaluated whether siRNAs directed against these proteins could mimic the effect of miR-25 on cardiac Ca2+ transient kinetics in vitro. Transfection of siRNA against SERCA2a significantly slowed the decay (Ca2+ re-uptake) phase of the transient (CaTD75-25) relative to controls in spontaneously contracting HL-1 cells (Fig. 3c, Extended Data Fig. 1c) and neonatal rat ventricular cardiomyocytes (NRVCs, Extended Data Fig. 1d); however, the upstroke Vmax was unchanged (Extended Data Fig. 3), accurately reproducing the effect of miR-25 and mimicking the ~1.5-2x decline reported for ventricular cardiomyocytes isolated from failing human hearts17,18. siRNA against IP3R1 only minimally affected Ca2+ transient kinetics in HL-1 cells and not at all in NRVCs (CaTD50, CaTD75-25, and Ca2+ transient upstroke Vmax, (Fig. 3c, Extended Data Fig. 3), suggesting that the predominant effect of miR-25 on Ca2+ transient kinetics is mediated through downregulation of SERCA2a.
We evaluated the physiological effect of blocking miR-25. AntagomiRs are antisense oligonucleotides modified to enhance duplex stability and have been used effectively to inhibit miR function in vitro and in vivo19. Anti-miR-25 transfection alone decreased the Ca2+ transient duration (decreased CaTD75-25) in HL-1 cells but had no effect in NRVCs (Fig. 3c, Extended Data Fig. 1d). Importantly, when co-transfected, the anti-miR-25 cancelled the prolonging effect of miR-25 on CaTD75-25, restoring kinetic parameters to near normal in both cell types.
We next assessed the physiological consequences of administering miR-25 and anti-miR-25 in vivo. AAV9-mediated gene transfer of miR-25 increased the levels of miR-25 by approximately 50% and correspondingly decreased SERCA2a levels in ventricular myocardium (Fig. 3d–f), causing a progressive decline in fractional shortening (%FS), an index of cardiac function (Fig. 3g,h). Hemodynamic analyses at the termination of the studies (6 weeks after AAV transfer) confirmed that LV function had declined in miR-25-injected mice (Fig. 3i–k and Extended Data Fig. 4b,c). In contrast, AAV-transfer of miR-92a (Fig. 3d,e), which has the same seed sequence (AUUGCAC) as miR-25, did not affect SERCA2a levels (Fig. 3f) nor significantly affect LV function (Fig. 3g–k; Extended Data Fig. 4b,c), although it downregulated integrin α5, a target involved in angiogenesis20 (Extended Data Fig. 4a) despite identical copy number of integrated AAV genomes (Extended Data Fig. 5). Together, these results point to a selective interaction between miR-25 and SERCA2a mRNA that is consistent with the importance of non-seed sequences for target specificity21, and also indicate that elevated miR-25 can depress cardiac function. Evaluating selectivity and efficacy of anti-miR-25, we intravenously injected anti-miRs formulated with in vivo-jetPEI™ reagent mixture. Anti-miR-25 injection decreased endogenous miR-25 levels in LV myocardium of both WT and SERCA2a KO mice relative to treatment with a control (scrambled sequence) anti-miR (Extended Data Fig. 6a), but did not affect miR-92a (Extended Data Fig. 7). Accordingly, anti-miR-25 increased SERCA2a levels as expected in WT mice (Extended Data Fig. 6b). Notably, however, anti-miR-25 did not improve the cardiac morphometric or hemodynamic parameters of SERCA2a knockout mice (Extended Data Fig. 8), suggesting that the Ca2+ pump is a critical target for miR-25.
Since miR-25 decreased SERCA2a levels in vitro and in vivo, we evaluated whether administration of anti-miR-25 would affect cardiac function during chronic heart failure. Mice were subjected to 3 months of TAC to chronically increase LV load and cause LV dilation prior to administering anti-miR-25. Once heart failure was established, anti-miR-25 or control anti-miR were injected intravenously and subsequently monitored for effects on heart function (Fig. 4a). Echocardiography revealed substantial improvements in cardiac function following injection of anti-miR-25 at 4.5 and 5.5 months after TAC, despite constant pressure overload, compared with severe deterioration in animals injected with the control anti-miR (Fig. 4b,c and Supplementary Table 2). Furthermore, hemodynamic analyses at the termination of the studies (5.5 months post-TAC) showed substantially improved LV function in the anti-miR-25-injected mice, effectively restoring the load-independent parameter end systolic pressure volume relationship (ESPVR) and EF to normal levels (Fig. 4d–f and Supplementary Table 3). The heart-weight to body-weight ratio was also stabilized (Fig. 4g). Survival of the TAC-induced heart failure animals was also improved; with 7/8 anti-miR-25-injected and 8/8 sham-operated animals surviving versus 7/22 of the control anti-miR-injected animals (Kaplan Meier analysis, Extended Data Fig. 9), reflected by an increased probability of survival of TAC animals injected with anti-miR-25 versus control anti-miR (P = 0.0131, Log-rank test). Consistent with improved cardiac function, anti-miR-25-injected mice had significantly reduced levels of endogenous miR-25 compared to control animals (both TAC (Fig. 4h) and sham-operated (Extended Data Fig. 6a). Neither anti-miR-25 nor the control anti-miR affected the cardiac physiology of sham-operated animals (Extended Data Fig. 8). Total and SUMOylated SERCA2a levels were significantly increased (Fig. 4i and Extended Data Fig. 10), indicating that anti-miR-25 injection restored the loss of SERCA2a protein as well as post-translational modifications of SERCA2a such as SUMOylation (that improves transporter stability and ATPase activity22) despite the prior onset of heart failure. Furthermore, injection of anti-miR-25 reduced fibrosis (Fig. 4j–l, n–p, r–t, v) and also normalized cardiomyocyte cell size (Fig. 4m,q,u,w). Given that the anti-miR-25 had no salutary effect on cardiac morphometric or hemodynamic parameters in SERCA2a knockout mice (Extended Data Fig. 8), did not affect expression of other miRs with homologous seed sequences (Extended Data Fig. 7), and that AAV9-cardiac transfer of miR-25 selectively affected SERCA2a (Fig. 3f), we propose that the beneficial effect of anti-miR-25 is due to inhibition of pathologically upregulated endogenous miR-25 and subsequent restoration of SERCA2a activity. To our knowledge, these data provide the first evidence that cardiac delivery of an anti-miR can directly control SERCA2a protein levels in order to achieve long-term improvement of cardiac function.
Figure 4. Inhibition of miR-25 normalizes TAC-induced cardiac dysfunction.

a. Protocol for anti-miR-25 therapy in the mouse TAC heart failure model.
b. LV M-mode images showing dilation with control anti-miR in contrast to anti-miR-25 injected mice.
c. Effect on echocardiographic indices of left ventricular function: ejection fraction (EF) and fractional shortening (FS) expressed as percentages. The number of animals initiated is n = 4 (sham operated), 10 (TAC + control anti-miR), and 4 (TAC + anti-miR-25); the numbers analyzed per time point are indicated and reflect deaths in the TAC + control anti-miR group.
d–f. Hemodynamic effects. Pressure-volume plots of treatment cohorts as indicated (d). Note anti-miR-25 trend towards normalization of hemodynamic indices of end systolic pressure volume relationship (ESPVR, slope of lines in d) (e), and EF (f). n = 4 (sham operated), 4 (TAC + control anti-miR), and 3 (TAC + anti-miR-25).
g. Heart weight to body weight ratio. n = 5 (sham), 8 (TAC + control anti-miR), and 4 (TAC + anti-miR-25).
h,i. Effect of treatment on endogenous miR-25 levels (h, Q-PCR, n = 4) and SERCA2a protein (I, immunoblotting, n = 3).
j–w. Masson’s trichrome (j,k,n,o,r,s), hematoxylin/eosin (l,p,t), and wheat germ agglutinin (WGA) (m,q,u) stained sections of hearts and LV wall. Quantified fibrotic area (v) [n = 3 (sham operated), 4 (TAC + control anti-miR), and 5 (TAC + anti-miR-25]. Average cardiomyocyte cross sectional area (w) (n = 3 for all cohorts).
For all panels, mean ± s.e.m. *, # indicate significant difference (* or #, ** or ##, *** or ### = P <0.05, <0.01, <0.001) (Student’s t-test) between sham and control-anti-miR (*) or control anti-miR and anti-miR-25 (#). All replicates (n) are biological.
These studies identified miR-25 as a critical repressor of SERCA2a and cardiac function during heart failure. Of note, several mechanisms beyond SERCA2a deficiency, such as changes in K+ channel density, NCX expression and myofilament sensitivity to Ca2+, also contribute to slowing of the Ca2+ transient in advanced heart failure23. miR-25 might also control IP3R1, and thus could be involved under conditions of IP3 sensitization, such as in response to endothelin-1, angiotensin and phenylephrine24 or in local Ca2+ control25. The NAD(P)H oxidase-4 (NOX4) was recently shown to be downregulated by miR-25 in a mouse model of diabetic nephropathy26; however, NOX4 levels did not change significantly in our long-term TAC heart failure model (not shown). Whether NOX4, which is responsible for the production of superoxide, might contribute to the salutary effects of anti-miR-25 therapy is unclear since it is reported to confer both protective and detrimental effects27. Finally, miR-25 was recently reported to decrease acutely after aortic constriction in mice28, in contrast to the chronic elevation reported here and in human heart failure samples, perhaps reflecting the very different stages of pathogenesis. In conclusion, our data suggest that inhibition of miR-25 may be a novel therapeutic strategy for the treatment of heart failure.
Methods Summary
Detailed Methods are available with the online version of this paper.
For primary screening, HEK293 cells were co-transfected with the Ambion® Pre-miR™ miRNA Precursor Human V2.0 microRNA library (25nM) and 300 ng Serca2a 3’UTR target sensor plasmid (Fig. 1a) per well in 384-well plates, in triplicate.
For secondary screening, Ca2+ transient recordings (10 seconds, 33 frames per second) were acquired from HL-1 and NRVCs transfected with candidate miRs and loaded with Hoechst 33342 and Fluo-4 72 hours post-transfection, and analyzed to derive cytoplasmic calcium transient kinetic parameters using KIC instrument and software (Vala Sciences). Unresponsive or low responding cells were removed by gating. Statistical significance was determined using one-way ANOVA.
All mice were housed and treated in accordance with guidelines from the NIH and institutional animal care and use committees, and protocols were approved by the Mount Sinai School of Medicine or SBMRI animal care and use committees.
Left ventricular samples were from explanted hearts of patients with severe heart failure samples at the time of cardiac transplantation. Non-failing hearts (controls) were from patients who died of cerebrovascular accidents with no evidence of contractile dysfunction by echocardiography. The 5 non-failing hearts (3 males and 2 females) had a median age of 43. The 5 heart-failure patients (4 males and 1 female) had a median age of 54 and their mean ejection fraction prior to cardiac transplantation was 22±3%.
MATERIAL TO BE INCLUDED WITH THE ONLINE VERSION
Methods
Cell culture
HEK293 cells were maintained in DMEM/F12 supplemented with 10% FBS, 100 units/ml penicillin and 100 µg/ml streptomycin. HL-1 cells were maintained in Claycomb Medium (Sigma) supplemented with 10% FBS (Sigma), 100 units/ml penicillin, 100 ug/ml streptomycin, 2mM L-glutamine, 0.1mM norepinephrine (Sigma) and passaged approximately every 3–4 days when cells reached confluency and spontaneous contractions were observed. For transient transfection of both cell lines, Lipofectamine 2000 (Life Technologies) was used following manufacturer’s protocol. Cy3 labeled negative control siRNA (Ambion, AM4621) or microRNA (Ambion, AM17120) was used for control in all transfection experiments. Transfection efficiency was >90%.
Neonatal rat ventricular cardiomyocytes (NRVCs) were isolated with the neonatal rat cardiomyocyte isolation kit (Worthington) and cultured at 37°C with 5% CO2. In brief, ventricles were dissected from 1–2-d-old Hsd:SD rats (Sprague Dawley), then digested overnight at 4°C with trypsin. Digestion continued the following morning with collagenase for approximately 90 minutes at 37°C. Cells were pooled, pre-plated for 90 min on an uncoated dish to remove fibroblasts, and transfected as above on matrigel-coated cell culture plastic dishes in high-serum media (DMEM/F12 [1:1], 0.2% BSA, 3 mM sodium-pyruvate, 0.1 mM ascorbic acid, 4 mg/liter transferrin, 2 mM L-glutamine, 100 nM thyroid hormone (T3) supplemented with 10% horse serum and 5% FCS) at 2 × 10⁵ cells/cm2. After 24 h, media was changed to low-serum medium (same but with 0.25% FCS). At 72 h cells were processed for calcium imaging (see below).
Target sensor
To screen for microRNA repression of the cardiac-specific Serca2a isoform we substituted the CMV promoter of the pDsRed-N1 vector (Clontech) with the hPGK promoter driving expression of eGFP. We focused on the Serca2a 3’UTR since it is selectively expressed in cardiomyocytes (in contrast to Serca2b sequences) to test the hypothesis that the cardiac-specific isoform might be under distinct regulatory control. DsRed sequence was replaced with the human Serca2a 3’ UTR sequence (nucleotides 3503-4302, Genbank accession number NM_001681.3), which was obtained by PCR of differentiated human ES cells displaying spontaneous contractions. Primer sequences used for amplification were as follows:
hSerca2a F: 5’-CGGGGTACCTGCAATACTGGAGTAACCGCTTC -3’
hSerca2a R: 5’- CGGCGGCCGCATTTACCTGAAACCATGTCTGTGC -3’
microRNA Screen
HEK293 cells were co-transfected with the Ambion® Pre-miR™ miRNA Precursor Human V2.0 microRNA library and 300 ng Serca2a 3’UTR target sensor plasmid per well in 384-well plates (Greiner). Transfections were performed using Lipofectamine 2000 (Life Technologies) in triplicate with 25nM of each miR. At 48 h after transfection cells were fixed in 4% paraformaldehyde and imaging was performed using an automated fluorescent microscope (InCell Analyzer 1000; GE Healthcare) and analyzed using CyteSeer software (Vala Sciences) by quantifying Total Integrated Pixel Intensity within an eGFP-positive area, as described29,30. Hits were confirmed by a 5-point dose response assay (50nM to 3.125nM), and data plotted (Fig. 1e) as area under curve (A.U.C.). 32 were determined to be evolutionarily conserved between mouse and human (TargetScan v6.2), and 15 were both evolutionarily conserved and reported to be upregulated in human heart failure4,5,31–37.
Site-directed mutagenesis
Site-directed mutagenesis was used to modify the miR-25 seed binding sequence using Pfu Turbo DNA Polymerase. Dpn I was used to digest non-mutated DNA template before transforming the mutated plasmids. Primers used were as follows:
Serca2a 3’UTR F: 5’- GCAGTAGACAGATGTTGTTCGAATACAAATATTGTGATGC -3’
Serca2a 3’UTR R: 5’- GCATCACAATATTTGTATTCGAACAACATGTGTCTACTGC -3’
IP3R1 3’UTR F: 5’- ATGTTTTTTATAAAACTCATATGTACGAATTATGCAATCAC -3’
IP3R1 3’UTR R: 5’- GTGATTGCATAATTCGTACATATGAGTTTTATAAAAAACAT -3’
The mutated sequences were designed to contain restriction enzyme recognition sites (marked in bold) used to verify correct mutation of the seed site.
IP3R1 Target sensor luciferase assay
HEK293 cells were co-transfected with microRNA (25nM) and 100 ng human IP3R Type 1 miTarget (GeneCopoeia). 48 h after transfection reporter activity was analyzed using the Dual-Glo® Luciferase Assay System (Promega) and EnVision plate reader (PerkinElmer). Data are presented as a ratio of firefly luciferase activity normalized to Renilla luciferase.
Quantitative RT-PCR
RNA was isolated from human tissue using Trizol (Life Technologies) according to manufacturer’s protocol. All-in-One™ miRNA qRT-PCR Detection Kit (GeneCopoeia) was used for both cDNA synthesis and quantitative detection using miR-25 specific primers (GeneCopoeia). Rnu6 was used for normalization.
RNA was isolated from mouse tissue using mirVana™ miRNA Isolation kit (Life Technologies) according to manufacturer’s protocol. The TaqMan® MicroRNA Assays kit (Life Technologies) was used for both cDNA synthesis and quantitative PCR using miR-25 primers (Life Technologies). miR-24 was used for normalization.
In Situ hybridization
To characterize the distribution and cellular origin of miR-25 in heart failure we performed in situ hybridization on 10 µm thick cryosections of TAC-induced heart failure mice (1 month post-TAC). Sections were fixed by 4% paraformaldehyde for 10 minutes, acetylated for 10 minutes and permeabilized for 5 minutes by proteinase K treatment (5 µg/ml). Prehybridization of sections was performed for four hours at RNA melting temperature (Tm) minus 30°C (specific for each LNA probe) before overnight hybridization with 25 nM 5`-DIG and 3`-DIG labeled miRCURY LNA microRNA detection probes (Exiqon) for miR-25 (18122-15), negative control miR-159 (99003-15), and positive control U6 (99002-15) at Tm minus 30°C in denaturizing hybridization buffer. To remove unbound and partially bound probes slides were washed for 15 minutes in 5X SSC and 1 hour in 0.2X SSC at 60°C. After washing, sections were blocked for 1 hour before overnight incubation at 4°C with anti-DIG-alkaline phosphatase antibody (1:1500, Roche). For miRNA visualization sections were subsequently incubated in Liquid Permanent Red (Dako) for 6 hours. Co-staining for the non-cardiomyocyte fraction was performed by incubation with lectin BS-I (1:100, Sigma), anti-α-Smooth Muscle Actin (1:400, Sigma), or Periostin (1:50, Sigma) for 1 hour at room temperature, followed by 1 hour incubation with appropriate Alexa Fluor® 488 secondary antibodies (Life Technologies). Hoechst 33342 (Life Technologies) was used as a counter stain and slides were mounted in Fluoromount G (SouthernBiotech). Images were captured using cellP software (Olympus) on an Olympus BX60 microscope and processed with Adobe Photoshop Cs4 v11.
Protein expression analyses
For in vitro transfection experiments using HL-1 cells, cells were transfected with miRs (50nM), and samples were lysed 72 h later using Novex Tris-Glycine 2x Sample Buffer supplemented with 5% β-mercaptoethanol at 55°C for 1 h. Samples were loaded on SDS-polyacrylamide electrophoresis gels for separation, followed by blotting of protein onto polyvinylidene fluoride membrane. Membranes were then incubated as follows: Serca2a (1:2000; 21st Century Biochemicals), IP3R1 (1:200, goat polyclonal, sc-6093; Santa Cruz Biotechnology), Calmodulin (1:2000, rabbit monoclonal, ab45689; Abcam), NCX1 (1:500, mouse monoclonal, MAB1590; Chemicon), GAPDH (1:1000, rabbit polyclonoal, ab9485; Abcam), Phosopholamban (1:500, mouse monoclonal, 05-205; Upstate) and CaMKII (1:10,000, kind gift from Dr. Joan Heller Brown laboratory). Alexafluor-labeled secondary antibodies were used (1:10,000) for detection of the specific bands. Quantitative analysis was done using the Odyssey® imaging system (LI-COR Biosciences).
Calcium imaging and analysis
HL-1 cells were seeded at a density of 25,000 cells/well on 96-well glass bottom plates (Greiner) and transfected with 50nM miRs as described for cell culture above. NRVCs were seeded at a density of 60,000 cells/well, and were processed identically, with the addition of a single 15 V electrical pulse of 5 ms at 1 Hz, initiated at 2 s into recording.
72 h post-transfection, cells were loaded with 200 ng/ml Hoechst 33342 (Sigma) and Fluo-4 for 30 minutes at 37°C followed by 30 minutes at room temperature. Fluo-4 NW Calcium Assay Kit (Life Technologies) was prepared according to manufacturers’ instructions in 1x Hanks Balanced Salt Solution containing 20mM HEPES buffer (Life Technologies) and 2.5mM Probenecid (Life Technologies). Following loading, cells were incubated with Tyrode’s solution (140mM NaCl, 6mM KCl, 1mM MgCl2, 5mM HEPES, 2mM CaCl2, 10mM glucose, pH 7.4) for imaging. Ca2+ transient recordings were done using a Kinetic Image Cytometer IC 100 (Vala Sciences). Video streams of 10 seconds of the Fluo-4 green channel were collected for each well at 33 frames per second. Autofocus by the IC 100 was performed automatically by video acquisition using the nuclear channel. All image capture was performed with a 20x 0.50 numerical aperture (NA) objective. Cytometric calcium kinetic parameters were determined by image analysis using CyteSeer software (Vala Sciences) and unresponsive or low responding cells were removed by gating.
Bioinformatics
Predicted miR-25 target binding sites were obtained from TargetScan Human v6.2 (http://www.targetscan.org). Potential targets of miR-25 involved in calcium signaling pathways were identified using DianaLab miRPath with TargetScan Mouse v5.0 prediction software (http://diana.cslab.ece.ntua.gr/pathways).
AAV9 transduction
AAV9-miR25 and 92a were produced using the two-plasmids protocol described by Zolotukhin et al38 with the following modifications: 293-T cells (ATCC) were grown in triple flasks for 24 hours (DMEM, 10% FBS) prior to the transfection using PEI (polyethyleneimine). After 72 hours, Cells were harvested and only DNase resistant virus was purified by an iodixanol density gradient (Optiprep, Greiner Bio-One Inc). Finally viruses were concentrated and formulated into lactated Ringer’s solution (Baxter Healthcare Corporation) using a Vivaspin 20 Centrifugal concentrators 100K MWCO (Vivascience Inc), and stored at – 80°C. On the day of the injection, mice were immobilized using the single mouse restrainer (Harvard apparatus) and indicated amount (5×10¹¹ vector genomes (vg) / mouse) of AAV9 was injected through tail-vein.
AAV transduction of miR-25 and miR-92a yielded comparable copy number (Extended Data Fig. 5). To quantify miR-25 and miR-92a copy number in mice, we used a SYBR green-based real-time quantitative assay. Genomic AAV9-miR-25 and miR-92a vector DNA was extracted from frozen cardiac tissues by using DNeasy Tissue Kits (Qiagen). The real-time quantitative PCR assay detects a 145-bp sequence unique to SV40 promoter in AAV9 vector (F: TTGGACAAACCACAACTAGAA, R: AACCTCCCACACCTCCC). Genomic DNA was isolated from the indicated tissues and 100 ng of each sample was used in duplicate to determine vector genome copies. The plasmid DNA was used as a copy number standard ranging from 10 to 108 copies/µl. The lower limit detection of the assay was 150 copies/µg DNA.
TAC (Trans aortic constriction) surgery
Male mice (B6C3F1 strain) of 8 to 10 weeks of age (25–30 g) were used. The animals were anesthetized with ketamine (95mg/kg) / xylazine (5mg/kg) administered via intraperitoneal injection. The mice were ventilated with a tidal volume of 0.1 ml and a respiratory rate of 110 breaths per minute (Harvard Apparatus). A longitudinal incision of 2 to 3 mm was made in the proximal sternum to allow visualization of the aortic arch. The transverse aortic arch was ligated between the innominate and left common carotid arteries with an overlaid 27-gauge needle. The needle was then immediately removed, leaving a discrete region of constriction. Echocardiography was performed and Doppler was used to calculate the pressure gradient between proximal and distal sites of the transverse aortic constriction. Only animals with a pressure gradient > 30 mmHg were included in this study. After 8 weeks, additional echocardiography was performed to evaluate cardiac function. Only animals with FS < 50% were determined as HF for further study.
Anti-miR administration
Anti-miR-25 (product ID: AM10584), anti-miR negative control (product ID: AM17010) were purchased from Ambion (Austin, TX). Separate solutions of anti-miR-25, anti-miR negative control were each diluted with in vivo-jetPEI solution (Cat. No. 201-50, Polyplus-transfection, Illkirch, France) containing 10% (wt/vol) glucose (Polyplus-transfection reagent) at an N/P ratio of 5, following the recommendations of the manufacturer (PolyPlus Transfection) to final doses of oligonucleotide of 300 µg. All solutions were mixed by vortexing for 10 s and incubated for at least 15 min at 37°C prior to injection. Each mouse received 400µl saline and oligonucleotide mixture (100µl of oligonucleotide solution + 300µl of saline) through tail vein injection consecutively for 3 days and 3 additional injections were performed once a week for following 3 weeks. Two additional groups of control animals were included; one consisting of untreated animals and the other of animals receiving a mixture of in vivo jetPEI solution containing 10% (wt/vol) glucose without added oligonucleotide. All injections were carried out using 30G needle syringe with single mouse restrainer (Harvard apparatus, Boston).
Production of SERCA2a Knock-out mice
Conditional SERCA2 KO mice were generously donated by Dr. Geir Christensen, University of Oslo, Norway39. The mice were generated by standard gene targeting strategies to introduce loxP sites into introns 1 and 3 of the Serca2 (Atpa2a2) gene. For our studies, 8–10 week-old mice were injected intraperitoneally with 4-OH-tamoxifen (1 mg/day) for 4 days to induce cardiomyocyte-specific excision of the Serca2 gene sequences, essentially as described 39,40.
Echocardiography and in vivo hemodynamics
B6C3F1 mice were acquired from Jackson laboratories. Mice were anesthetized with intraperitoneal ketamine (100 µg/g) for echocardiographic analysis. Two-dimensional images and M-mode tracings were recorded on the short-axis at the level of the papillary muscle to determine percent fractional shortening and ventricular dimensions (GE Vivid Vision). One day after echocardiography, in vivo hemodynamics was performed using a 1.2Fr pressure-volume (PV) conductance catheter (Scisense, Ontario, Canada). Mice were anesthetized with an intraperitoneal injection mixture of urethane (1 mg/g), etomidate (10 µg/g), and morphine (1 µg/g) and were then intubated via a tracheotomy and mechanically ventilated at 7 µl/g tidal volume and 120 respirations/min. The PV catheter was placed in the left ventricle via an apical stab approach as previously described41. Pressure-volume data were analyzed using IOX2 software (EMKA technologies). All procedures were approved by and performed in accordance with the Institutional Animal Care and Use Committee of the Mount Sinai School of Medicine. The investigation conforms with the Guide for the Care and Use of Laboratory Animals published by the US National Institutes of Health (NIH Publication No. 85–23, revised 1996).
Histological examination of cardiac tissues
To measure cardiomyocyte cross sectional area, suitable cross-sections with nearly circular capillary profiles and nuclei were selected on sections stained with wheat germ agglutinin (WGA) followed by a FITC-conjugated rabbit polyclonal to WGA (1:100; ab20528, Abcam). These were observed using an Axiophot microscope (Carl Zeiss, Germany), and then analyzed using the Analysis-SIS3.2 software (Soft-Imaging System, Germany). To measure the fibrotic areas, Masson-trichrome staining kit (Sigma-Aldrich (HT15-1kt), USA) was used for staining of the sectioned hearts. The fibrotic areas stained blue and the normal tissue stained red. The fibrotic area was calculated as the ratio of the total area of fibrosis to the total area of the section.
Statistical analysis
Data are presented as mean ± standard error of the mean (s.e.m.). Unpaired Student’s t-test or ANOVA was performed as indicated to determine statistical differences. Whisker box plots show outliers beyond the 5th and 95th percentiles. All statistical analyses were done using GraphPad Prism software.
Extended Data
Extended Data Fig. 1. Effect of miR-25 on IP3R1 and cardiomyocyte calcium transients in vitro.

Effect of miR-25, anti-miR-25 and siIP3R1 transfection on IP3R1 protein levels in HL-1 cells (a). Sequence of the putative miR-25 target recognition element in IP3R1 mRNA and the corresponding alteration by site-directed mutagenesis (b). Mutation abolished inhibition of luciferase signal by miR-25 (n=10). Representative Ca2+ transient of HL-1 cells transfected as indicated (c). Note that miR-25 slowed the repolarization phase kinetics, whereas anti-miR-25 quickened the kinetics. Co-transfection normalized kinetics. Kinetic imaging cytometry analysis of Ca2+ transient kinetics during the decay phase (Ca2+ transient duration time from 75% to 25% maximal value, CaTD75-25) of transfected NRVC (d) (n>550 cells). In panels a,b data is represented as mean ± s.e.m. In panel d, box defines interquartile range; whiskers = ±5th and 95th percentile; dots = outliers
Extended Data Fig. 2. Effect of miR-25 on calcium handling proteins.

Expression of candidate targets of miR-25 in transfected HL-1 cells (lysates collected 5 days post-transfection). No effect of miR-25 or anti-miR-25 was noted for these proteins. Data represented as mean ± s.e.m.
Extended Data Fig. 3. Calcium transient effects of miR-25 compared to that of siRNAs against SERCA2a and IP3R isoforms.

Cardiomyocyte-like HL-1 cells were transfected with miR-25, siRNA to SERCA2a (siSERCA2a) (left panels) or siRNAs to IP3R1 or IP3R2 (siIP3R1, siIP3R2) (right panels), and analyzed 72 hours later by kinetic imaging cytometry. Kinetic parameters are CaTD50 (Ca2+ transient duration 50, which is the time from maximal value to 50% maximal value), CaTD75-25 (Ca2+ transient duration 75-25, which is the time from 75% maximal value to 25% maximal value), and Vmax upstroke (the maximal velocity of the upstroke phase of the Ca2+ transient). Data are represented as whisker plots, with the box denoting the 25th and 75th percentiles, the whiskers the 5th and 95th percentiles, the middle bar is the median, and outliers are indicated as individual dots.
Note that siSERCA2a and miR-25 elicited comparable effects, both markedly delaying the Ca2+ uptake phase parameters CaTD50 and CaTD75-25 without appreciably altering Vmax upstroke kinetics. (n>550 cells per group). Box defines interquartile range; whiskers = ±5th and 95th percentile; dots = outliers.
Also note that siIP3R1 only minimally affected the Ca2+ kinetic parameters. siIP3R2 slowed Vmax upstroke and broadened the distribution of uptake phase kinetic parameters CaTD50 and CaTD75-25. miR-25 in contrast slowed the uptake phase parameters but did not appreciably affect Vmax upstroke. (n>550 cells per group). Box defines interquartile range; whiskers = ±5th and 95th percentile; dots = outliers.
Although IP3R1 might be a direct target of miR-25, several lines of evidence suggest that it is unlikely to mediate miR-25’s effect in heart failure. IP3Rs are intracellular ligand-gated Ca2+ release channels42 that in the sarcoplasmic reticulum are associated with excitation-contraction coupling or spontaneous Ca2+ release and enhanced Ca2+ transients, whereas in the nuclear envelope promote nuclear Ca2+ signaling43-45, but a specific role for IP3R1 in heart failure has not been identified. Nonetheless, miR-25 control of IP3R1 might play a critical role under conditions that sensitize cardiomyocytes to IP3, such in response to endothelin-1, angiotensin and phenylephrine24 or in local Ca2+ control25.
Extended Data Fig. 4. Effect of miR-25 and miR-92a overexpression in vivo.
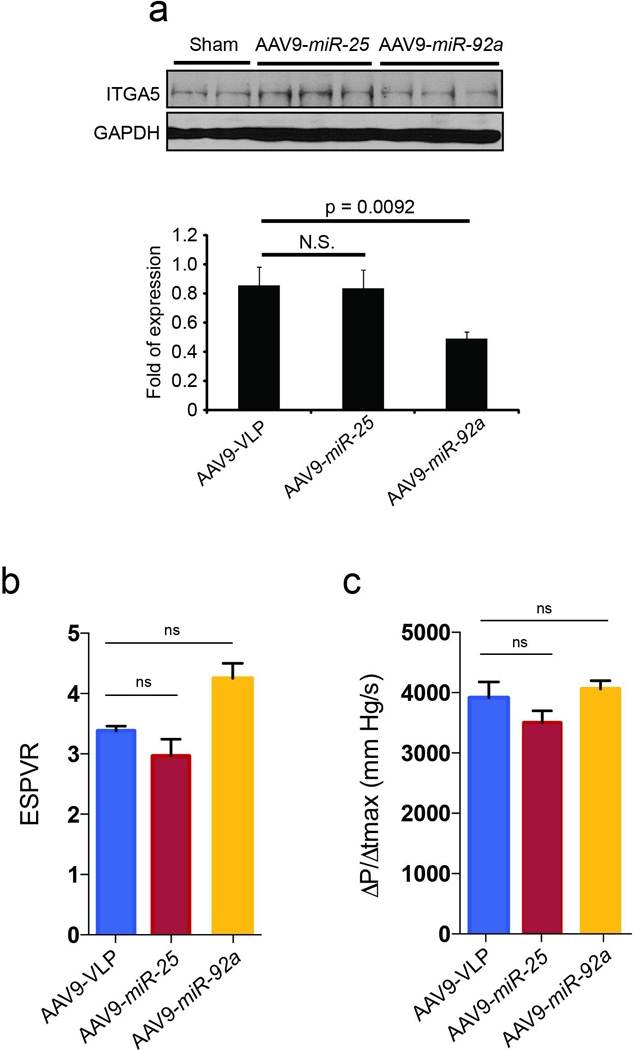
Effect of AAV9 cardiac gene transfer of miR-25 and miR-92a on target protein levels (a). Cardiac gene transfer of miR-25 and miR-92a increased levels of their respective microRNAs but miR-92a was selective against confirmed target integrin subunit α5 (ITGA5). Effects of AAV9 cardiac gene transfer of miR-25 and miR-92a on cardiac function (b-c). Tendency towards decreased cardiac function in both ESPVR (b) and dP/dtmax (c) in AAV9-miR-25 animals relative to control (AAV9-VLP) and AAV9-miR-92a treated animals. n=5 (AAV9-VLP); 4 (AAV9-miR-25); 5 (AAV9-miR-92a) for panels b-c . In all panels data is represented as mean ± s.e.m.
Extended Data Fig. 5. AAV9-mediated gene transfer integration in ventricular myocardium.

The number of integrated miR-25 and miR-92a copies in ventricular myocardium 6 weeks after AAV gene transfer, determined by quantitative PCR (see Detailed Methods). n = 5 (AAV9-VLP), n = 4 (AAV9-miR-25) and n = 5 (AAV9-miR-92a). Data is represented as mean ± s.e.m.
Extended Data Fig. 6. Effects of anti-miR-25 on endogenous miR-25 and SERCA2a in WT and Serca2a-null hearts.
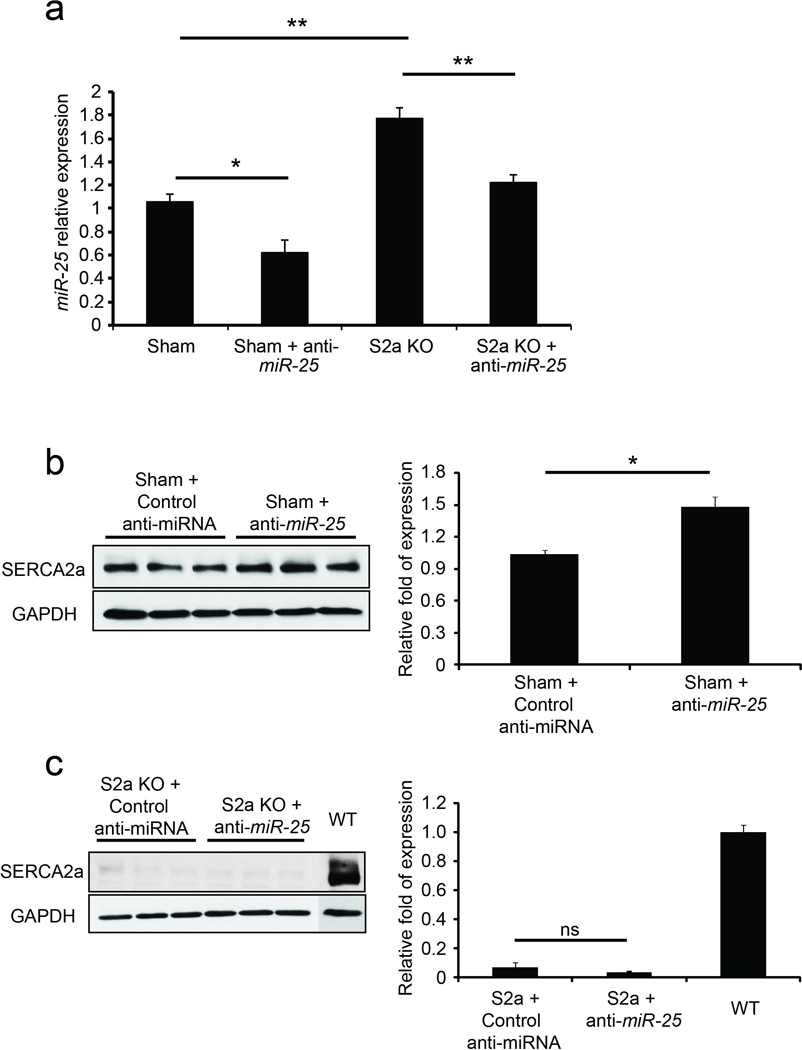
Anti-miR-25 or control (scrambled sequence) anti-miR was administered intravenously to sham-operated WT mice (Sham) or to unoperated Serca2a-cardiomyocyte null (S2a KO) mice39, as for the experiments in Fig. 4 (see Detailed Methods). Sham-operated animals were injected with anti-miRs 1 week after surgery and analyzed at 4 weeks. S2a KO animals were injected with 4-OH tamoxifen i.p. for 4 days to delete Serca2a (see Detailed Methods), injected with anti-miRs 1 week later and analyzed 4 weeks later (5 weeks from initial 4-OH-tamoxifen injection). Note that anti-miR-25 decreased endogenous miR-25 levels in sham-operated WT and S2a KO mice relative to control-treated animals (n = 3) (a). Furthermore, SERCA2a protein levels increased in the anti-miR-25 treated WT animals relative to control (n = 3) (b). SERCA2a is absent in S2a KO hearts (c). In all panels data is represented as mean ± s.e.m.
Extended Data Fig. 7. Selectivity of anti-miR-25 on miR-25 family.

Expression levels of miR-25 and family members (miR-32, miR-92a, and miR-92b) in sham-operated mice that had been injected with anti-miR-25 or control (scrambled sequence) anti-miR as in Fig. 4 (see Detailed Methods) (n = 3). Note that control anti-miR in sham-operated animals did not alter expression of any of the miRs tested (blue bars). In contrast, anti-miR-25 significantly reduced levels of miR-25 but not other family members in sham-operated animals (red bars). Data is represented as mean ± s.e.m.
Extended Data Fig. 8. Effects of anti-miR-25 on cardiac function of WT and Serca2a-null hearts.

Anti-miR-25 or control (scrambled sequence) anti-miR was administered intravenously to sham-operated WT mice (Sham) or to unoperated Serca2a-cardiomyocyte null (S2a KO) mice39, as for the experiments in Fig. 4 (see Detailed Methods). Sham-operated animals were injected with anti-miRs 1 week after surgery and followed by echocardiography. S2a KO animals were generated by injection with 4-OH tamoxifen i.p. for 4 days (see Detailed Methods) to delete Serca2a, then injected with anti-miRs 1 week later and followed by echocardiography.
Representative two-dimensional guided M-mode images of the left ventricles from WT and S2a KO mice (a). Echocardiographic indices of left ventricular inner dimension during diastole, LVIDd (b) and systole, LVIDs (c) (n = 3 (sham+control); 8, (sham+anti-miR-25); 7 (S2a KO+control); 11 (S2a-KO+anti-miR-25) 4 weeks after control or anti-miR injection. Echocardiographic measurement of fractional shortening (FS) expressed as a percentage at time points after control or anti-miR injection (n = 4 (sham+control); 3 (sham+anti-miR-25); 3 (S2a KO+control); 3 (S2a KO+anti-miR-25)) (d). S2a KO mice show characteristic dilation and decline in cardiac function following 4-OH tamoxifen-induced excision of Serca2a40; ***, P < 0.001 (Student’s t-test for difference between S2a KO and Sham-operated control anti-miR groups at week 4 following injection).
Hemodynamic effect of anti-miR-25 and control anti-miR injection represented by pressure-volume plots of treatment cohorts as indicated 4 weeks after injection of control or anti-miR (e). Note that specific anti-miR-25 and control anti-miR acted similarly in sham-operated WT animals (n = 3 (sham+control); 3, (sham+anti-miR-25); 2 (S2a KO+control); 3 (S2a-KO+anti-miR-25). Moreover, anti-miR-25 did not increase cardiac function of S2a KO mice, unlike TAC-operated WT mice (Fig. 4), suggesting that the beneficial effect on cardiac function depends on SERCA2a. In all panels data is represented as mean ± s.e.m.
Extended Data Fig. 9. Kaplan Meier survival curve for anti-miR-25 treatment.

Survival probability is plotted over time, showing cumulative protective effect of anti-miR-25 relative to control (scrambled sequence) anti-miR injections following trans-aortic constriction (TAC). The summary of two experiments is shown plotting time from injection. Groups were sham-operated (n = 8), TAC + anti-miR-25 (n = 8), TAC + control (scrambled sequence) anti-miR (n = 22). Note that injection with specific anti-miR-25 increased survival (P = 0.0131, Log-rank test) relative to TAC + control miR.
Extended Data Fig. 10. Effect of anti-miR-25 on accumulation of SUMOylated SERCA2a.

Immunoblots of lysates from heart tissue at termination of the in vivo study of Fig. 4 (5.5 months post-TAC, corresponding to 3.5 months post-injection of anti-miR-25 or control (scrambled sequence) anti-miR). Lysates were immunoprecipitated with anti-SUMO1 followed by Western blotting with anti-SERCA2a, as in22. Note reduction in SUMOylated SERCA2a upon TAC in the control anti-miR treated hearts, but restoration of expression following specific anti-miR-25 injection. Total levels of SUMO1 and actin are shown.
Supplementary Material
Acknowledgements
We thank Dr. Pedro Aza-Blanc (SBMRI), Fabio Cerignoli (SBMRI and Vala Sciences), and Okkil Kim, Lifan Liang and Eric Kohlbrenner (ISMMS) for their technical support; and Dr Geir Christensen (University of Oslo, Oslo, Norway) for providing the SERCA KO mice and Dr. Hamid el Azzouzi (University Medical Center Utrecht) for TAC operations and histological sections. This work was supported by CIRM (RC1-000132), NIH (HL113601 and HL108176) and the Mathers Charitable Trust to MM; by the NIH (NIH R01 HL093183, HL088434, P20HL100396, a Program of Excellence in Nanotechnology Contract # HHSN26820100045C, and P50HL112324) to RJH; P30 CA030199 and P30 AR061303 for SBMRI functional genomics and cytometry. W.J.P. was supported by the Global Research Laboratory Program of the South Korean Government (M6-0605-00-0001). JPGS and PAFD were supported by the Netherlands Heart foundation and Project P1.05 LUST of the BioMedical Materials institute co-funded by the Dutch Ministry of Economic Affairs, Agriculture and Innovation. C.W. was supported by a fellowship from the Spanish National Research Council. AvM was a Netherlands Heart Institute ICIN fellow.
Footnotes
Supplementary Information is linked to the online version of this paper.
Author Contributions
CW, ARM, DJ, RJH and MM conceived and designed the project following an initial concept of MM; CW, DJ, ARM, CK, AL, SM and AvM performed experiments and analyzed the data; and interpreted results with MM and RJH. WJP developed reagents for posttranslational modification assays on SERCA2a. MM, RJH, CW, ARM, DJ, AvM, PAFD and JPGS wrote and edited the manuscript. Major funding was obtained by PAFD, RJH and MM.
Author Information
The authors declare no competing interests.
References
- 1.Bonow RO, Mann DL, Zipes DP, Libby P. Braunwald's Heart Disease. Saunders; 2011. [Google Scholar]
- 2.Meyer M, et al. Alterations of sarcoplasmic reticulum proteins in failing human dilated cardiomyopathy. Circulation. 1995;92:778–784. doi: 10.1161/01.cir.92.4.778. [DOI] [PubMed] [Google Scholar]
- 3.Jessup M, et al. Calcium Upregulation by Percutaneous Administration of Gene Therapy in Cardiac Disease (CUPID): a phase 2 trial of intracoronary gene therapy of sarcoplasmic reticulum Ca2+-ATPase in patients with advanced heart failure. Circulation. 2011;124:304–313. doi: 10.1161/CIRCULATIONAHA.111.022889. [DOI] [PMC free article] [PubMed] [Google Scholar]
- 4.Ikeda S, et al. Altered microRNA expression in human heart disease. Physiological genomics. 2007;31:367–373. doi: 10.1152/physiolgenomics.00144.2007. [DOI] [PubMed] [Google Scholar]
- 5.Leptidis S, et al. A deep sequencing approach to uncover the miRNOME in the human heart. PLoS ONE. 2013;8:e57800. doi: 10.1371/journal.pone.0057800. [DOI] [PMC free article] [PubMed] [Google Scholar]
- 6.Shah AM, Mann DL. In search of new therapeutic targets and strategies for heart failure: recent advances in basic science. The Lancet. 2011;378:704–712. doi: 10.1016/S0140-6736(11)60894-5. [DOI] [PMC free article] [PubMed] [Google Scholar]
- 7.Mudd JO, Kass DA. Tackling heart failure in the twenty-first century. Nature. 2008;451:919–928. doi: 10.1038/nature06798. [DOI] [PubMed] [Google Scholar]
- 8.Greenstein JL, Winslow RL. Integrative systems models of cardiac excitation-contraction coupling. Circulation research. 2011;108:70–84. doi: 10.1161/CIRCRESAHA.110.223578. [DOI] [PMC free article] [PubMed] [Google Scholar]
- 9.Bartel DP. MicroRNAs: target recognition and regulatory functions. Cell. 2009;136:215–233. doi: 10.1016/j.cell.2009.01.002. [DOI] [PMC free article] [PubMed] [Google Scholar]
- 10.Filipowicz W, Bhattacharyya SN, Sonenberg N. Mechanisms of post-transcriptional regulation by microRNAs: are the answers in sight? Nature reviews. Genetics. 2008;9:102–114. doi: 10.1038/nrg2290. [DOI] [PubMed] [Google Scholar]
- 11.Gurha P, et al. Targeted deletion of microRNA-22 promotes stress-induced cardiac dilation and contractile dysfunction. Circulation. 2012;125:2751–2761. doi: 10.1161/CIRCULATIONAHA.111.044354. [DOI] [PMC free article] [PubMed] [Google Scholar]
- 12.Kawase Y, et al. Reversal of cardiac dysfunction after long-term expression of SERCA2a by gene transfer in a pre-clinical model of heart failure. Journal of the American College of Cardiology. 2008;51:1112–1119. doi: 10.1016/j.jacc.2007.12.014. [DOI] [PubMed] [Google Scholar]
- 13.Jessup M, et al. Calcium Upregulation by Percutaneous Administration of Gene Therapy in Cardiac Disease (CUPID): A Phase 2 Trial of Intracoronary Gene Therapy of Sarcoplasmic Reticulum Ca2+-ATPase in Patients With Advanced Heart Failure. Circulation. 2011 doi: 10.1161/CIRCULATIONAHA.111.022889. [DOI] [PMC free article] [PubMed] [Google Scholar]
- 14.Shirdel EA, Xie W, Mak TW, Jurisica I. NAViGaTing the micronome--using multiple microRNA prediction databases to identify signalling pathway-associated microRNAs. PLoS ONE. 2011;6:e17429. doi: 10.1371/journal.pone.0017429. [DOI] [PMC free article] [PubMed] [Google Scholar]
- 15.Lemons D, Maurya MR, Subramaniam S, Mercola M. Developing microRNA screening as a functional genomics tool for disease research. Front Physiol. 2013;4:223. doi: 10.3389/fphys.2013.00223. [DOI] [PMC free article] [PubMed] [Google Scholar]
- 16.Cerignoli F, et al. High throughput measurement of Ca(2+) dynamics for drug risk assessment in human stem cell-derived cardiomyocytes by kinetic image cytometry. Journal of pharmacological and toxicological methods. 2012;66:246–256. doi: 10.1016/j.vascn.2012.08.167. [DOI] [PMC free article] [PubMed] [Google Scholar]
- 17.Beuckelmann DJ, Nabauer M, Erdmann E. Intracellular calcium handling in isolated ventricular myocytes from patients with terminal heart failure. Circulation. 1992;85:1046–1055. doi: 10.1161/01.cir.85.3.1046. [DOI] [PubMed] [Google Scholar]
- 18.Piacentino V, 3rd, et al. Cellular basis of abnormal calcium transients of failing human ventricular myocytes. Circulation research. 2003;92:651–658. doi: 10.1161/01.RES.0000062469.83985.9B. [DOI] [PubMed] [Google Scholar]
- 19.Krutzfeldt J, et al. Silencing of microRNAs in vivo with 'antagomirs'. Nature. 2005;438:685–689. doi: 10.1038/nature04303. [DOI] [PubMed] [Google Scholar]
- 20.Bonauer A, et al. MicroRNA-92a controls angiogenesis and functional recovery of ischemic tissues in mice. Science (New York, N.Y. 2009;324:1710–1713. doi: 10.1126/science.1174381. [DOI] [PubMed] [Google Scholar]
- 21.Helwak A, Kudla G, Dudnakova T, Tollervey D. Mapping the human miRNA interactome by CLASH reveals frequent noncanonical binding. Cell. 2013;153:654–665. doi: 10.1016/j.cell.2013.03.043. [DOI] [PMC free article] [PubMed] [Google Scholar]
- 22.Kho C, et al. SUMO1-dependent modulation of SERCA2a in heart failure. Nature. 2011;477:601–605. doi: 10.1038/nature10407. [DOI] [PMC free article] [PubMed] [Google Scholar]
- 23.Kho C, Lee A, Hajjar RJ. Altered sarcoplasmic reticulum calcium cycling--targets for heart failure therapy. Nature reviews. Cardiology. 2012;9:717–733. doi: 10.1038/nrcardio.2012.145. [DOI] [PMC free article] [PubMed] [Google Scholar]
- 24.Higazi DR, et al. Endothelin-1-stimulated InsP3-induced Ca2+ release is a nexus for hypertrophic signaling in cardiac myocytes. Molecular Cell. 2009;33:472–482. doi: 10.1016/j.molcel.2009.02.005. [DOI] [PubMed] [Google Scholar]
- 25.Hulot JS, et al. Critical role for stromal interaction molecule 1 in cardiac hypertrophy. Circulation. 2011;124:796–805. doi: 10.1161/CIRCULATIONAHA.111.031229. [DOI] [PMC free article] [PubMed] [Google Scholar]
- 26.Fu Y, et al. Regulation of NADPH oxidase activity is associated with miRNA-25-mediated NOX4 expression in experimental diabetic nephropathy. Am J Nephrol. 2010;32:581–589. doi: 10.1159/000322105. [DOI] [PubMed] [Google Scholar]
- 27.Schmidt HH, Wingler K, Kleinschnitz C, Dusting G. NOX4 is a Janus-faced reactive oxygen species generating NADPH oxidase. Circulation research. 2012;111:e15–e16. doi: 10.1161/CIRCRESAHA.112.271957. author reply e17-18. [DOI] [PubMed] [Google Scholar]
- 28.Dirkx E, et al. Nfat and miR-25 cooperate to reactivate the transcription factor Hand2 in heart failure. Nature cell biology. 2013;15:1282–1293. doi: 10.1038/ncb2866. [DOI] [PubMed] [Google Scholar]
References (for Online Methods and Extended Data)
- 29.Colas AR, et al. Whole-genome microRNA screening identifies let-7 and mir-18 as regulators of germ layer formation during early embryogenesis. Genes & development. 2012;26:2567–2579. doi: 10.1101/gad.200758.112. [DOI] [PMC free article] [PubMed] [Google Scholar]
- 30.McKeithan W, Colas A, Bushway PJ, Ray S, Mercola M. Serum-Free Generation of Multipotent Mesoderm (Kdr-positive) Progenitor Cells in Mouse Embryonic Stem Cells For Functional Genomics Screening. Current Protocols. 2012 doi: 10.1002/9780470151808.sc01f13s23. in press. [DOI] [PMC free article] [PubMed] [Google Scholar]
- 31.Roy S, et al. MicroRNA expression in response to murine myocardial infarction: miR-21 regulates fibroblast metalloprotease-2 via phosphatase and tensin homologue. Cardiovascular research. 2009;82:21–29. doi: 10.1093/cvr/cvp015. [DOI] [PMC free article] [PubMed] [Google Scholar]
- 32.Matkovich SJ, et al. Reciprocal regulation of myocardial microRNAs and messenger RNA in human cardiomyopathy and reversal of the microRNA signature by biomechanical support. Circulation. 2009;119:1263–1271. doi: 10.1161/CIRCULATIONAHA.108.813576. [DOI] [PMC free article] [PubMed] [Google Scholar]
- 33.van Rooij E, et al. Dysregulation of microRNAs after myocardial infarction reveals a role of miR-29 in cardiac fibrosis. Proceedings of the National Academy of Sciences of the United States of America. 2008;105:13027–13032. doi: 10.1073/pnas.0805038105. [DOI] [PMC free article] [PubMed] [Google Scholar]
- 34.Cheng Y, et al. MicroRNAs are aberrantly expressed in hypertrophic heart: do they play a role in cardiac hypertrophy? The American journal of pathology. 2007;170:1831–1840. doi: 10.2353/ajpath.2007.061170. [DOI] [PMC free article] [PubMed] [Google Scholar]
- 35.Tatsuguchi M, et al. Expression of microRNAs is dynamically regulated during cardiomyocyte hypertrophy. Journal of Molecular and Cellular Cardiology. 2007;42:1137–1141. doi: 10.1016/j.yjmcc.2007.04.004. [DOI] [PMC free article] [PubMed] [Google Scholar]
- 36.Sayed D, Hong C, Chen IY, Lypowy J, Abdellatif M. MicroRNAs play an essential role in the development of cardiac hypertrophy. Circulation research. 2007;100:416–424. doi: 10.1161/01.RES.0000257913.42552.23. [DOI] [PubMed] [Google Scholar]
- 37.van Rooij E, et al. A signature pattern of stress-responsive microRNAs that can evoke cardiac hypertrophy and heart failure. Proceedings of the National Academy of Sciences of the United States of America. 2006;103:18255–18260. doi: 10.1073/pnas.0608791103. [DOI] [PMC free article] [PubMed] [Google Scholar]
- 38.Zolotukhin S, et al. Recombinant adeno-associated virus purification using novel methods improves infectious titer and yield. Gene therapy. 1999;6:973–985. doi: 10.1038/sj.gt.3300938. [DOI] [PubMed] [Google Scholar]
- 39.Andersson KB, et al. Moderate heart dysfunction in mice with inducible cardiomyocyte-specific excision of the Serca2 gene. Journal of Molecular and Cellular Cardiology. 2009;47:180–187. doi: 10.1016/j.yjmcc.2009.03.013. [DOI] [PubMed] [Google Scholar]
- 40.Swift F, et al. Extreme sarcoplasmic reticulum volume loss and compensatory T-tubule remodeling after Serca2 knockout. Proceedings of the National Academy of Sciences of the United States of America. 2012;109:3997–4001. doi: 10.1073/pnas.1120172109. [DOI] [PMC free article] [PubMed] [Google Scholar]
- 41.Pacher P, Nagayama T, Mukhopadhyay P, Batkai S, Kass DA. Measurement of cardiac function using pressure–volume conductance catheter technique in mice and rats. Nature protocols. 2008;3:1422–1434. doi: 10.1038/nprot.2008.138. [DOI] [PMC free article] [PubMed] [Google Scholar]
- 42.Bers DM. Calcium cycling and signaling in cardiac myocytes. Annual Review of Physiology. 2008;70:23–49. doi: 10.1146/annurev.physiol.70.113006.100455. [DOI] [PubMed] [Google Scholar]
- 43.Kockskamper J, et al. Emerging roles of inositol 1,4,5-trisphosphate signaling in cardiac myocytes. Journal of Molecular and Cellular Cardiology. 2008;45:128–147. doi: 10.1016/j.yjmcc.2008.05.014. [DOI] [PMC free article] [PubMed] [Google Scholar]
- 44.Bootman MD, Roderick HL. Why, where, and when do cardiac myocytes express inositol 1,4,5-trisphosphate receptors? American journal of physiology. Heart and circulatory physiology. 2008;294:H579–H581. doi: 10.1152/ajpheart.01378.2007. [DOI] [PubMed] [Google Scholar]
- 45.Zima AV, Bare DJ, Mignery GA, Blatter LA. IP3-dependent nuclear Ca2+ signalling in the mammalian heart. The Journal of physiology. 2007;584:601–611. doi: 10.1113/jphysiol.2007.140731. [DOI] [PMC free article] [PubMed] [Google Scholar]
Associated Data
This section collects any data citations, data availability statements, or supplementary materials included in this article.