

Supplemental digital content is available in the text.
Key Words: Alzheimer disease, Magnetic resonance spectroscopy, Mouse model, Neuronal loss, NOS2, Tau pathology
Abstract
Understanding the pathophysiologic mechanisms underlying Alzheimer disease relies on knowledge of disease onset and the sequence of development of brain pathologies. We present a comprehensive analysis of early and progressive changes in a mouse model that demonstrates a full spectrum of characteristic Alzheimer disease–like pathologies. This model demonstrates an altered immune redox state reminiscent of the human disease and capitalizes on data indicating critical differences between human and mouse immune responses, particularly in nitric oxide levels produced by immune activation of the NOS2 gene. Using the APPSwDI+/+/mNos2−/− (CVN-AD) mouse strain, we show a sequence of pathologic events leading to neurodegeneration,which include pathologically hyperphosphorylated tau in the perforant pathway at 6 weeks of age progressing to insoluble tau, early appearance of β-amyloid peptides in perivascular deposits around blood vessels in brain regions known to be vulnerable to Alzheimer disease, and progression to damage and overt loss in select vulnerable neuronal populations in these regions. The role of species differences between hNOS2 and mNos2 was supported by generating mice in which the human NOS2 gene replaced mNos2. When crossed with CVN-AD mice, pathologic characteristics of this new strain (APPSwDI+/−/HuNOS2tg+/+/mNos2−/−) mimicked the pathologic phenotypes found in the CVN-AD strain.
INTRODUCTION
Studies on humans have provided essential information on the type and extent of glial and neuronal damage found in Alzheimer disease (AD), but the mechanisms for the initiation of the neurodegenerative changes found in AD and for disease progression remain essentially unknown. Despite a large increase in brain imaging tools for use in humans with AD (1–3), the underlying mechanisms and causal factors that contribute to AD are currently not discoverable by relying solely on human studies. Animal modeling helps to fill this void in our knowledge base, and multiple types of models have been used to increase our understanding of AD pathogenesis (4, 5). To date, many of the available mouse models that have been used to study specific components of AD pathology, such as amyloid, can be described as “incomplete” (6). They are clearly useful, particularly when used to uncover molecular details on specific AD-related proteins and the response of a physiologic system to that protein. However, it can also be argued that models that recreate the full spectrum of AD-like pathology are critical to the field. Recreating the disease progression observed in humans with AD is essential for understanding how individual components, such as amyloid, are integrated into the pathophysiologic spectrum called AD. This type of model also enables analysis of mechanisms at disease onset and the sequence of events that are relevant to the development of the overall pathologic process. In this study, we have focused on a longitudinal analysis of disease progression in a mouse model that, like presymptomatic humans with AD, proceeds to the full spectrum of AD-like pathology, including amyloid deposition, tau hyperphosphorylation and aggregation, behavioral changes, and neuronal loss with age (7–9).
The APPSwDI/mNos2−/− (CVN; CVN-AD) mouse strain used in this longitudinal study has distinct advantages, including the following: 1) mutated human amyloid precursor protein (APP) is not overexpressed but is approximately 0.5-fold of the normal mouse APP level (10); 2) β-amyloid (Aβ) deposition is primarily caused by accumulation of Aβ around blood vessels and an apparent failure to clear Aβ from the brain, which is similar to humans with cerebral amyloid angiopathy (CAA) (11–13); 3) subsequent tau pathology is not dependent on other mutated genes such as mutated human tau (14); and 4) the difference between mouse and human NOS2 is addressed (15–17). This latter point is particularly crucial. Recent data have re-enforced the primary role of immunity in both the onset and the progression of AD in humans (18, 19) and have also underlined the differences between human and mouse immune responses (19, 20). We have now created an additional mouse strain that directly addresses the difference in immune regulation in mouse models of human disease and the role this difference plays in discovering disease onset and progression. Mice expressing the human NOS2 gene in a mouse Nos2−/− background (21) were crossed with the APPSwDI/mNos2−/− mouse model. This new strain of AD mice (APPSwDI+/−/HuNOS2tg/mNos2−/−) shows similar pathology as the APPSwDI/mNos2−/− model. Thus, this strongly re-enforces the concept that the difference in human and mouse immune-mediated nitric oxide (NO) responses is a significant factor in AD-like disease progression.
MATERIALS AND METHODS
Animals
All animal experiments were performed in accordance with protocols approved by the Institutional Animal Care and Use Committee at Duke University Medical Center under the NIH Guide for the Utilization and Care of Vertebrate Animals Used in Testing, Research, and Training and at Charles River Finland under the International Guiding Principles for Biomedical Research Involving Animals (revised 2012).
CVN-AD Mice
Homozygous APPSwDI/mNos2−/− (cerebrovascular amyloid Nos2−/− or CVN-AD) mice were produced by crossing mice expressing the vasculotropic Swedish K670N/M671L, Dutch E693Q, and Iowa D694N human APP mutations under control of the Thy-1 promoter (10) with mNos2−/− (B6 129P2Nos2 tau1Lau/J) mice (22) (Jackson Laboratory, Bar Harbor, ME), as previously described (9). Mice were genotyped using standard polymerase chain reaction methods. Mice were also genotyped for the Rd1 mutation in the Pde68 gene that causes blindness (23) and for the Rd8 mutation in the Crb1 gene that, when expressed, causes retinal pathology but is not associated with blindness (24). CVN-AD mice did not express Rd1 but were heterozygous for Rd8. Animals were fed standard mouse chow and housed under 12-hour light/12-hour dark cycles at 21 ± 3°C in an Institutional Animal Care and Use Committee–approved barrier facility under approved animal protocols.
APPSwDI+/−/Hu NOS2tg+/+/mNos2−/− (APP/huNOS2tg) Mice
A mouse strain that expressed mutated human APP in the context of expressing a human NOS2 gene was constructed by crossing the APPSwDI strain with mice expressing a human NOS2 transgene on a mouse Nos2 knockout background. The HuNOS2tg+/+/mNos2−/− strain was developed and characterized by Vitek et al (25) as previously described. The induction pattern of inductible nitric oxide synthase (iNOS) protein and the level of NO produced by activation of the human NOS2 gene in the HuNOS2tg+/+/mNos2−/− were similar to those patterns for NOS2 in human macrophages (25, 26). Importantly, and unlike C57Bl/6J control mice, the HuNOS2tg+/+/mNos2−/− mouse strain expresses the 3′ untranslated region motif found in the human NOS2 gene and that binds microRNA-939, resulting in posttranscriptional disruption of iNOS protein and significantly reduced NO production (Hoos et al, in press). Because triple homozygous mice unexpectedly died at early ages, the reconstituted mouse strain was kept heterozygous for APPSwDI and homozygous for HuNOS2tg+/+/mNos2−/−. APP/huNOS2tg mice were genotyped using standard polymerase chain reaction methods and for the presence of Rd1 and Rd8. Similar to the CVN-AD strain, the APPSwDI+/−/HuNOS2tg+/+/mNos2−/− mice did not express Rd1 but were heterozygous for Rd8.
Collection of Tissue and Immunohistochemistry
Mice used in this study were approximately 6, 12, 24, 36, 45, or 52 weeks of age. After injection with a lethal mixture of ketamine/xylazine, each mouse was intracardially perfused with approximately 25 mL of phosphate-buffered saline. Perfused brains were then rapidly removed and bisected in the midsagittal plane, and half was frozen in liquid nitrogen for use in enzyme-linked immunosorbent assay (ELISA) and Western blot analysis. The remaining half of the perfused brain was immersion-fixed in 4% paraformaldehyde and then cryoprotected by sequential passage through 10%, 20%, and 30% sucrose for 24 hours. Frozen sagittal or coronal sections (25 μm) were then cut using a sliding microtome and stored at 4°C in PBS with sodium azide to prevent microbial growth. Sections spaced either 12 or 24 slices apart (300 or 600 μm) were selected for free-floating immunohistochemistry. Immunohistochemistry was performed as previously described (9). Primary antibodies were as follows: anti–NeuN (neuron-specific nuclear) protein (MAB377, mouse monoclonal, 1:3000; Chemicon, Temecula CA), anti-Aβ (rabbit polyclonal anti-Aβ N-terminal, 1:7000; Life Technologies, Carlsbad, CA), anti-AT8 (mouse monoclonal recognizing phosphorylated Ser202/Thr205, 1:500; Thermo Scientific, Waltham MA), anti-AT180 (mouse monoclonal recognizing phosphorylated Thr231, 1:1000; Thermo Scientific), and anti–APP-A4 (MAB348, 1:500; Chemicon-Millipore, Billerica, MA). In addition, nonspecific binding of antibodies was assessed using the Innovex Biosciences Fc Receptor Blocker NB309-30 (Innovex Biosciences, Richmond, CA) following the manufacturer’s protocol or using the Vector MOM Immunodetection Kit BMK-2202 (Vector Laboratories, Burlingame CA) following the manufacturer’s protocol.
Aβ ELISA
Frozen brain samples were cryopulverized in liquid nitrogen, and the tissue was homogenized using glass beads and the Bullet Blender (NextAdvance, Averill Park, NY) in ice-cold Tris-buffered saline with 1% complete protease/phosphatase inhibitor (Thermo Scientific) and 2 mmol/L EDTA. The homogenate was then centrifuged at 16,000 × g for 1 hour at 4°C (Spin 1). The supernatant from Spin 1 containing the “soluble” Aβ40 and Aβ42 fraction was recovered to a clean tube, and the protein concentration was determined using bicinchoninic acid assay (Thermo Scientific). The pellets from Spin 1 were then rehomogenized in 70% formic acid using sonication and respun at 16,000 rpm (Spin 2) for 30 minutes at 4°C. The supernatants from Spin 2 (insoluble fraction) were removed to a new tube and slowly neutralized 1:20 with 1 mol/L Tris-buffered saline (pH 11). Protein levels in the insoluble samples were measured using the Bradford assay (Bio-Rad, Hercules, CA). The soluble and insoluble fractions were then assayed for levels of Aβ40 and Aβ42 using Covance BetaMark x-40 and x-42 ELISA kits (Covance, Dedham MA), as described by the manufacturer. Data were read on the SOFTMaxPro reader at 620 nm, and Aβ levels were expressed as picograms of Aβ per milligram of protein.
Western Blot Analysis
Frozen brain samples were cryopulverized, and the tissue was homogenized using glass beads and the Bullet Blender (NextAdvance) in ice-cold Tris-buffered saline buffer with 1% complete protease/phosphatase inhibitor (Thermo Scientific) and 2 mmol/L EDTA. Lysates were then centrifuged at 16,000 × g for 30 minutes at 4°C to pellet insoluble proteins. Supernatants were removed to clean tubes, and protein levels were measured using the BCA protein assay kit (Pierce, Rockford IL). Western blot analyses were performed as previously described (27); digital images were captured using the FluorChem Q imaging system (Cell Biosciences, Santa Clara, CA). Quantitative analysis was performed using Alpha View software (Cell Biosciences). Individual densitometry values were normalized to actin.
Sarkosyl Extraction of Aggregated Tau
Frozen cryopulverized brain samples were homogenized in buffer containing 50 mmol/L Tris (pH 8.0), 274 mmol/L NaCl, 5 mmol/L KCl, 1 mmol/L phenylmethyl-sulfonyl fluoride, and protease/phosphatase inhibitor cocktail. The homogenate was centrifuged at 1,300 × g for 15 minutes at 4°C, and the supernatant was further centrifuged at 100,000 × g for 25 minutes at 4°C. The supernatant was saved as soluble tau (S1) fraction. The pellet was homogenized in buffer containing 10 mmol/L Tris HCl (pH 7.4), 0.8 mol/L NaCl, 10% sucrose, 1 mmol/L ethylene glycol tetraacetic acid, 1 mmol/L phenylmethyl-sulfonyl fluoride, and protease/phosphatase inhibitor, and centrifuged at 100,000 × g for 25 minutes. The supernatant from this spin was incubated with 1% sarkosyl at 37°C for 1 hour and then centrifuged at 100,000 × g for 30 minutes. The supernatant was saved as sarkosyl-soluble tau (S2) fraction. The pellet, which contains sarkosyl-insoluble tau fraction, was suspended in Tris-EDTA buffer and subjected to Western blot analysis as described previously.
[1H]Magnetic Resonance Spectrometry
[1H]Magnetic resonance spectrometry ([1H]MRS) analysis was performed in a horizontal 11.7-T magnet (bore size, 160 mm) equipped with a gradient set capable of a maximal gradient strength of 750 mT/m and interfaced with a Bruker Avance III console (Bruker Biospin, Ettlingen, Germany). A volume coil (Bruker Biospin) was used for transmission, and a surface phased array coil was used for reception (Rapid Biomedical, Rimpar, Germany). Isoflurane-anesthetized mice were fixed to a head holder and positioned in the magnet bore in standard orientation relative to gradient coils.
To collect [1H]MRS data, we placed a voxel bilaterally in the hippocampus of the mouse based on the anatomic images collected, as described previously. Automatic 3-dimensional gradient echo shimming was initially used to adjust B0 homogeneity in the voxel. Water signal was suppressed using variable-power radiofrequency pulses with optimized relaxation delays to obtain B1 and T1 insensitivity. A STEAM sequence (echo time, 3 milliseconds), combined with outer volume suppression, was used for prelocalization. Three outer volume suppression blocks were used interleaved with water suppression pulses. Data were collected by averaging 512 excitations (frequency corrected for each average) with repetition time of 4 seconds, 4,096 points, and spectral width of 5 kHz. In addition, a reference spectrum without water suppression was collected from the identical voxel using the same acquisition parameters. Peak areas for metabolites (N-acetyl aspartate [NAA], alanine [Ala], choline, inositol, creatine [Cr] + phosphocreatine, glutamine, glutamic acid [GLU], and glutathione [GSH]) were analyzed using LCModel (Stephen Provencher Inc, Oakville, ONT, Canada); results were given relative to water content in tissue. Two-way analysis of variance (ANOVA) was used to determine differences between C57Bl/6J and CVN-AD mice across the 4 ages studied. Metabolic ratios were determined relative to total Cr, and then each metabolic ratio was analyzed separately, with genotype as between-subject factor and age as within-subject factor. Bonferroni posttests were performed to determine significant differences between CVN-AD and C57Bl/6J metabolic ratios at each age.
Stereologic Analysis
NeuN-immunopositive neurons were counted in the CA3 region of the left hippocampus using the optical fractionator method, as previously described (28). Every 12th sagittal section (25 μm thickness per section) was counted from the bregma to 2.0 mm lateral of the bregma on a Nikon 218912 light microscope (20× objective; Nikon, Tokyo, Japan) with computer-controlled mechanical stage interfaced with the Stereo Investigator 9 software package (MicroBrightField, Williston, VT). Only the CA3 region was counted, and animals with sections that were damaged were excluded from the analysis. All slides were precoded to ensure blinding by the observer. The number of neurons was calculated using the following equation: N = Q− × 1/ssf × 1/asf × 1/hsf, where N is total neuron number, Q− is the number of neurons counted, ssf is section sampling fraction, asf is area sampling fraction, and hsf is height sampling fraction. Data are presented as neuronal number per cubic millimeter.
Radial Arm Water Maze
CVN-AD, C57Bl/6J, and mNos2−/− mice were tested at the ages indicated using the 2-day radial arm water maze (RAWM) previously described in detail (9, 29). Briefly, a 6-arm maze is submerged in a pool of opaque water, and a platform is placed at the end of 1 arm below the surface. The mouse receives 15 trials per day for 2 days and is started in a different arm each trial, whereas the arm containing the platform remains the same. Using static visual cues, the mouse learns the position of the escape platform. The first 10 trials are considered training and alternate between a visible platform and a hidden platform. The final trials for Day 1 and all trials on Day 2 use a hidden platform. The number of errors (incorrect arm entries) is counted across a 1-minute period. The errors are averaged over 3 trials per block, resulting in 10 blocks for the 2-day period. After completion of all hidden maze tasks, mice were tested for sensory or motor deficits using the open pool task with visible platform, as described by Alamed et al (29). Mice that did not perform successfully in the open pool task were excluded from data analysis. All behavioral tests were performed with the investigator blinded to treatment groups.
Contextual Fear Conditioning Test
The contextual fear conditioning test is modified from Comery et al (30). Training and testing were conducted on 2 consecutive days, using the Coulbourn FreezeFrame system (Coulbourn Instruments, Harvard Apparatus, Holliston MA). Training consisted of placing a subject in a chamber with bright house light on and allowing exploration for 2 minutes. Afterward, an auditory cue (1,700 Hz, 80 dB, conditioned stimulus) was presented for 15 seconds. A 2-second foot shock (1.5 mA; unconditioned stimulus) was administered for the final 2 seconds of the conditioned stimulus. This procedure was repeated, and the mouse was removed from the chamber 30 seconds later. At 20 hours after the training, mice were returned to the same chamber in which the training occurred (context), and freezing behavior was recorded by a computerized camera tracking system. The automated FreezeFrame system (which digitizes the video signal at 4 Hz and compares movement of the mouse frame by frame) was used to score the amount of freezing. At the end of the 5-minute context test, mice were returned to their home cage. Two hours later, freezing was recorded in a novel environment (altered context) and in response to the cue. The mouse was placed in the novel environment, and time sampling was used to score freezing for 3 minutes. The auditory cue (1,700 Hz, 80 dB, conditioned stimulus) was then presented for 3 minutes, and freezing was again scored. Freezing scores for each subject were expressed as a percentage for each portion of the test. Memory for context (contextual memory) for each subject was obtained by subtracting the percentage of freezing in the novel environment from that in the context.
Statistical Analyses and Comparisons Between Groups
Mean ± SE values were determined for each of the outcome measures described previously at 6, 12, 24, 36, 45, and/or 52 weeks of age in the CVN-AD and control mice. Except for the [1H]MRS analysis, mixed sexes were used in the analyses, and sex-based differences were not investigated. Significance with age within strain was determined using Student t-test or 1-way ANOVA; statistical significance between genotypes and age was determined using 2-way ANOVA (GraphPad Software, San Diego, CA). Significance was set at p ≤ 0.05.
RESULTS
Expression of APP, Aβ, and Pathologic Tau With Age
We used an antibody that recognizes the N-terminus of APP to detect immunostaining for holo-APP in neurons at the earliest stages of disease. As predicted for the Thy-1 promoter, holo-APP was observed within postmitotic neuronal populations and was found beginning at 6 weeks of age. These populations included neurons in the CA3 region of the hippocampus, in the mossy fiber region of the dentate gyrus (DG), in layer 5/6 of the cortex, and in the subiculum (Figs. 1A–C). Also beginning at 6 weeks of age, amyloid deposits were observed primarily around small-diameter blood vessels in the subiculum (Fig. 1D). β-Amyloid deposits in CVN-AD mice initially appeared as “caplike” structures reminiscent of CAA found in humans with AD (11, 31) (Fig. 1G). Immunoreactive Aβ deposits increased with age, appearing within the hippocampus and cortical layers beginning at 12 weeks of age and then spreading throughout other brain regions (Figs. 1E, F, H). The increase in Aβ levels with age was quantified, using ELISA, for soluble and insoluble Aβ40 and Aβ42. Figure 1 also shows the mean ± SE values for total Aβ40 (soluble plus insoluble) and total Aβ42 (soluble plus insoluble) at 6, 12, 24, 36, and 52 weeks of age. Both Aβ40 and Aβ42 were significantly increased, but total Aβ40 rose rapidly to a plateau by 12 weeks of age then rose again at 52 weeks, whereas total Aβ42 increased significantly at each age (Fig. 1I).
FIGURE 1.

Expression of APP and Aβ in young CVN-AD mice. (A–C) Representative views of intraneuronal APP immunoreactivity in the hippocampus, subiculum, and cortex in 12-week-old CVN-AD mice. Low-power view of a sagittal section showing regions of the cortex, hippocampus, and subiculum. Scale bar = (A) 500 μm. Magnified views of the same section (cortical layer, B; CA3 neuron layer of the hippocampus, C). For higher-power views, scale bar = (B) 100 μm. Representative Aβ immunostaining in 6-week-old (D), 12-week-old (E), and 24-week-old (F) CVN-AD mice. (G, H) Higher-magnification views of Aβ immunostaining in the subiculum (G) and cortex (H) in young mice. Arrows indicate accumulation of Aβ at small blood vessels. (I) Total Aβ40 and total Aβ42 levels were quantitated by ELISA at each age and show a significant increase with age. *** p < 0.001 by 1-way ANOVA (n = 6–8 individual mice for each point). Numbers above each age block represent the total Aβ40/total Aβ42 ratio obtained at that age. Scale bars = (D–F) 500 μm.
Data from our previous studies showed the presence of hyperphosphorylated and aggregated tau in CVN-AD mice aged 52 weeks or older. To understand the onset of tau pathology in this model, we used antibodies that target phospho-PHF tau. AT8 (pThr202/pSer205) and AT180 (pThr231) react with specific phosphoepitopes on the tau protein that are phosphorylated in AD patients. Positive immunoreactivity using these antibodies is commonly recognized as a marker of disease-relevant changes in the tau phosphorylation status (32–36). AT8-positive neuron fibers were observed in the mossy fibers of the hilus at 6 weeks of age (Figs. 2A, B) and in the outer layer of the cortex in CVN-AD mice around 12 weeks of age (Figs. 2C, D). AT8 immunoreactivity increased with age and was observed in multiple locations throughout the brain, including the hilus of the DG (Figs. 2I, J, N), in association with structures that resembled neuritic plaques (Figs. 2E, G) and around blood vessels (Figs. 2I, K, M, O). Although observed as early as 12 weeks, mice at 36 and 52 weeks demonstrated significant AT8 immunostaining around blood vessels, particularly in the subiculum and cortex (Figs. 2K, O). Immunostaining for AT180 followed the same regional patterns of immunostaining with age as for AT8 in CVN-AD mice (Figure, Supplemental Digital Content 1, http://links.lww.com/NEN/A608).
FIGURE 2.

AT8 tau immunostaining in CVN-AD mice varies with age. Representative photomicrographs of CVN-AD mice at 6 weeks (A, B), 12 weeks (C, D), 24 weeks (E–G), 36 weeks (I–K), and 52 weeks (M–O) of age. mNos2−/− control mice stained with AT8 are shown in (H), (L), and (P) at 24, 36, and 53 weeks of age, respectively. Early tau pathology is observed in the DG, particularly in the mossy fibers of the polymorphic molecular layer (pml) (B is a magnified view of A; arrow denotes AT8-positive immunostain in the granule layer) and in the entorhinal cortex (Cx) (C; arrow denotes the region magnified in D). AT8-positive tau is also found around plaque-like structures in the cortex (E, G). Arrows in (E) show the regions of the cortex that are magnified in (F) and (G). With increasing age, tau AT8-positive immunostaining accumulates around blood vessels in multiple regions of the cortex and hippocampus (Hip) (I–K, 36 weeks; M–O, 52 weeks). Arrows in (I) and (M) denote the regions (a, b) shown in the magnified views of the appropriate respective panels. For low-power views, scale bar = 500 μm. For higher-magnification views, scale bar = 100 μm. Sub, subiculum.
Although AT8-immunopositive tau has been observed in other APP-only mouse models of AD primarily around cortical neuritic plaques (37–39), we sought to confirm the presence of hyperphosphorylated and aggregated tau in CVN-AD brain (Fig. 3). No detectable change in AT8-immunopositive tau was found for CVN-AD mice compared with C57Bl/6J mice by Western blot analysis using whole-brain lysates at 6 weeks (Figs. 3A, B), but increased levels of soluble hyperphosphorylated tau in whole-brain lysates were observed by Western blot analysis at 12 weeks of age (Figs. 3C, D). Although controversial, mouse tau has been shown to form insoluble aggregates in vitro and in vivo (40–43). To show aggregated tau and to follow its production with age, we assessed whole-brain lysates for the presence of sarkosyl-insoluble and hyperphosphorylated mouse tau at 6, 12, 24, and 45 weeks of age. No insoluble tau was found in CVN-AD mice at 6 or 12 weeks of age (data not shown), but strong sarkosyl-insoluble AT8-positive tau bands were observed in CVN-AD mice compared with C57Bl/6J mice at 24 and 42 weeks of age (Figs. 3E, F).
FIGURE 3.
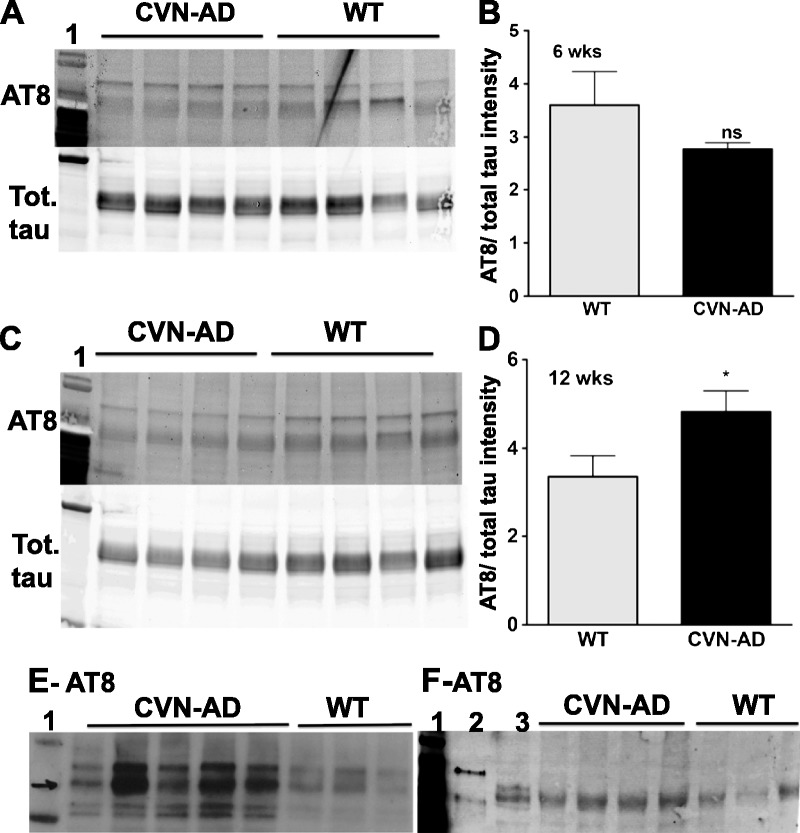
Changes in soluble and insoluble tau in CVN-AD mice. (A–D) Western blot analyses of soluble tau are shown for 6-week-old (A) and 12-week-old (C) CVN-AD and C57Bl/6J mice. Tau bands were immunostained with the AT8 antibody for phospho tau or an antibody against total tau (phospho and nonphospho) at each age, and the AT8-positive tau/total tau ratio was calculated for each mouse. Unless specified, each lane represents an individual mouse. Lane 1: MW standards. The mean ± SE values of the relative protein intensities for CVN-AD and C57Bl/6J mice are also shown (B, 6 weeks; D, 12 weeks). * p < 0.05 using Student t-test (n = 4 individual mice from each strain). (E, F) AT8-positive insoluble tau was detected using sarkosyl extraction from whole-brain lysates of 24-week-old (E) and 42-week-old (F) CVN-AD and C57Bl/6J mice. Lane 1: MW standards; Lane 2: brain lysate from mice expressing the P301L human tau mutation (aggregation control); Lane 3: soluble tau from CVN-AD mouse brain. ns, not significant; Tot., total; WT, wild type.
Neuronal Damage and Loss Increase With Age
To characterize neuron changes, we next used proton magnetic resonance spectroscopy ([1H]MRS) to compare live (isoflurane-anesthetized) CVN-AD and C57Bl/6J mice of the same ages. [1H]Magnetic resonance spectrometry is commonly used to detect changes in metabolic substrates in vivo that reflect altered neuronal integrity and has been used as a biochemical imaging tool for the diagnosis of AD (44–47). Typical neuronal and metabolic substrates that are measured using this technique include neurotransmitters (glycine [GLY], g-aminobutyric acid [GABA], glutamate [GLU] and taurine [TAU]), metabolites (alanine [Ala], phospho-creatine [PCr], creatine [Cr], myo-inositol [INS], choline [CHO], phosphocholine [PCh]; glycerolphosphocholine [GPC], N-acetyl aspartate [NAA]; N-acetyaspartylglutamate [NAAG]), and antioxidants (i.e. glutathione [GSH]).
Anesthetized CVN-AD male mice were imaged using an 11.7-T magnet at 12, 24, 36, and 52 weeks of age, and the metabolic substrate levels in the hippocampus were compared with levels of the same substrates in the hippocampus of age-matched C57Bl/6J mice. Figure 4 shows the mean levels of brain metabolites measured at 12, 24, 36, and 52 weeks of age; data are presented as the ratio of metabolite to Cr levels. Creatine has high intermeasurement stability and is generally considered to be a useful internal reference for measurement variability (45, 48). We observed small but statistically significant reductions in Ala/Cr ratio at 12 weeks and in GSH/Cr ratio at 24 weeks. However, these changes were apparently transient and were no longer evident at either 36 or 52 weeks of age. Myo-inositol levels, generally believed to be an indicator of glial “activation” (49–51), were significantly increased at 24, 36, and 52 weeks of age. Changes in neurotransmitter and neuronal indices were clearly shown at 52 weeks of age. Ratios of GLU, NAA, or NAAG to Cr were significantly reduced in CVN-AD mice. Importantly, the NAA/INS ratio in CVN-AD mice decreased from 1.18 at 12 weeks of age to 0.99 at 52 weeks of age, whereas the ratio in C57Bl/6J mice was 1.27 and 1.26 for 12 and 52 weeks, respectively. A declining NAA/INS ratio has been used as a diagnostic test for individuals with AD and is associated with an approximately 75% predictive value for AD (48, 49).
FIGURE 4.

[1H]Magnetic resonance spectrometry in vivo analysis of brain metabolites shows changes consistent with neuron loss in CVN-AD mice versus C57Bl/6J control wild-type (WT) mice with age. Data represent the mean ± SE ratios of metabolite levels to Cr levels obtained from anesthetized male CVN-AD mice imaged using [1H]MRS with a 11.7-T magnet at 12 weeks (A), 24 weeks (B), 36 weeks (C), and 52 weeks (D) (n = 8–12 male mice for each group). Effects of age, genotype, and age-genotype interaction were determined separately for each individual metabolic ratio. Using 2-way ANOVA, we found a significant effect of genotype for GLU (p < 0.008), INS (p < 0.0001), NAA (p < 0.003), and NAAG (p < 0.0005); a significant effect of age for GLU (p < 0.02); and a significant age-genotype interaction for GSH (p < 0.028). Asterisks indicate significant differences between CVN-AD and age-matched C57Bl/6J mice: * p < 0.05, ** p < 0.01 for individual metabolite ratios. CHO, choline; GABA, γ-aminobutyric acid; Glc, glucose; GLN, glutamine; GPC, glycerophosphocholine; NAAG, N-acetylaspartylglutamate; PCh, phosphocholine; PCr, phosphocreatine; TAU, taurine.
We confirmed the presence of hippocampal neuron loss in the CVN-AD mice brain using immunostaining with NeuN, an antibody that marks neuronal nuclei (52), in CVN-AD mice versus mNos2−/− control mice at 12 weeks (Figs. 5A–D), 36 weeks (Figs. 5E–H), and 52 weeks (Figs. 5I–L) of age. Thinning of the CA2/CA3 layer of cells was clearly observed at 36 weeks (Figs. 5E, F) and 52 weeks (Figs. 5I, J) in CVN-AD mice compared with mNos2−/− control mice. Neuronal numbers were determined using the optical fractionator method and unbiased stereology. A statistically significant decrease in neuronal numbers was observed at 36 and 52 weeks of age compared with either CVN-AD mice at younger ages or mNos2−/− control mice (Fig. 6). However, there was no significant difference between the numbers of neurons lost between 36- and 52-week-old CVN-AD mice.
FIGURE 5.

Loss of NeuN-immunopositive neurons in the hippocampus in CVN-AD mice starting at 36 weeks of age. (A–J) Representative photomicrographs depicting the CA2/CA3 subregion of the hippocampus of CVN-AD mice at 12 weeks (A, B), 36 weeks (E, F), and 52 weeks (I, J) of age. Panels (C, D) (12 weeks), (G, H) (36 weeks), and (K, L) (52 weeks) show representative age-matched Nos2−/− control mice. For low-power view, scale bar = (E) 500 μm. For high-power view, scale bar = (F) 100 μm. Sub, subiculum.
FIGURE 6.

Neuron numbers in the CA2/CA3 region of CVN-AD versus mNos2−/− mice. NeuN-immunopositive neurons in the CA2/CA3 region were counted using unbiased stereology for CVN-AD and mNos2−/− control mice at 12, 24, 36, and 53 weeks of age. Data are presented as mean ± SE. *** p < 0.001 for difference between mouse strains using 2-way ANOVA (n = 5–9 mice analyzed at each age).
CA1 neuron loss was also readily observed in coronal sections of the hippocampus in CVN-AD mice using NeuN immunostaining (Fig. 7). Neuronal layers in the intermediate zone of the hippocampus were thinned or missing compared with either C57Bl/6J or mNos2−/− mice. This region has been shown to regulate both spatial and emotion-based memory and learning (53).
FIGURE 7.
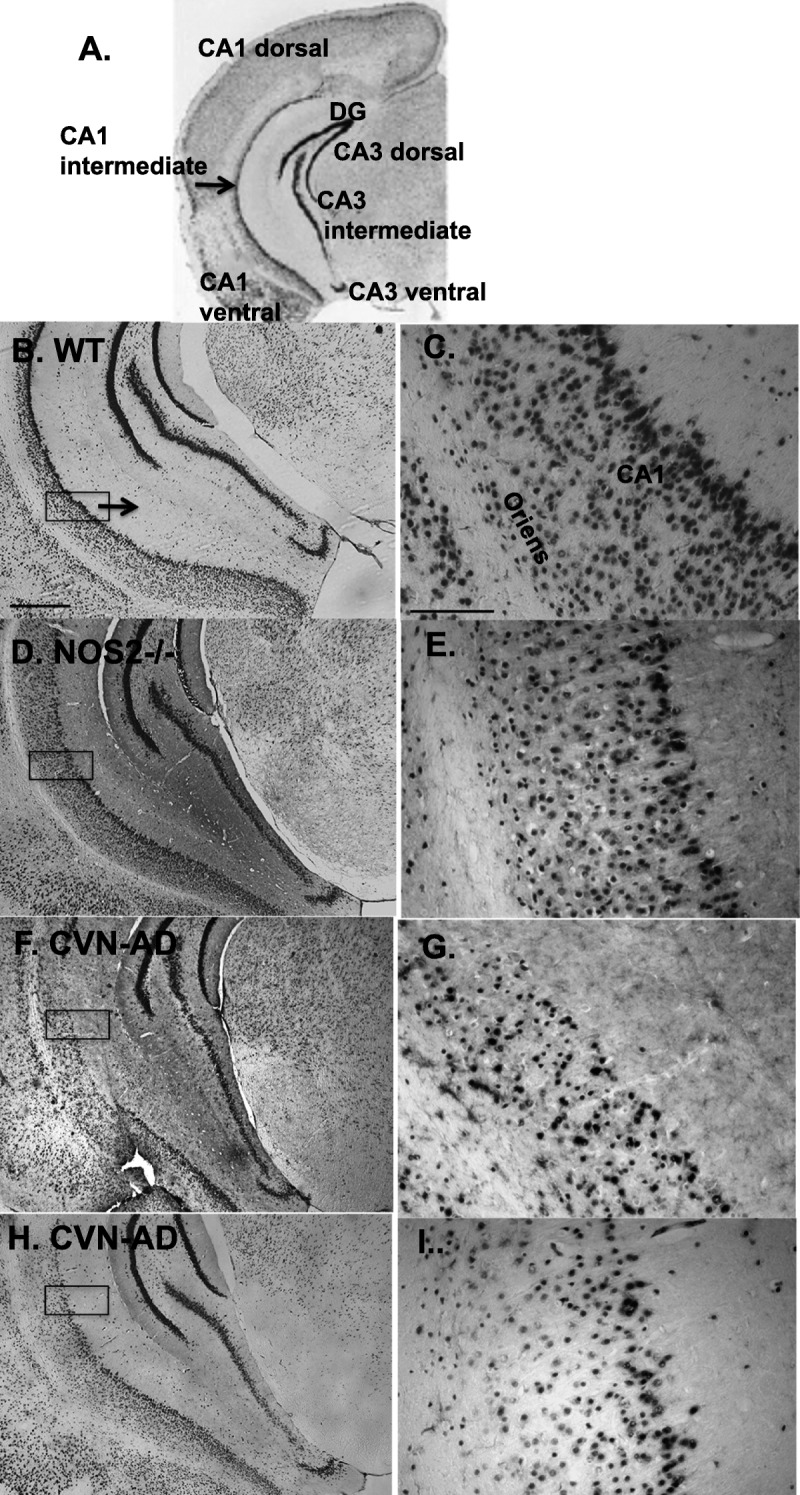
Neuron loss in the CA1 intermediate zone is observed in CVN-AD mice. (A–I) Subregions of the mouse hippocampus are defined in (A). Representative views of neuronal layers stained for NeuN in the CA1 intermediate zone are shown for C57Bl/6J wild-type (WT) mice (B, C) and mNos2−/− mice (D, E). Control WT mice show an uninterrupted, dense CA1 pyramidal cell layer. CVN-AD mice demonstrate an aberrant CA1 pyramidal layer with an apparent altered density of neurons (F–I). Boxes on the left panels represent areas that are magnified in the adjacent right panels. Left: scale bar = (B) 500 μm. Right: scale bar = 100 μm.
Memory and Learning
Reduced memory and learning behavior is a well-described characteristic of AD patients (54, 55) and has been observed in aged mouse models of AD, including the CVN-AD mouse at 52 weeks of age (56, 57). To examine hippocampal changes that are correlated with behavioral outcomes at each age and with disease progression, we used the RAWM, which tests spatial memory and learning (29, 58), and contextual fear conditioning test, which tests contextual integration and fear memories (59). CVN-AD mice showed a significantly increased number of errors in finding the escape platform during the RAWM compared with either mNos2−/− or C57Bl/6J control mice at 24, 36, and 52 weeks of age (Figs. 8A–C), but not at 12 weeks (data not shown). We also compared the number of errors for the last day of trials for CVN-AD mice at each age (Fig. 8D). These data show that although spatial memory was altered in 24- and 36-week-old CVN-AD mice versus control mice, there were no significant differences in memory between these 2 ages. There was, however, a significant increase in severity of memory loss at the 52-week time point versus the earlier time points in CVN-AD mice. mNos2−/− control mice did not show age-dependent differences in memory and learning from 12 to 52 weeks (Figure, Supplemental Digital Content 2, http://links.lww.com/NEN/A609). Failure to find the platform was not attributable to blindness. CVN mice were negative for the Rd1 gene that is known to cause blindness in mice, and all mice tested in the RAWM were additionally assessed using the open pool task with visible platform. Contextual fear memory was also significantly reduced beginning at 24 weeks of age and worsened with age and disease progression (Fig. 8E). Additional behavioral testing was performed. Figure, Supplemental Digital Content 3, http://links.lww.com/NEN/A610, shows Morris water maze performance data in CVN mice versus C57Bl/6J mice at 52 weeks of age. Figure, Supplemental Digital Content 4, http://links.lww.com/NEN/A611, shows open field performance data in CVN mice versus C57Bl/6J mice at 12 and 52 weeks of age.
FIGURE 8.

Spatial memory and contextual fear memory are altered in CVN-AD mice with age. (A–C) Mean ± SE number of errors exhibited in the RAWM task during 2 days of trials (Materials and Methods section) in CVN-AD mice versus mNos2−/− and control mice at 24 weeks (A), 36 weeks (B), and 52 weeks (C) of age. *** p < 0.001 by 2-way ANOVA (n = 10–20 mice per group). (D) Comparison of the memory retention phase of the RAWM across age and genotype. p < 0.001 for 52 weeks versus 36 or 24 weeks by 2-way ANOVA. (E) Mean ± SE values for contextual memory for each mouse obtained by subtracting the percentage of freezing in the novel environment from that in the context. * p < 0.05, ** p < 0.01 (n = 10 mice per group). WT, wild type.
Reconstitution of the Human NOS2 Gene in CVN-AD Mice
Although the lack of iNOS-mediated NO production in the CVN-AD model is a phenocopy of the low NO level observed in human immune responses, this model does not fully mimic the immune/redox environment that is typical of human brain that expresses human NOS2. To begin to address this problem, we generated an additional strain of mice that expresses the human NOS2 gene on a mNos2 knockout background. When induced, NO levels that are more representative of human immune responses are produced. This transgenic mouse is termed the HuNOS2tg/mNos2−/− strain, and the initial description of its characteristics has been previously published (21). The HuNOS2tg+/+/mNos2−/− strain was then crossed with the APPSwDI/mNos2−/− strain to generate a triple transgenic that expresses a mutated human APP gene (APPSwDI) and 2 copies of the human NOS2 transgene on a disrupted mNos2 knockout background. Mice that were homozygous for APPSwDI died at variable ages between 30 and 50 weeks of age. Survival curves were not established. The new line was then kept heterozygous as for APPSwDI (APPSwDI+/−/HuNOS2tg+/+/mNos2−/−) and was termed APP/huNOS2tg mice. These mice were then examined for brain pathology at different ages.
Typical AD-like pathology was observed in the brains of APP/huNOS2tg mice, which closely resembled the neuropathologic patterns found in CVN-AD mice. As predicted by the expression of mutated APP genes, Aβ deposits were observed throughout the cortex and hippocampus (Figs. 9A, B). In addition, ELISA of total Aβ (soluble + insoluble Aβ40 and Aβ42) levels in whole-brain lysates from 36- and 52-week-old APP/huNOS2tg mice revealed a significant increase with age. Mean values rose from 79,050 ± 23,500 to 193,000 ± 48,000 pg/mg protein (p < 0.05; n = 4–7 mice), an approximately 2.3-fold increase. We also observed AT8-positive immunoreactivity to hyperphosphorylated tau in the cortex of APP/huNOS2tg mice at 52 weeks of age (Figs. 9C, D). Similar to CVN-AD mice, sarkosyl-insoluble tau was detected in brain lysates at 52 weeks of age (Fig. 9E).
FIGURE 9.

APPSwDI+/−/HuNOS2tg+/+/mNos2−/− (APP/huNOS2tg) mice show Aβ-immunoreactive deposits accompanied by AT8-immunopositive mouse tau. (A, B) Representative photomicrographs show abundant Aβ deposition in the cortex (A) and hippocampus (B) of APP/huNOS2tg mice at 52 weeks of age. (C) Hyperphosphorylated (AT8-positive) tau is found within neurons in the cortex (upper arrow) and around blood vessels in the subiculum (lower arrow) at 52 weeks of age (similarly to that observed in the CVN-AD mouse brain). (D) AT8 immunostaining in a representative age-matched HuNOS2tg/mNos2−/− control mouse brain. Scale bars = (A, B) 100 μm; (C, D) 500 μm. (E) Western blot analysis of sarkosyl-insoluble AT8-immunopositive tau in APP/huNOS2tg mice (Lanes 4, 5, 6) versus HuNOS2tg control mice (Lanes 7, 8, 9) and C57Bl/6J control mice (Lane 1). Insoluble aggregates were also isolated from mice expressing the human P301L tau mutation and used as positive control for detection of aggregated tau (Lane 2). Soluble AT8-positive tau from APP/huNOS2tg brain is shown in Lane 3.
To determine whether neuronal changes were observed in APP/huNOS2tg, we stained brain sections for NeuN and counted neurons using unbiased stereology in CA2/CA3 hippocampal regions. Representative views of the hippocampi and corresponding CA3 regions at 52 weeks of age are shown in Figures 10A, B for HuNOS2tg+/+/mNos2−/− control mice and in Figures 10C, D for APP/huNOS2tg mice. Using unbiased stereology, we detected a significantly decreased number of neurons in the CA3 region in APP/huNOS2tg mice compared with either mNos2−/− or HuNOS2tg+/+/mNos2−/− control mice (Fig. 10E). Behavioral changes were also observed in APP/huNOS2tg mice. Radial arm water maze tests showed a significantly increased number of errors in APP/huNOS2tg mice compared with either mNos2−/− or HuNOS2tg+/+/mNos2−/− control mice at 52 weeks of age (Fig. 10F). However, these deficits were only found on the second day of trials, which comprised the memory retention phase of the learning and memory behavioral task. This difference in response from CVN-AD mice may in part be caused by the expression of only 1 copy of the APPSwDI gene. APP/huNOS2tg mice are heterozygous for APP.
FIGURE 10.

Neuron loss and behavioral deficits in APP/huNOS2tg mice. (A–D) Representative brain sections from HuNOS2tg/mNos2−/−, mNos2−/−, and APP/huNOS2tg mice were immunostained for NeuN to identify neurons. Typical views of the CA2/CA3 region of the hippocampus in HuNOS2tg/mNos2−/− mice at low magnification (A) and higher magnification (B). Typical views of the same region in 52-week-old APP/huNOS2tg mice (C, D). (E) Numbers of neurons per cubic millimeter are significantly decreased in APP/huNOS2tg mice versus either HuNOS2tg/mNos2−/− or mNos2−/− mice. p < 0.001 using 2-way ANOVA (n = 5–9 mice per group). (F) The mean number of errors made in finding the platform in the RAWM for APP/huNOS2tg mice versus either HuNOS2tg/mNos2−/− or mNos2−/− mice. p < 0.001 using 2-way ANOVA (n = 10 –15 mice per group). Scale bars = (A, C) 500 μm; (B, D) 100 μm. ***p < 0.001.
DISCUSSION
Our detailed longitudinal study on disease progression in the CVN-AD mouse model provides an integrated picture of brain response to the production of mutated human APP protein across time. Although this model represents early-onset (familial) AD rather than late-onset (sporadic) AD, it provides us the opportunity to explore the vulnerability of key brain regions, such as the subiculum and hippocampus, when Aβ deposition is increased. Equally importantly, the CVN-AD model allows the study of how tau pathology may interplay with amyloid deposition in the same regions. Regionalism of amyloid deposition is characteristic of mouse models that use mutated human APP or PS1 gene expression governed by the Thy-1 or prion protein promoter. For example, APPSw/Tg2576 (60), APPSLPS1K1, (61) and 5xFAD (62) mice express mutated human APP protein at the fifth and sixth layers of the cortex; in the CA3, CA1, and DG of the hippocampus; and in the subiculum early in the disease. Similar APP expression and Aβ deposition patterns are found in CVN-AD mice even though the expression levels of mutated human APP within neurons are much lower than those in other models. β-Amyloid deposition in our model is found at the earliest time points around small blood vessels in the subiculum and seems to be restricted initially to this area. These Aβ deposits are consistent with the local release of Aβ from neurons in the region and with the vasculotropic nature of Dutch/Iowa mutations (13, 63, 64). The Dutch/Iowa mutations in APP lead to abnormal Aβ aggregation around blood vessels at the blood-brain interface (i.e. CAA). Individuals expressing Dutch/Iowa APP mutations can show hemorrhages, infarcts, and microbleeds in severe cases (64–66). The high degree of amyloid accumulation around the small-diameter vessels implies that the normal flux of Aβ peptides via the brain’s fluid drainage pathways may be obstructed as an early pathologic event (11, 67). In addition, restriction of critical transport mechanisms across the blood-brain barrier or the induction of an immune response by pericapillary deposits may rapidly alter the normal parenchymal microenvironment. Disrupted neurovascular unit function, including damaged glial end feet and loss of aquaporin and potassium channel function, has been reported for CVN-AD mice at 52 weeks of age (68). However, other mouse models of AD also show rapid and high levels of Aβ deposition in the subiculum, particularly when expression levels of the mutated APP gene are extremely high (60, 61, 69). A preferential accumulation of amyloid in the subiculum, the involvement of Aβ in blood vessels, and the potential for damage to the neurovascular unit in these models are essentially equivalent to the CVN-AD model. How this profile of amyloid deposition leads to downstream AD pathology, including neuronal loss in humans, remains unclear. Unlike CVN-AD mice, the APPSwDI parent mouse strain and other mouse models that show accumulation of Aβ in the subiculum do not show neuronal loss in this region (70). Models that coexpress multiple APP mutations and PS1 mutations show limited neuronal loss in the pyramidal layers of the CA1 region, but changes in subiculum neuronal number have not been reported (38, 71).
Involvement of Tau
An association of AT8-positive tau with Aβ-laden blood vessels in the subiculum is also found in CVN-AD mice at the earliest age studied and continues with increasing age. Perivascular accumulation of hyperphosphorylated tau has been observed in the presence of CAA in humans with AD (11, 31, 72). Using old (>12 months) CVN-AD mice, Van Nostrand et al (73) found hyperphosphorylated tau within neurons, astrocytes, and microglia surrounding the small blood vessels. We speculate that the accumulated tau around the vasculature may reflect a disrupted process of either clearance of released tau or cell-to-cell transmission of tau, perhaps caused by the trapping of Aβ in the vessel wall. Recent data from multiple laboratories have now demonstrated that injection of pathologic (fibrillar) tau into the brain parenchyma of naive C57Bl/6J mice induces intraneuronal tau pathology that “spreads” to other regions of the brain (74–77). The mechanisms underlying this “spreading” process remain unknown, but altered patterns of uptake may be generated around amyloid-laden blood vessels. How abnormal tau affects the function of the neurovascular interface is currently unknown. Again, however, the subiculum is implicated as one of the first regions of the brain to be impacted by tau pathology.
Along with the CA1 and CA3 regions of the hippocampus, the subiculum is a vulnerable region in AD patients and shows pathologic alterations, including atrophy, early in the disease process (78–80). Damage to this region would impact brain function because the subiculum is a critical relay between the entorhinal cortex and the hippocampus. Neurons displaying hyperphosphorylated and aggregated tau protein are well known to pass through the subiculum in AD patients. The exact relationship of hyperphosphorylated (i.e. AT8-positive) and aggregated tau with neuronal loss, however, has been controversial (6, 81–88). This relationship has been particularly difficult to study in mouse models of AD because of the inability to show significant tau pathology in amyloid models unless mutated human tau proteins (e.g. P301L tau mutation) are coexpressed (89). Because mutations may dictate the development of pathologic tau differently when compared with the absence of mutations, the CVN-AD mice provide unique insights into changes in mouse tau as the disease progresses with age. The earliest appearance of hyperphosphorylated tau, as judged by AT8 immunostaining, was found at 6 and 12 weeks of age in the subiculum associated with blood vessels but was also found in neurons in the entorhinal cortex, the DG, the polymorphic layer and mossy fibers in the hilus, and the CA3 neuronal targets of these fibers. These expression patterns closely match those in AD (84, 90) and, with the exception of the subiculum and CA3 region of the hippocampus, do not seem to correlate directly with marked APP expression or amyloid deposits at the same age. Interestingly, the deposition of hyperphosphorylated tau in a specific subset of CA3 neurons has been recently demonstrated in AD patients and is proposed to be instrumental to the loss of the interconnecting neuronal networks between the entorhinal cortex and the hippocampus (91). Also as in AD, our data from CVN-AD mice clearly show that tau hyperphosphorylation increases with age in neurons throughout the hippocampus and cortex and in association with amyloid plaques. Detection of sarkosyl-insoluble tau in CVN-AD mice confirms the presence of disease modifications to tau that result in aggregate formation. These data further support earlier studies by Kampers et al (43) and Adams et al (92), who have shown that mouse tau can form insoluble aggregates. Finally, the hyperphosphorylated and aggregated tau we observed in the CVN-AD mice is also found in APP/huNOS2tg mice. Reconstitution of human NOS2 into a mouse Nos2−/− background (as in APP/huNOS2tg mice) produces the same general phenotype as the CVN-AD mice and a different phenotype from mice that express mutated APP or mNos2 alone. These data reinforce the concept that a difference between human and mouse NO production contributes to the different patterns of pathology found in mouse models of AD and humans with AD.
Detecting Neuronal Damage in Young Mice
Although the pathologic interaction of Aβ and hyperphosphorylated tau is implicated in neuronal loss in AD, the mechanisms that lead to cell death remain unclear. Atrophy in the hippocampus and subiculum is well-described, and critical features of disease progression in AD are associated with neuron loss (28, 93). Thus, mouse models that show full progression to neuronal loss are critical. As previously reported, CVN-AD mice aged 12 months or older show extensive neuron loss in the hippocampus and subiculum (9). Using in vivo imaging with [1H]MRS, we compared changes in hippocampal metabolites in CVN-AD mice at 12, 24, 36, and 52 weeks of age with those in C57Bl/6J mice at the same age. APP/huNOS2tg mice were not studied in this manner. The high field strength we used facilitated the reliable detection of a wide variety of metabolites at each of time point, thus allowing us to detect early changes in brain functioning. We observed changes in specific metabolites that reflect the altered metabolic states of the hippocampus throughout disease progression, beginning with reduced levels of Ala found only in 12-week-old mice. Interestingly, this abnormal [1H]MRS finding corresponds in time to a significant increase in the overall activity levels (hyperactivity) of CVN-AD mice compared with C57Bl/6J control (WT) mice at this age. It did not correspond to altered contextual memory or spatial memory.
A transient decrease in GSH levels was observed at 24 weeks of age in CVN-AD mice. Glutathione is an antioxidant found primarily in astrocytes that functions as a critical regulator of cellular and tissue redox state (94). Altered ratios of reduced GSH to oxidized GSSG are believed to be a principal factor in the oxidative stress associated with AD (95). Therefore, it is likely that the reduced GSH levels observed at this age signal worsening oxidative stress before measurable neuronal loss. The change in antioxidant profile was associated in time and disease stage with increased brain INS levels. Similar to GSH, INS is thought to represent glia parameters, and increased hippocampal INS levels have been clearly shown in AD patients (44, 47, 48, 51). These changes are not consistently observed in other mouse models of AD, such as the APP/PS1 mice (96). CVN-AD mice at 24 weeks of age also displayed significantly reduced contextual memory and increased errors in the RAWM task. Later stages of disease progression demonstrated changes in metabolites that are consistent with increasing glial and neuronal damage. Increased INS levels were found at both 36 and 52 weeks of age, whereas decreased levels of NAA and GLU + GLN were found at 52 weeks of age. These [1H]MRS data from CVN-AD mice brains are highly reminiscent of changes in metabolites observed in AD. Humans diagnosed as having either mild cognitive impairment or more advanced AD show progressively decreased levels of NAA/Cr and GLU + GLN/Cr ratios compared with control age-matched individuals (44, 97).
Neuronal Loss in the Critical Relay Between the Entorhinal Cortex and the Hippocampus
Here, we specifically focused on neuronal loss in the hippocampus, particularly in the CA2/CA3 subregion. The importance of this subregion has been underscored by Braak et al (84), who hypothesized that the appearance of hyperphosphorylated tau in the entorhinal cortex to the DG to the CA2/CA3 circuitry serves as an indicator of AD progression in humans. Furthermore, interconnections between CA2/CA3 neurons and neurons in the DG and entorhinal cortex play critical roles in memory and learning behaviors in humans and mice (54, 98). Thus, loss of CA2/CA3 neurons is likely to disrupt these circuits. Our results demonstrated no significant change in CA2/CA3 neuronal number in 12- or 24-week-old CVN-AD mice versus control mice. By 36 weeks, however, there was a 30% loss of neurons, with no further increased loss at 52 weeks. These data suggest that a specific subset of CA2/CA3 neurons may be particularly vulnerable in CVN-AD mice. The same area is damaged in old APP/huNOS2tg mice, which also show significant neuronal loss. Interestingly, using magnetic resonance imaging, Hanseeuw et al (99) found a significant increase in CA2 atrophy compared with other hippocampal subregions in mild cognitive impairment patients with amnesia.
The neuronal damage and loss observed in the hippocampus of CVN-AD and APP/huNOS2tg mice are clearly significant factors in the learning and memory deficits observed in these mice. However, the behavioral profiles of CVN-AD and APP/huNOS2tg mice resemble the behavioral outcomes observed in other models of AD that do not show neuronal death (100). As in other AD models, CVN-AD mice show behaviors that include decreased contextual fear conditioning and increased spatial memory loss. These behavioral changes are found as early as 12 weeks of age and do not correlate with our data on neuronal loss at this age. Rather, any disease-related damage to the memory circuitry is likely to represent the disruption of synapses and neuronal plasticity, resulting in abnormal hippocampal network circuitry before overt measurable neuronal loss. In this regard, Hoos et al (27) recently published a detailed analysis of unbiased protein expression levels in CVN-AD mice at 6, 12, 24, and 42 weeks. They used liquid chromatography–tandem mass spectrometry to quantitate protein levels and the accompanying phosphorylation profiles of the same brain lysate samples. Multiple proteins that are related to regulation of neuronal plasticity (e.g. α-internexin or ninein) (101, 102), to the structure and function of synapses (e.g. bassoon, Shank2, and syntaxin B) (103), and, importantly, to regulation of visual spatial memory (e.g. disks large 2 [DLG2]) (104) are significantly altered in CVN-AD mice. With continued disease progression in CVN-AD mice, however, regional neuronal loss is likely to add to the behavioral deficits generated by synaptic damage, as observed in the RAWM results at 52 versus 36 weeks of age.
The behavioral changes in CVN-AD mice and other mouse models of AD include both spatial memory and emotional memory deficits. Recent studies by Fanselow and Dong (53), Gallagher and Koh (54), and Bast (105) have provided a more detailed view of the anatomic regional connections in the hippocampus that lead to changes in memory. In general, spatial memories are formed as part of the synaptic interconnections of the dorsal and intermediate hippocampi (CA1d/CA3d), whereas the ventral hippocampus (CA1v/CA3v) is associated with emotional memories. As discussed by Fanselow and Dong (53) and Bast (105), it is likely that the neurons in the intermediate zone between the dorsal region and the ventral region play the important task of integrating and linking the emotional/motivational aspects of forming memory with the visual spatial information. Importantly, we show disruption of CA1 intermediate zone neurons in CVN-AD mice. Damage to this area is predicted to impact both cognitive and motivational behavioral outcomes, as we have observed in CVN-AD mice. Gene mapping has also now provided identification of genes in specific regions of the dorsal, intermediate, and ventral zones (106). Candidate genes that overlap with the intermediate zone of the CA1 region were identified by Thompson et al (106) and include kctd4 (potassium channel tetramerization domain containing-4), pkp2 (plakophilin gene family) and dkk3 (dickkopf gene family). The roles of these genes in AD are unknown, but further study of their functional outcomes may ultimately provide insights into the cognitive deficits that occur in AD.
Relationship With NO: Adding Back the Human NOS2 Gene
The unique nature of the CVN-AD mouse model is attributable, at least in part, to the primary role of NO in the redox regulation of the brain environment and to NO-mediated regulation of immune response in neurodegenerative diseases (107). The immune response is clearly a critical event in neurodegenerative processes in AD. Zhang et al (18) used an integrated network analysis of genes associated with late-onset AD to demonstrate that immune/microglia gene networks have the strongest degree of disease association and the highest correlation with AD neuropathology compared with other gene subsets. We have made mice that represent a phenotypic copy of the immune/redox environment by lowering iNOS-mediated NO production to zero (APPSwDI/mNos2−/− CVN-AD strain) and now show a second mouse model where the NO levels are not zero but instead represent more human-like NO levels. This was accomplished by reconstituting the human NOS2 gene into the APPSwDI/mNos2−/− strain. APP/huNOS2tg mice contain gene DNA-regulatory sites associated with NO production in humans (Hoos et al, in press). Our data from APP/huNOS2tg mice show characteristic pathologic features similar to those observed in CVN-AD mice, including accumulation of amyloid deposits throughout the parenchyma and around capillaries, the presence of hyperphosphorylated and sarkosyl-insoluble aggregates of tau, neuronal loss, and behavioral deficits. Both mouse strains display pathologic features that are not typically observed in other models and may be used to improve our understanding of AD.
The failure to demonstrate accompanying tau pathology when Aβ is overexpressed and the lack of neuronal death in the most commonly used AD models have been problematic. For example, despite abundant Aβ deposition in the subiculum and hippocampus, neuronal loss in the parent APPSwDI mouse strain and in many other AD mouse models is not measurable. Thus, extracellular Aβ deposition alone is apparently not a primary requirement for significant neuronal death. It is likely, however, that excess intraneuronal Aβ does damage neurons. This exception is found in the APP23, APP-PS1 double-transgenic, and APP-PS1K1 transgenic strains that coexpress high levels of mutated APP and PS1 (38, 61, 71). The mechanism of damage in these mice likely involves changes in Aβ handling within neurons and is clearly different from the CVN-AD strain, which shows lower-than-endogenous expression levels of APP. Accompanying tau pathology that is characteristic of AD is also not observed in these other mouse models and consequently limits further understanding of the sequence of events in disease progression. In contrast, our data from the CVN-AD model confirm that immune activation is a critical event and that NO participates in both tau and neuronal pathology. Changing NO levels may shift the vulnerability to tau aggregate formation, potentially by direct nitration of the tau protein (108, 109) and/or by indirect mechanisms such as differential regulation of caspase-3 activation (7). Low NO, as found in CVN-AD and APP/huNOS2tg mice, is predicted to promote aggregate formation and is consistent with the increased level of sarkosyl-insoluble tau in both CVN-AD and APP/huNOS2tg mice strains. The production of pathologic tau proteins in the entorhinal cortex to the subiculum to the hippocampus circuitry and the critical role of these pathways as an information transfer hub between the entorhinal cortex and the hippocampus may be a causative factor in the death of neurons in the CA1 and CA2/CA3 regions (106, 110–112). The maintenance of the distinct AD-like disease phenotype with the reconstitution of human NOS2 into the mouse Nos2 knockout background provides direct supportive data for the concept that the differences between human and mouse immune-based regulation of NO may be at least one critical factor that impacts the level and type of disease-related pathologies observed in mouse models of AD.
Supplementary Material
Footnotes
Work presented in this manuscript was supported by grants from the National Institutes of Health National Institute on Aging (Grant Nos. AG031124 and AG031845 to Carol A. Colton) and Charles River Discovery Research Services Finland.
Jukka Puoliväli, Taneli Heikkinen, Juho Oksman, Olli Jääskeläinen, Kimmo Lehtimäk, Teemu Laitinen, and Nina Vartiainen are employees of Charles River Finland. Duke University Medical Center has licensed the CVN-AD mice to Charles River Laboratories. Carol A. Colton and Michael P. Vitek serve as consultants for Charles River Laboratory. Michael P. Vitek is a founder of Cognosci Inc and Oncotide Pharmaceuticals Inc. Conflicts of interest for Carol A. Colton and Michael P. Vitek are approved and managed by the Duke Conflict of Interest Committee.
Supplemental digital content is available for this article. Direct URL citations appear in the printed text and are provided in the HTML and PDF versions of this article on the journal’s Web site (www.jneuropath.com).
REFERENCES
- 1. Schindler SE, McConathy J, Ances BM, et al. Advances in diagnostic testing for Alzheimer disease. Mo Med 2013; 110: 401– 5 [PMC free article] [PubMed] [Google Scholar]
- 2. Teipel SJ, Grothe M, Lista S, et al. Relevance of magnetic resonance imaging for early detection and diagnosis of Alzheimer disease. Med Clin North Am 2013; 97: 399– 424 [DOI] [PubMed] [Google Scholar]
- 3. Weiner MW, Veitch DP, Aisen PS, et al. The Alzheimer’s Disease Neuroimaging Initiative: A review of papers published since its inception. Alzheimers Dement 2013; 9: e111– 94 [DOI] [PMC free article] [PubMed] [Google Scholar]
- 4. Gama Sosa MA, De Gasperi R, Elder GA. Modeling human neurodegenerative diseases in transgenic systems. Hum Genet 2012; 131: 535– 63 [DOI] [PubMed] [Google Scholar]
- 5. Kitazawa M, Medeiros R, Laferla FM. Transgenic mouse models of Alzheimer disease: Developing a better model as a tool for therapeutic interventions. Curr Pharm Des 2012; 18: 1131– 47 [DOI] [PMC free article] [PubMed] [Google Scholar]
- 6. Radde R, Duma C, Goedert M, et al. The value of incomplete mouse models of Alzheimer’s disease. Eur J Nucl Med Mol Imaging 2008; 35 (Suppl 1): S70– 74 [DOI] [PubMed] [Google Scholar]
- 7. Colton CA, Vitek MP, Wink DA, et al. NO synthase 2 (NOS2) deletion promotes multiple pathologies in a mouse model of Alzheimer’s disease. Proc Natl Acad Sci U S A 2006; 103: 12867– 72 [DOI] [PMC free article] [PubMed] [Google Scholar]
- 8. Colton CA, Wilcock DM, Wink DA, et al. The effects of NOS2 gene deletion on mice expressing mutated human AbetaPP. J Alzheimers Dis 2008; 15: 571– 87 [DOI] [PMC free article] [PubMed] [Google Scholar]
- 9. Wilcock DM, Lewis MR, Van Nostrand WE, et al. Progression of amyloid pathology to Alzheimer’s disease pathology in an amyloid precursor protein transgenic mouse model by removal of nitric oxide synthase 2. J Neurosci 2008; 28: 1537– 45 [DOI] [PMC free article] [PubMed] [Google Scholar]
- 10. Davis J, Xu F, Deane R, et al. Early-onset and robust cerebral microvascular accumulation of amyloid beta-protein in transgenic mice expressing low levels of a vasculotropic Dutch/Iowa mutant form of amyloid beta-protein precursor. J Biol Chem 2004; 279: 20296– 306 [DOI] [PubMed] [Google Scholar]
- 11. Attems J, Jellinger K, Thal DR, et al. Review: Sporadic cerebral amyloid angiopathy. Neuropathol Appl Neurobiol 2011; 37: 75– 93 [DOI] [PubMed] [Google Scholar]
- 12. Miao J, Vitek MP, Xu F, et al. Reducing cerebral microvascular amyloid-beta protein deposition diminishes regional neuroinflammation in vasculotropic mutant amyloid precursor protein transgenic mice. J Neurosci 2005; 25: 6271– 77 [DOI] [PMC free article] [PubMed] [Google Scholar]
- 13. Miao J, Xu F, Davis J, et al. Cerebral microvascular amyloid beta protein deposition induces vascular degeneration and neuroinflammation in transgenic mice expressing human vasculotropic mutant amyloid beta precursor protein. Am J Pathol 2005; 167: 505– 15 [DOI] [PMC free article] [PubMed] [Google Scholar]
- 14. Oddo S, Caccamo A, Shepherd JD, et al. Triple-transgenic model of Alzheimer’s disease with plaques and tangles: Intracellular Abeta and synaptic dysfunction. Neuron 2003; 39: 409– 21 [DOI] [PubMed] [Google Scholar]
- 15. Mestas J, Hughes CC. Of mice and not men: Differences between mouse and human immunology. J Immunol 2004; 172: 2731– 38 [DOI] [PubMed] [Google Scholar]
- 16. Guo B, Chang EY, Cheng G. The type I IFN induction pathway constrains Th17-mediated autoimmune inflammation in mice. J Clin Invest 2008; 118: 1680– 90 [DOI] [PMC free article] [PubMed] [Google Scholar]
- 17. Weinberg JB, Misukonis MA, Shami PJ, et al. Human mononuclear phagocyte inducible nitric oxide synthase (iNOS): Analysis of iNOS mRNA, iNOS protein, biopterin, and nitric oxide production by blood monocytes and peritoneal macrophages. Blood 1995; 86: 1184– 95 [PubMed] [Google Scholar]
- 18. Zhang B, Gaiteri C, Bodea LG, et al. Integrated systems approach identifies genetic nodes and networks in late-onset Alzheimer’s disease. Cell 2013; 153: 707– 20 [DOI] [PMC free article] [PubMed] [Google Scholar]
- 19. Kamboh MI, Demirci FY, Wang X, et al. Genome-wide association study of Alzheimer’s disease. Transl Psychiatry 2012; 2: e117. [DOI] [PMC free article] [PubMed] [Google Scholar]
- 20. Seok J, Warren HS, Cuenca AG, et al. Genomic responses in mouse models poorly mimic human inflammatory diseases. Proc Natl Acad Sci U S A 2013; 110: 3507– 12 [DOI] [PMC free article] [PubMed] [Google Scholar]
- 21. Vitek MP, Brown C, Xu Q, et al. Characterization of NO and cytokine production in immune-activated microglia and peritoneal macrophages derived from a mouse model expressing the human NOS2 gene on a mouse NOS2 knockout background. Antioxid Redox Signal 2006; 8: 893– 901 [DOI] [PubMed] [Google Scholar]
- 22. Laubach VE, Foley PL, Shockey KS, et al. Protective roles of nitric oxide and testosterone in endotoxemia: Evidence from NOS-2–deficient mice. Am J Physiol 1998; 275: H2211– 18 [DOI] [PubMed] [Google Scholar]
- 23. Carter-Dawson LD, LaVail MM. Rods and cones in the mouse retina. II. Autoradiographic analysis of cell generation using tritiated thymidine. J Comp Neurol 1979; 188: 263– 72 [DOI] [PubMed] [Google Scholar]
- 24. Mattapallil MJ, Wawrousek EF, Chan CC, et al. The Rd8 mutation of the Crb1 gene is present in vendor lines of C57Bl/6J mice and embryonic stem cells, and confounds ocular induced mutant phenotypes. Invest Ophthalmol Vis Sci 2012; 53: 2921– 27 [DOI] [PMC free article] [PubMed] [Google Scholar]
- 25. Vitek MP, Snell J, Dawson H, et al. Modulation of nitric oxide production in human macrophages by apolipoprotein-E and amyloid-beta peptide. Biochem Biophys Res Commun 1997; 240: 391– 94 [DOI] [PubMed] [Google Scholar]
- 26. Guo Z, Shao L, Zheng L, et al. miRNA-939 regulates human inducible nitric oxide synthase posttranscriptional gene expression in human hepatocytes. Proc Natl Acad Sci U S A 2012; 109: 5826– 31 [DOI] [PMC free article] [PubMed] [Google Scholar]
- 27. Hoos MD, Richardson BM, Foster MW, et al. Longitudinal study of differential protein expression in an Alzheimer’s mouse model lacking inducible nitric oxide synthase. J Proteome Res 2013; 12: 4462– 77 [DOI] [PMC free article] [PubMed] [Google Scholar]
- 28. West MJ, Slomianka L, Gundersen HJ. Unbiased stereological estimation of the total number of neurons in the subdivisions of the rat hippocampus using the optical fractionator. Anat Rec 1991; 231: 482– 97 [DOI] [PubMed] [Google Scholar]
- 29. Alamed J, Wilcock DM, Diamond DM, et al. Two-day radial-arm water maze learning and memory task; robust resolution of amyloid-related memory deficits in transgenic mice. Nat Protoc 2006; 1: 1671– 79 [DOI] [PubMed] [Google Scholar]
- 30. Comery TA, Martone RL, Aschmies S, et al. Acute gamma-secretase inhibition improves contextual fear conditioning in the Tg2576 mouse model of Alzheimer’s disease. J Neurosci 2005; 25: 8898– 902 [DOI] [PMC free article] [PubMed] [Google Scholar]
- 31. Attems J, Yamaguchi H, Saido TC, et al. Capillary CAA and perivascular Abeta-deposition: Two distinct features of Alzheimer’s disease pathology. J Neurol Sci 2010; 299: 155– 62 [DOI] [PubMed] [Google Scholar]
- 32. Biernat J, Mandelkow EM, Schroter C, et al. The switch of tau protein to an Alzheimer-like state includes the phosphorylation of two serine-proline motifs upstream of the microtubule binding region. EMBO J 1992; 11: 1593– 97 [DOI] [PMC free article] [PubMed] [Google Scholar]
- 33. Iqbal K, Grundke-Iqbal I. Alzheimer neurofibrillary degeneration: Significance, etiopathogenesis, therapeutics and prevention. J Cell Mol Med 2008; 12: 38– 55 [DOI] [PMC free article] [PubMed] [Google Scholar]
- 34. Lee JH, Goedert M, Hill WD, et al. Tau proteins are abnormally expressed in olfactory epithelium of Alzheimer patients and developmentally regulated in human fetal spinal cord. Exp Neurol 1993; 121: 93– 105 [DOI] [PubMed] [Google Scholar]
- 35. Steinhilb ML, Dias-Santagata D, Fulga TA, et al. Tau phosphorylation sites work in concert to promote neurotoxicity in vivo. Mol Biol Cell 2007; 18: 5060– 68 [DOI] [PMC free article] [PubMed] [Google Scholar]
- 36. Wang JZ, Grundke-Iqbal I, Iqbal K. Kinases and phosphatases and tau sites involved in Alzheimer neurofibrillary degeneration. Eur J Neurosci 2007; 25: 59– 68 [DOI] [PMC free article] [PubMed] [Google Scholar]
- 37. Seino Y, Kawarabayashi T, Wakasaya Y, et al. Amyloid beta accelerates phosphorylation of tau and neurofibrillary tangle formation in an amyloid precursor protein and tau double-transgenic mouse model. J Neurosci Res 2010; 88: 3547– 54 [DOI] [PubMed] [Google Scholar]
- 38. Sturchler-Pierrat C, Abramowski D, Duke M, et al. Two amyloid precursor protein transgenic mouse models with Alzheimer disease–like pathology. Proc Natl Acad Sci U S A 1997; 94: 13287– 92 [DOI] [PMC free article] [PubMed] [Google Scholar]
- 39. Tomidokoro Y, Ishiguro K, Harigaya Y, et al. Abeta amyloidosis induces the initial stage of tau accumulation in APP(Sw) mice. Neurosci Lett 2001; 299: 169– 72 [DOI] [PubMed] [Google Scholar]
- 40. Merino-Serrais P, Benavides-Piccione R, Blazquez-Llorca L, et al. The influence of phospho-tau on dendritic spines of cortical pyramidal neurons in patients with Alzheimer’s disease. Brain 2013; 136: 1913– 28 [DOI] [PMC free article] [PubMed] [Google Scholar]
- 41. Schneider A, Araujo GW, Trajkovic K, et al. Hyperphosphorylation and aggregation of tau in experimental autoimmune encephalomyelitis. J Biol Chem 2004; 279: 55833– 39 [DOI] [PubMed] [Google Scholar]
- 42. Planel E, Yasutake K, Fujita SC, et al. Inhibition of protein phosphatase 2A overrides tau protein kinase I/glycogen synthase kinase 3 beta and cyclin-dependent kinase 5 inhibition and results in tau hyperphosphorylation in the hippocampus of starved mouse. J Biol Chem 2001; 276: 34298– 306 [DOI] [PubMed] [Google Scholar]
- 43. Kampers T, Pangalos M, Geerts H, et al. Assembly of paired helical filaments from mouse tau: Implications for the neurofibrillary pathology in transgenic mouse models for Alzheimer’s disease. FEBS Lett 1999; 451: 39– 44 [DOI] [PubMed] [Google Scholar]
- 44. Graff-Radford J, Kantarci K. Magnetic resonance spectroscopy in Alzheimer’s disease. Neuropsychiatr Dis Treat 2013; 9: 687– 96 [DOI] [PMC free article] [PubMed] [Google Scholar]
- 45. Kantarci K. Magnetic resonance spectroscopy in common dementias. Neuroimaging Clin N Am 2013; 23: 393– 406 [DOI] [PMC free article] [PubMed] [Google Scholar]
- 46. Kantarci K. Proton MRS in mild cognitive impairment. J Magn Reson Imaging 2013; 37: 770– 77 [DOI] [PMC free article] [PubMed] [Google Scholar]
- 47. Kantarci K, Weigand SD, Przybelski SA, et al. MRI and MRS predictors of mild cognitive impairment in a population-based sample. Neurology 2013; 81: 126– 33 [DOI] [PMC free article] [PubMed] [Google Scholar]
- 48. Valenzuela MJ, Sachdev P. Magnetic resonance spectroscopy in AD. Neurology 2001; 56: 592– 98 [DOI] [PubMed] [Google Scholar]
- 49. Kantarci K, Petersen RC, Przybelski SA, et al. Hippocampal volumes, proton magnetic resonance spectroscopy metabolites, and cerebrovascular disease in mild cognitive impairment subtypes. Arch Neurol 2008; 65: 1621– 28 [DOI] [PMC free article] [PubMed] [Google Scholar]
- 50. Shinno H, Inagaki T, Miyaoka T, et al. A decrease in N-acetylaspartate and an increase in myoinositol in the anterior cingulate gyrus are associated with behavioral and psychological symptoms in Alzheimer’s disease. J Neurol Sci 2007; 260: 132– 38 [DOI] [PubMed] [Google Scholar]
- 51. Tumati S, Martens S, Aleman A. Magnetic resonance spectroscopy in mild cognitive impairment: Systematic review and meta-analysis. Neurosci Biobehav Rev 2013; 37: 2571– 86 [DOI] [PubMed] [Google Scholar]
- 52. Wolf HK, Buslei R, Schmidt-Kastner R, et al. NeuN: A useful neuronal marker for diagnostic histopathology. J Histochem Cytochem 1996; 44: 1167– 71 [DOI] [PubMed] [Google Scholar]
- 53. Fanselow MS, Dong HW. Are the dorsal and ventral hippocampus functionally distinct structures? Neuron 2010; 65: 7– 19 [DOI] [PMC free article] [PubMed] [Google Scholar]
- 54. Gallagher M, Koh MT. Episodic memory on the path to Alzheimer’s disease. Curr Opin Neurobiol 2011; 21: 929– 34 [DOI] [PMC free article] [PubMed] [Google Scholar]
- 55. Weintraub S, Wicklund AH, Salmon DP. The neuropsychological profile of Alzheimer disease. Cold Spring Harb Perspect Med 2012; 2: a006171. [DOI] [PMC free article] [PubMed] [Google Scholar]
- 56. Palmer A, Good M. Hippocampal synaptic activity, pattern separation and episodic-like memory: Implications for mouse models of Alzheimer’s disease pathology. Biochem Soc Trans 2011; 39: 902– 9 [DOI] [PubMed] [Google Scholar]
- 57. Stewart S, Cacucci F, Lever C. Which memory task for my mouse? A systematic review of spatial memory performance in the Tg2576 Alzheimer’s mouse model. J Alzheimers Dis 2011; 26: 105– 26 [DOI] [PubMed] [Google Scholar]
- 58. Shukitt-Hale B, McEwen JJ, Szprengiel A, et al. Effect of age on the radial arm water maze—a test of spatial learning and memory. Neurobiol Aging 2004; 25: 223– 29 [DOI] [PubMed] [Google Scholar]
- 59. Hunsaker MR. The importance of considering all attributes of memory in behavioral endophenotyping of mouse models of genetic disease. Behav Neurosci 2012; 126: 371– 80 [DOI] [PMC free article] [PubMed] [Google Scholar]
- 60. Hsiao K, Chapman P, Nilsen S, et al. Correlative memory deficits, Abeta elevation, and amyloid plaques in transgenic mice. Science 1996; 274: 99– 102 [DOI] [PubMed] [Google Scholar]
- 61. Casas C, Sergeant N, Itier JM, et al. Massive CA1/2 neuronal loss with intraneuronal and N-terminal truncated Abeta42 accumulation in a novel Alzheimer transgenic model. Am J Pathol 2004; 165: 1289– 300 [DOI] [PMC free article] [PubMed] [Google Scholar]
- 62. Oakley H, Cole SL, Logan S, et al. Intraneuronal beta-amyloid aggregates, neurodegeneration, and neuron loss in transgenic mice with five familial Alzheimer’s disease mutations: Potential factors in amyloid plaque formation. J Neurosci 2006; 26: 10129– 40 [DOI] [PMC free article] [PubMed] [Google Scholar]
- 63. Robbins EM, Betensky RA, Domnitz SB, et al. Kinetics of cerebral amyloid angiopathy progression in a transgenic mouse model of Alzheimer disease. J Neurosci 2006; 26: 365– 71 [DOI] [PMC free article] [PubMed] [Google Scholar]
- 64. Zhang-Nunes SX, Maat-Schieman ML, van Duinen SG, et al. The cerebral beta-amyloid angiopathies: Hereditary and sporadic. Brain Pathol 2006; 16: 30– 39 [DOI] [PMC free article] [PubMed] [Google Scholar]
- 65. Richard E, Carrano A, Hoozemans JJ, et al. Characteristics of dyshoric capillary cerebral amyloid angiopathy. J Neuropathol Exp Neurol 2010; 69: 1158– 67 [DOI] [PubMed] [Google Scholar]
- 66. Attems J, Jellinger KA. Only cerebral capillary amyloid angiopathy correlates with Alzheimer pathology—a pilot study. Acta Neuropathol 2004; 107: 83– 90 [DOI] [PubMed] [Google Scholar]
- 67. Weller RO, Djuanda E, Yow HY, et al. Lymphatic drainage of the brain and the pathophysiology of neurological disease. Acta Neuropathol 2009; 117: 1– 14 [DOI] [PubMed] [Google Scholar]
- 68. Wilcock DM, Vitek MP, Colton CA. Vascular amyloid alters astrocytic water and potassium channels in mouse models and humans with Alzheimer’s disease. Neuroscience 2009; 159: 1055– 69 [DOI] [PMC free article] [PubMed] [Google Scholar]
- 69. Reilly JF, Games D, Rydel RE, et al. Amyloid deposition in the hippocampus and entorhinal cortex: Quantitative analysis of a transgenic mouse model. Proc Natl Acad Sci U S A 2003; 100: 4837– 42 [DOI] [PMC free article] [PubMed] [Google Scholar]
- 70. Irizarry MC, Soriano F, McNamara M, et al. Abeta deposition is associated with neuropil changes, but not with overt neuronal loss in the human amyloid precursor protein V717F (PDAPP) transgenic mouse. J Neurosci 1997; 17: 7053– 59 [DOI] [PMC free article] [PubMed] [Google Scholar]
- 71. Schmitz C, Rutten BP, Pielen A, et al. Hippocampal neuron loss exceeds amyloid plaque load in a transgenic mouse model of Alzheimer’s disease. Am J Pathol 2004; 164: 1495– 502 [DOI] [PMC free article] [PubMed] [Google Scholar]
- 72. Oshima K, Uchikado H, Dickson DW. Perivascular neuritic dystrophy associated with cerebral amyloid angiopathy in Alzheimer’s disease. Int J Clin Exp Pathol 2008; 1: 403– 8 [PMC free article] [PubMed] [Google Scholar]
- 73. Van Nostrand WE, Xu F, Rozemuller AJ, et al. Enhanced capillary amyloid angiopathy–associated pathology in Tg-SwDI mice with deleted nitric oxide synthase 2. Stroke 2010; 41: S135– 38 [DOI] [PMC free article] [PubMed] [Google Scholar]
- 74. Clavaguera F, Bolmont T, Crowther RA, et al. Transmission and spreading of tauopathy in transgenic mouse brain. Nat Cell Biol 2009; 11: 909– 13 [DOI] [PMC free article] [PubMed] [Google Scholar]
- 75. Clavaguera F, Grueninger F, Tolnay M. Intercellular transfer of tau aggregates and spreading of tau pathology: Implications for therapeutic strategies. Neuropharmacology 2014; 76: 9– 15 [DOI] [PubMed] [Google Scholar]
- 76. Iba M, Guo JL, McBride JD, et al. Synthetic tau fibrils mediate transmission of neurofibrillary tangles in a transgenic mouse model of Alzheimer’s-like tauopathy. J Neurosci 2013; 33: 1024– 37 [DOI] [PMC free article] [PubMed] [Google Scholar]
- 77. Wu JW, Herman M, Liu L, et al. Small misfolded Tau species are internalized via bulk endocytosis and anterogradely and retrogradely transported in neurons. J Biol Chem 2013; 288: 1856– 70 [DOI] [PMC free article] [PubMed] [Google Scholar]
- 78. Schonheit B, Zarski R, Ohm TG. Spatial and temporal relationships between plaques and tangles in Alzheimer-pathology. Neurobiol Aging 2004; 25: 697– 711 [DOI] [PubMed] [Google Scholar]
- 79. Yilmazer-Hanke DM, Hanke J. Progression of Alzheimer-related neuritic plaque pathology in the entorhinal region, perirhinal cortex and hippocampal formation. Dement Geriatr Cogn Disord 1999; 10: 70– 76 [DOI] [PubMed] [Google Scholar]
- 80. Adachi M, Kawakatsu S, Hosoya T, et al. Morphology of the inner structure of the hippocampal formation in Alzheimer disease. AJNR Am J Neuroradiol 2003; 24: 1575– 81 [PMC free article] [PubMed] [Google Scholar]
- 81. Avila J. Tau phosphorylation and aggregation in Alzheimer’s disease pathology. FEBS Lett 2006; 580: 2922– 27 [DOI] [PubMed] [Google Scholar]
- 82. Gertz HJ, Xuereb J, Huppert F, et al. Examination of the validity of the hierarchical model of neuropathological staging in normal aging and Alzheimer’s disease. Acta Neuropathol 1998; 95: 154– 58 [DOI] [PubMed] [Google Scholar]
- 83. Giannakopoulos P, von Gunten A, Kovari E, et al. Stereological analysis of neuropil threads in the hippocampal formation: Relationships with Alzheimer’s disease neuronal pathology and cognition. Neuropathol Appl Neurobiol 2007; 33: 334– 43 [DOI] [PubMed] [Google Scholar]
- 84. Braak H, Thal DR, Ghebremedhin E, et al. Stages of the pathologic process in Alzheimer disease: Age categories from 1 to 100 years. J Neuropathol Exp Neurol 2011; 70: 960– 69 [DOI] [PubMed] [Google Scholar]
- 85. Lace G, Savva GM, Forster G, et al. Hippocampal tau pathology is related to neuroanatomical connections: An ageing population–based study. Brain 2009; 132: 1324– 34 [DOI] [PubMed] [Google Scholar]
- 86. Karran E, Mercken M, De Strooper B. The amyloid cascade hypothesis for Alzheimer’s disease: An appraisal for the development of therapeutics. Nat Rev Drug Discov 2011; 10: 698– 712 [DOI] [PubMed] [Google Scholar]
- 87. Ashe KH, Zahs KR. Probing the biology of Alzheimer’s disease in mice. Neuron 2010; 66: 631– 45 [DOI] [PMC free article] [PubMed] [Google Scholar]
- 88. Schwab C, Hosokawa M, McGeer PL. Transgenic mice overexpressing amyloid beta protein are an incomplete model of Alzheimer disease. Exp Neurol 2004; 188: 52– 64 [DOI] [PubMed] [Google Scholar]
- 89. LaFerla FM, Green KN. Animal models of Alzheimer disease. Cold Spring Harb Perspect Med 2012; 2: 1– 13 [DOI] [PMC free article] [PubMed] [Google Scholar]
- 90. Braak H, Braak E. Neuropathological staging of Alzheimer-related changes. Acta Neuropathol 1991; 82: 239– 59 [DOI] [PubMed] [Google Scholar]
- 91. Blazquez-Llorca L, Garcia-Marin V, Merino-Serrais P, et al. Abnormal tau phosphorylation in the thorny excrescences of CA3 hippocampal neurons in patients with Alzheimer’s disease. J Alzheimers Dis 2011; 26: 683– 98 [DOI] [PubMed] [Google Scholar]
- 92. Adams SJ, Crook RJ, Deture M, et al. Overexpression of wild-type murine tau results in progressive tauopathy and neurodegeneration. Am J Pathol 2009; 175: 1598– 609 [DOI] [PMC free article] [PubMed] [Google Scholar]
- 93. West MJ, Kawas CH, Stewart WF, et al. Hippocampal neurons in pre-clinical Alzheimer’s disease. Neurobiol Aging 2004; 25: 1205– 12 [DOI] [PubMed] [Google Scholar]
- 94. Fernandez-Fernandez S, Almeida A, Bolanos JP. Antioxidant and bioenergetic coupling between neurons and astrocytes. Biochem J 2012; 443: 3– 11 [DOI] [PubMed] [Google Scholar]
- 95. Pocernich CB, Butterfield DA. Elevation of glutathione as a therapeutic strategy in Alzheimer disease. Biochim Biophys Acta 2012; 1822: 625– 30 [DOI] [PMC free article] [PubMed] [Google Scholar]
- 96. Oberg J, Spenger C, Wang FH, et al. Age related changes in brain metabolites observed by H MRS in APP/PS1 mice. Neurobiol Aging 2008; 29: 1423– 33 [DOI] [PubMed] [Google Scholar]
- 97. Cheng LL, Newell K, Mallory AE, et al. Quantification of neurons in Alzheimer and control brains with ex vivo high resolution magic angle spinning proton magnetic resonance spectroscopy and stereology. Magn Reson Imaging 2002; 20: 527– 33 [DOI] [PubMed] [Google Scholar]
- 98. Haberman RP, Colantuoni C, Stocker AM, et al. Prominent hippocampal CA3 gene expression profile in neurocognitive aging. Neurobiol Aging 2011; 32: 1678– 92 [DOI] [PMC free article] [PubMed] [Google Scholar]
- 99. Hanseeuw BJ, Van Leemput K, Kavec M, et al. Mild cognitive impairment: Differential atrophy in the hippocampal subfields. AJNR Am J Neuroradiol 2011; 32: 1658– 61 [DOI] [PMC free article] [PubMed] [Google Scholar]
- 100. Kobayashi DT, Chen KS. Behavioral phenotypes of amyloid-based genetically modified mouse models of Alzheimer’s disease. Genes Brain Behav 2005; 4: 173– 96 [DOI] [PubMed] [Google Scholar]
- 101. Liem RK, Messing A. Dysfunctions of neuronal and glial intermediate filaments in disease. J Clin Invest 2009; 119: 1814– 24 [DOI] [PMC free article] [PubMed] [Google Scholar]
- 102. Ohama Y, Hayashi K. Relocalization of a microtubule-anchoring protein, ninein, from the centrosome to dendrites during differentiation of mouse neurons. Histochem Cell Biol 2009; 132: 515– 24 [DOI] [PubMed] [Google Scholar]
- 103. Schoch S, Gundelfinger ED. Molecular organization of the presynaptic active zone. Cell Tissue Res 2006; 326: 379– 91 [DOI] [PubMed] [Google Scholar]
- 104. Nithianantharajah J, Komiyama NH, McKechanie A, et al. Synaptic scaffold evolution generated components of vertebrate cognitive complexity. Nat Neurosci 2013; 16: 16– 24 [DOI] [PMC free article] [PubMed] [Google Scholar]
- 105. Bast T. Toward an integrative perspective on hippocampal function: From the rapid encoding of experience to adaptive behavior. Rev Neurosci 2007; 18: 253– 81 [DOI] [PubMed] [Google Scholar]
- 106. Thompson CL, Pathak SD, Jeromin A, et al. Genomic anatomy of the hippocampus. Neuron 2008; 60: 1010– 21 [DOI] [PubMed] [Google Scholar]
- 107. Wink DA, Hines HB, Cheng RY, et al. Nitric oxide and redox mechanisms in the immune response. J Leukoc Biol 2011; 89: 873– 91 [DOI] [PMC free article] [PubMed] [Google Scholar]
- 108. Reyes JF, Fu Y, Vana L, et al. Tyrosine nitration within the proline-rich region of Tau in Alzheimer’s disease. Am J Pathol 2011; 178: 2275– 85 [DOI] [PMC free article] [PubMed] [Google Scholar]
- 109. Vana L, Kanaan NM, Hakala K, et al. Peroxynitrite-induced nitrative and oxidative modifications alter tau filament formation. Biochemistry 2011; 50: 1203– 12 [DOI] [PMC free article] [PubMed] [Google Scholar]
- 110. Wahlund LO, Julin P, Johansson SE, et al. Visual rating and volumetry of the medial temporal lobe on magnetic resonance imaging in dementia: A comparative study. J Neurol Neurosurg Psychiatry 2000; 69: 630– 35 [DOI] [PMC free article] [PubMed] [Google Scholar]
- 111. Bresciani L, Rossi R, Testa C, et al. Visual assessment of medial temporal atrophy on MR films in Alzheimer’s disease: Comparison with volumetry. Aging Clin Exp Res 2005; 17: 8– 13 [DOI] [PubMed] [Google Scholar]
- 112. Apostolova LG, Mosconi L, Thompson PM, et al. Subregional hippocampal atrophy predicts Alzheimer’s dementia in the cognitively normal. Neurobiol Aging 2010; 31: 1077– 88 [DOI] [PMC free article] [PubMed] [Google Scholar]