

Summary
The cell cycle of Caulobacter crescentus is controlled by a complex signaling network that coordinates events. Genome sequencing has revealed many C. crescentus cell cycle genes are conserved in other Alphaproteobacteria, but it is not clear to what extent their function is conserved. As many cell cycle regulatory genes are essential in C. crescentus, the essential genes of two Alphaproteobacteria, Agrobacterium tumefaciens (Rhizobiales) and Brevundimonas subvibrioides (Caulobacterales), were elucidated to identify changes in cell cycle protein function over different phylogenetic distances as demonstrated by changes in essentiality. The results show the majority of conserved essential genes are involved in critical cell cycle processes. Changes in component essentiality reflect major changes in lifestyle, such as divisome components in A. tumefaciens resulting from that organism’s different growth pattern. Larger variability of essentiality was observed in cell cycle regulators, suggesting regulatory mechanisms are more customizable than the processes they regulate. Examples include variability in the essentiality of divJ and divK spatial cell cycle regulators, and non-essentiality of the highly conserved and usually essential DNA methyltransferase CcrM. These results show that while essential cell functions are conserved across varying genetic distance, much of a given organism’s essential gene pool is specific to that organism.
Keywords: Alphaproteobacteria, Caulobacter, TnSeq, essential genes
Introduction
The Alphaproteobacterial subdivision contains numerous medically, technologically and ecologically important microorganisms, displaying extraordinary metabolic flexibility and inhabiting a diverse array of environmental niches. Though the environments and lifestyles among members of the Alphaproteobacteria can be drastically different, genomic information suggests these organisms rely on the same physiological processes, such as peptidoglycan synthesis and cell division, to progress through the cell cycle, as would be expected. However, bioinformatics analysis has also shown that the regulatory systems controlling the developmental cell cycle of Caulobacter crescentus cell cycle are conserved, in whole or part, in many Alphaproteobacteria as well (Brilli et al., 2010). C. crescentus, a common freshwater oligotrophe, is a major model organism for intracellular signaling and asymmetric division in bacteria (for review, see (Curtis & Brun, 2010)). C. crescentus produces two daughter cells after each round of division that are distinct in morphology and replication competence. The stalked cell has a tubular extension of the cell wall emanating from one pole (stalk), which is tipped with an adhesive polysaccharide (holdfast), and can immediately re-enter the replication cycle after cell division. The swarmer cell has a single flagellum and several pili occupying a single pole, and must differentiate into a stalked cell before entering the replication cycle. Progression through the cell cycle is regulated by temporally and spatially controlled signaling systems, the combination of which allows C. crescentus to produce asymmetric progeny after cell division. Based on genomic evidence, one would expect the mechanisms of cell cycle processes as well as their regulation to be similar in most Alphaproteobacteria. However, there is little experimental evidence to support or refute the hypotheses generated from bioinformatic analyses, and the experiments that have been performed have shown that in some cases the conservation of genes does not necessarily equate to conservation of properties.
Cross-complementation experiments have shown that many cell cycle signaling proteins are true functional homologs (Barnett et al., 2001, Brassinga et al., 2002). Many signaling proteins mutants in A. tumefaciens produce phenotypes in motility, adhesion and cell division that mirror phenotypes produced by analogous mutants in C. crescentus, (Kim et al., 2013, Kahng & Shapiro, 2001). Conversely, while CtrA is a global transcriptional regulator intimately tied to both temporal and spatial processes in C. crescentus, the CtrA homolog in Rhodobacter capsulatus appears uninvolved in developmental signaling but instead regulates production of the Gene Transfer Agent, a horizontal gene transfer system (Lang & Beatty, 2000). The CtrA homolog in Rhodospirillum centenum regulates cyst formation (Bird & MacKrell, 2011), and the homolog in Magnetospirillum magneticum regulates motility (Greene et al., 2012).
Proteins involved in the cell cycle are often essential for growth, including the regulatory signaling systems of C. crescentus (Zweiger & Shapiro, 1994, Christen et al., 2011, Quon et al., 1996, Holtzendorff et al., 2004, Jacobs et al., 1999, Reisinger et al., 2007, Biondi et al., 2006a, Wu et al., 1999, Hecht et al., 1995). A change in gene essentiality between organisms is indicative of a change in protein functional operation, either through a change in the biochemical properties of the protein itself, a change in the regulatory targets or signal transduction properties, or a change in the cellular context that impacts function. For example, CtrA was found to be essential in S. meliloti and Brucella abortus suggesting it functions in cell cycle regulation (Barnett et al., 2001, Bellefontaine et al., 2002, Hallez et al., 2007), but in R. capsulatus, R. centenum and M. magneticum, where CtrA is not involved in the cell cycle, it is no longer essential. Determining the essential genes of multiple organisms provides a high-throughput physiological characterization that may uncover to what extent processes are conserved between organisms or have been adapted to suit a given organism’s lifestyle.
To investigate essential genes in Alphaproteobacteria, saturating transposon mutagenesis followed by high-throughput sequencing (hereafter referred to as TnSeq) was used to determine the essential genes of two Alphaproteobacteria: Brevundimonas subvibrioides (Caulobacterales) and Agrobacterium tumefaciens (Rhizobiales). B. subvibrioides, a freshwater oligotroph that inhabits the same environmental niches as C. crescentus, provides a comparison over a small evolutionary distance as the Brevundimonas clade is the next closest genus to Caulobacter, while A. tumefaciens, a common soil organism and plant pathogen, provides a comparison over a larger evolutionary distance (Figure 1). The data were used preferentially to analyze multiple processes of the cell cycle, and revealed several important discrepancies. The results suggest that even though cell cycle components are conserved between organisms, their utilization can change over short evolutionary distances.
Figure 1.

Phylogenetic tree of select Alphaproteobacteria. Brackets indicate orders within the Alphaproteobacteria. Organisms of interest to this study are indicated with arrows. To generate the phylogenetic tree, gyrA sequences from representative species were aligned using MUSCLE (Edgar, 2004). RAxML reconstructed the maximum likelihood phylogeny using the JTT amino acid substitution matrix and a four-category discrete gamma distribution of sequence rate variation among sites (Stamatakis, 2006).
Results
Identification of essential genes
TnSeq was used to identify essential genes in A. tumefaciens and B. subvibrioides. A summary of the results is presented in Table 1. EZ-Tn5 transposome (Epicentre) was used to mutagenize targeted organisms via electroporation. Colonies from five agar plates from each transformation batch (see Experimental Procedures) were counted and used to estimate the total number of transformants for that batch. Approximately 930,000 A. tumefaciens mutants were pooled and 911,053 unique insertions were detected, leading to an average transposon coverage of 168 transposons per ORF. Approximately 1,300,000 B. subvibrioides mutants were pooled and 1,166,016 unique insertion sites were detected, leading to an average transposon coverage of 344 transposons per ORF. Analyses were performed to characterize the randomness of insertion, and it was found that local GC content and ORF direction had little impact on transposon insertion, indicating mutagenesis was random (Figure S-1). Little evidence of transposon polarity was observed as operons were often found to have mixtures of essential and non-essential genes. If transposon insertion were polar, then all non-essential genes in an operon upstream of an essential gene would appear essential. Instead, many cases were observed were an essential gene was in the middle of an operon of non-essential genes, suggesting insertional polarity was not an issue.
Table 1.
Summary of TnSeq results
| Organism | Estimated number of transformants | Total Sequencing Reads | Transposon- containing reads | % Reads with Transposon | Unique Insertion Sites | Average Transposons per ORF |
|---|---|---|---|---|---|---|
| B. subvibrioides | ~1,300,000 | 23,558,035 | 14,157,058 | 60.0 | 1,166,016 | 344 |
| A. tumefaciens | ~930,000 | 2,656,642 | 1,771,762 | 66.7 | 911,053 | 168 |
Transposon density was used as a measure of essentiality similar to the analysis performed for Salmonella typhi (Langridge et al., 2009); essential genes should have much fewer sequenced insertions (normalized to gene length) than non-essential genes. To counteract factors that artificially elevate the transposon density of essential genes, such as insertions in the 5’ end of ORFs with improperly-annotated start sites or insertions in the 3’ of ORFs that do not eliminate protein function, varying portions of the coding sequence from both the 5’ end and 3’ end of each ORF were eliminated from the analysis in calculating transposon density. It was found that excluding 20% from each end of the genes provided the best distinction between essential and non-essential genes. Thus the transposon density for the internal 60% of each ORF was calculated and plotted on a histogram (Figure 2).
Figure 2.

Distribution of internal transposon densities. The transposon density of the internal 60% of each ORF was plotted on a histogram. The distribution shows that each organism has a population of densities close to the Y-axis (essential genes) and a larger population with higher density (non-essential genes). Genes are present in the trough area between the peaks that likely contains essential genes as well as genes that have a significant growth defect when disrupted. Numbers in parenthesis represent the height of bars exceeding the Y-axis (97 for above 0.4 of A. tumefaciens and 295 for the 0-0.0025 range of B. subvibrioides). To the right of each distribution is a portion of the Ward’s cluster analysis performed using the internal transposon densities. The portions displayed cover the essential gene peak, trough, and early non-essential gene peak. Dashed lines indicate where major cluster divisions correspond to portions of the distribution. Genes from the Y-axis to line 1 were classified as essential, from line 1 to line 2 as unresolved, and from line 2 onward as non-essential.
Similar to the study with S. typhi, the histogram displayed a bi-modal distribution: one peak with lower transposon densities that contains the essential genes, and a second larger peak with higher transposon densities that contains non-essential genes. Compared to the S. typhi study, the area between the essential and non-essential peaks was more extensive and contained a large number of unresolved genes. This area likely contains many essential genes as components from a number of essential cell processes can be found, such as transcription, translation, post-translational modification, lipid metabolism and inorganic ion transport. However, some non-essential genes appear in this group as well, such as amino acid biosynthesis and motility mechanisms. In order to draw tentative boundaries for the peak areas, internal transposon densities were subjected to Ward’s clustering analysis. The portion of the clustering analyses covering the essential gene densities, early non-essential densities, and the intermediate densities are shown in Figure 2. Dashed lines indicate where cluster branches correlate to positions on the histogram. Genes between the 0 density and line 1 were categorized as essential, between line 1 and line 2 as unresolved, and line 2 onwards as non-essential (see Supplementary Material “Agrobacterium tumefaciens transposons” and “Brevundimonas subvibrioides transposons”, Transposon Density Ordered tabs in each). While there was a clear bi-modal distribution, some essential genes were found to have a non-zero internal transposon density. Insertions in essential genes were likely due to dead cells that were not able to form colonies but were still present on selection plates and were harvested with colonies for library preparation. These low frequency insertions are considered noise and are encountered in most TnSeq studies (Glass et al., 2006, French et al., 2008, Langridge et al., 2009, Christen et al., 2011). Noise insertions are often present as transposon insertions with a single read.
It is possible that the single read noise contributes to the large number of unresolved genes between the peaks, and removing them may help resolution. In A. tumefaciens data 502,407 of 911,053 unique insertions had a single sequencing read and had an average of 1.94 reads per unique insertion site; in B. subvibrioides 168,506 of 1,166,016 had a single sequencing read with an average of 12.14 reads per unique insertion. The fraction of total unique insertions for transposons of a given read number was compared with the expected fraction based on a Zero-Truncated Poisson distribution using the average reads per transposon as the lambda function (Figure S-2). The results show that for both organisms more transposons had only a single read than would be expected by randomness, suggesting that the transposon libraries were not sequenced with sufficient depth to achieve multiple reads per transposon for the majority of the library. Therefore, while these single reads may represent noise in the system, clearly many of them were legitimate transposon insertions and were not excluded from analysis. However, the noise appeared to not have significant impact on essential gene determination. Even with the single read transposons included, clear bi-modal transposon densities were observed, and in all cases where individual gene essentialities were tested by direct mutagenesis, the essentiality predicted by the transposon data was confirmed.
It should be noted that increasing sequencing depth may not aid significantly in resolving the 210 A. tumefaciens and 120 B. subvibrioides unresolved genes. In the determination of C. crescentus essential genes, a gene was considered essential if it had an insertion density of less than one insertion in 50 base pairs and the biggest non-disruptable internal gap covered more than 60% of the total ORF length (Christen et al., 2011). However, if a gene had a transposon density of less than one insertion every 25 bp and harbored a non-disruptable 5’ region covering less than 60% of the total ORF length if was considered “high fitness cost”; essentially these high fitness genes had low transposon densities but not low enough to be considered essential.). That gene characterization roughly corresponds to the unresolved genes of this study, and yielded a similar number of genes. 155 genes were characterized as high fitness cost in that study. Yet the C. crescentus sequencing achieved 209 reads per transposon, much higher apparent depth than this study. Therefore, increased sequencing depth does not necessarily reduce the number of unresolved genes.
Cross-organism essential gene comparison
To compare the essential genes for A. tumefaciens, B. subvibrioides and C. crescentus, pair-wise BLAST searches were performed for every gene in each genome to identify orthologs common to each pairing as well those common to all three organisms. Then each list was sorted based upon essentiality of the orthologs in each organism, as determined here and from Christen et al (Christen et al., 2011). This information is available in the Supplementary file “Cross organism comparison”. In addition, a tab in the file provides the genes conserved in all three organisms sorted by COG function. The first unusual result from this comparison is the relatively low number of conserved essential genes. A. tumefaciens had 372 essential genes, B. subvibrioides had 447 essential genes and C. crescentus had 480 essential genes. This corresponds to 6.9%, 13.4% and 12.4% of genes being essential respectively, which are similar to percentages found in previous studies (Gallagher et al., 2007, Langridge et al., 2009). However, there were only 106 genes that were conserved and essential in all three organisms, i.e. less than a third of the essential genes in one organism were conserved and essential in the other two organisms. This result suggests that most essential genes are essential only to that organism, though the number of unresolved genes for each organism mean this is a conservative estimate. Many of the conserved essential genes encode for expected critical cell components, such as ribosomal proteins, aminoacyl-tRNA synthetases, DNA replication and central metabolism components. 55 of the 106 conserved essential genes are also in the Minimal Gene Set previously published (Gil et al., 2004). Many of the 106 conserved essential that are not found in the minimal genome are those involved in cell wall synthesis and electron transport, two processes considered non-essential for the minimal genome. What is surprisingly lacking from the conserved essential genes are hypothetical genes. C. crescentus has 31 essential hypothetical genes, A. tumefaciens has 38 and B. subvibrioides has only 5, though this low number may be due to, in part, the fact that B. subvibrioides has the most-recently annotated genome. Yet there are no conserved essential genes annotated hypothetical in all three organisms, and only two that are annotated hypothetical in two of the three. These results suggest that essential hypothetical genes are highly specific to the individual organisms.
The number of conserved essential genes between A. tumefaciens and B. subvibrioides (32) or A. tumefaciens and C. crescentus (60) is much lower than those just between B. subvibrioides and C. crescentus (134). This result is unsurprising given not only the genetic distance between the organisms but also that B. subvibrioides and C. crescentus share environmental niches. The latter group appears to contain a number of genes involved in cell division as well as electron transport, suggesting these processes may have significant divergence between the Caulobacterales and the Rhizobiales. There are only 61 genes conserved between B. subvibrioides and C. crescentus that have differing essentialities, though 5 of them are regulatory proteins, suggesting these kinds of genes may have greater variability over shorter genetic distances.
TnSeq reveals variability in the essentiality of cell wall synthesis enzymes
The TnSeq data was used to analyze genes involved in multiple essential cell cycle processes, including cell wall synthesis, cell division, and cell-cycle regulatory signaling systems. In regards to cell wall synthesis, the enzymes responsible for synthesis of peptidoglycan precursors are largely conserved and essential in all three organisms of interest to this study (Table 2). Each organism has a single homolog of peptidoglycan precursor synthesis genes murA-G, mraY and ddl and they were all found to be essential. The one exception is murC in B. subvibrioides where two potential homologs are present in the genome. However, Bresu_2692 was essential while Bresu_1060 was not, suggesting that if the latter participates in peptidoglycan precursor synthesis, it is not sufficient. A. tumefaciens has two Alr (alanine racemase) homologs while the other organisms only have one. Interestingly, none of the Alr homologs were found to be essential, suggesting redundancy. A single homolog of MurI, glutamate racemase, is found in each species, but the essentiality of MurI appears variable. It was categorized essential in C. crescentus (Christen et al., 2011), unresolved in B. subvibrioides, and non-essential in A. tumefaciens. Similar to Alr, MurI was found to be essential in Escherichia coli (Doublet et al., 1992).
Table 2.
Essentiality of peptidoglycan synthesis genesa
| Gene | C. crescentusb | B. subvibrioides | A. tumefaciens | |||
|---|---|---|---|---|---|---|
| Peptidoglycan precursor synthesis | ||||||
| Gene | Gene | Gene | ||||
| MurA | CC_2350 | E | Bresu_2247 | E | Atu0539 | E |
| MurB | CC_2545 | E | Bresu_2691 | E | Atu2092 | E |
| MurC | CC_2546 | E | Bresu_2692 Bresu_1060 |
E N |
Atu2093 | E |
| MurD | CC_2556 | E | Bresu_2778 | E | Atu2096 | E |
| MurE | CC_2559 | E | Bresu_2781 | E | Atu2099 | E |
| MurF | CC_2558 | E | Bresu_2780 | E | Atu2098 | E |
| MurG | CC_2551 | E | Bresu_2776 | E | Atu2096 | E |
| MraY | CCNA_02640c | E | Bresu_2779 | E | Atu2097 | E |
| Ddl | CC_2543 | E | Bresu_2690 | E | Atu2089 | E |
| Alr | CC_1661 | N | Bresu_1809 | N | Atu1080 Atu3292 |
N N |
| MurI | CC_3703 | U | Bresu_0665 | E | Atu1867 | N |
| Cell wall polymerization | ||||||
| PBP1a | CC_1875 CC_0252 CC_1516 CC_3277 |
N U N N |
Bresu_2191 Bresu_0560 |
N N |
Atu1341 Atu0103 |
E N |
| PBP1c | CC_3570 | N | NH | - | Atu3694 | N |
| PBP2 | CC_1546 | E | Bresu_2296 | E | NH | - |
| PBP3 | CC_2560 | E | Bresu_2782 | E | Atu2100 | E |
| MtgA | CC_0325 | N | Bresu_1024 | N | Atu2720 | N |
| Unknown multi-PBP | Atu0931 | N | ||||
| Unknown mono-PBP | Atu1067 | N | ||||
Designations: E = essential, N = non-essential, U = unresolved/high fitness, NH = no homolog.
Essential designations based upon (Christen et al., 2011).
Unannotated in the CB15 genome, annotated in the laboratory domesticated NA1000 derivative.
While most of the precursor synthesis enzymes were conserved and essential, greater variability was found in the peptidoglycan polymerization enzymes. Peptidoglycan biosynthesis is mediated by a number of periplasmic penicillin binding proteins (PBPs, reviewed in (Typas et al., 2012)). PBPs are either multifunctional with both transglycosylase and transpeptidase domains (PBP1) or monofunctional with either transglycosylase (MtgA) or transpeptidase domains (PBP2, PBP3). C. crescentus encodes five multifunctional PBPs and it was experimentally determined that no multifunctional PBP in C. crescentus is essential for growth (Yakhnina & Gitai, 2013, Strobel et al., 2014), suggesting that the homologs can function in different peptidoglycan synthesis processes.
B. subvibrioides only has two multifunctional PBPs (Table 2), Bresu_0560 and Bresu_2191. Similar to C. crescentus, neither enzyme appears essential for growth. A. tumefaciens has four multifunctional PBPs (Table 2), Atu0103, Atu1341, Atu3694, and Atu0931. Unlike the other two organisms of this study, one A. tumefaciens enzyme (Atu1341, PBP1a class) was characterized as essential. The differences in PBP variation and essentiality between A. tumefaciens and the other two organisms may be indicative of the altered growth pattern of this organism (see below).
The monofunctional transglycosylase MtgA localizes to the division site but is non- essential for growth in E. coli (Derouaux et al., 2008, Baba et al., 2006). A single, non-essential homolog is found in C. crescentus, B. subvibrioides and A. tumefaciens (Table 2, this study, (Christen et al., 2011)). Two families of monofunctional transpeptidases have well characterized essential roles in E. coli: PBP2 functions in cell elongation and PBP3 functions in cell division (Typas et al., 2012) and are essential for growth (Curtis et al., 1985, Ogura et al., 1989). Both C. crescentus and B. subvibrioides have a single homolog of each enzyme (Table 2), and both were essential (this study, (Christen et al., 2011)). A. tumefaciens has an essential PBP3 homolog, but no PBP2 homolog is apparent. Atu1067 encodes a monofunctional transpeptidase that may serve the role of PBP2, but it has no bi-directional best hit with any enzyme from E. coli, C. crescentus or B. subvibrioides, nor is it essential. It is also worth noting that A. tumefaciens lacks the cell shape determining protein RodA, as well as the cytoskeletal MreBCD machinery, both common characteristics of the Rhizobiales (Brown et al., 2012). Clearly the peptidoglycan synthesis machinery of A. tumefaciens differs significantly from those of C. crescentus and B. subvibrioides. These differences may be due to the fact that while C. crescentus (and presumably B. subvibrioides) grows by binary fission, A. tumefaciens grows by synthesizing peptidoglycan in a sharp zone at a single cell pole (Kuru et al., 2012, Brown et al., 2012). In binary fission cell elongation is mediated by multiple sites of peptidoglycan synthesis distributed over the cell length, while during cell division peptidoglycan synthesis becomes localized to the midcell. These differences in peptidoglycan biosynthesis may cause different requirements in the machinery, which may be reflected in the change of essentiality or gain/loss of genes. In this case, differential essentiality of the components of this core cell cycle process reflect a significant change in growth pattern, suggesting critical cell processes are not very amenable to changes in component essentiality until the entire process has drastically changed.
The essentiality of divisome placement and composition is variable
One of the first critical steps in cell division is placement of the Z-ring, thereby defining the septum location and the site of assembly for the cell division machinery, hereafter referred to as the divisome. There are three well characterized systems in bacteria for septum placement, the oscillating Z-ring inhibitory Min system (de Boer et al., 1989), the Z-ring inhibitor MipZ that forms a gradient with decreasing concentration from the poles (Thanbichler & Shapiro, 2006), and nucleoid occlusion (often present as a redundant system), where either a Noc- or SlmA-type protein binds non-specifically to chromosomal DNA and inhibits Z-ring formation (for a review, see (Wu & Errington, 2012)).
A. tumefaciens appears to use a Min system for divisome placement. No MipZ, Noc or SlmA homologs are encoded in the chromosome. TnSeq data suggest that the Min system in A. tumefaciens is non-essential (Figure 3A, Table 3). This result agrees with results obtained in E. coli where the deletion of minCD genes does not result in lethality of the strain, but sometimes to production of non-viable minicells (de Boer et al., 1989, Baba et al., 2006). However the results disagree with those found for MinE in E. coli and the Bacillus subtilis functional equivalent DivIVA (de Boer et al., 1989, Edwards & Errington, 1997). Depletion of MinE leads to the formation of filamentous cells incapable of division, and thus is lethal in these species. A. tumefaciens minE has a very high internal transposon density (4551 out of 5460 ORFs), suggesting that insertions into minE have little effect on A. tumefaciens. It is not clear how A. tumefaciens could compensate for the loss of MinE. Similar to the changes in PBP variation/essentiality, it is possible that the loss of MinE essentiality is due to the altered growth pattern of this organism.
Figure 3.

Non-essentiality of septum site selection mechanisms and characterization of B. subvibrioides ΔmipZ. A) Transposon map of the min locus in A. tumefaciens, demonstrating it is likely non-essential. B) Transposon map of the parA, parB and mipZ genes in B. subvibrioides, demonstrating it is likely non-essential. C) Phase contrast image of wild-type and ΔmipZ. White arrows indicate incorrectly placed septum sites in ΔmipZ, either placed asymmetrically or multiple sites in the same cell. D) Histogram of wild-type and ΔmipZ cell sizes demonstrating deletion of mipZ causes increased variability of cell size (both smaller and larger than wild-type). E) Lectin staining of holdfast material of wild-type and ΔmipZ. F) Short-term adhesion assay of ΔmipZ. Equal numbers of cells for wild-type and ΔmipZ were inoculated into 24-well petri dishes and incubated for 2 h (in triplicate). After incubation, each well was washed three times with PYE and stained with crystal violet. After washing away excess crystal violet, bound stain was eluted and measured spectrophotometrically. Values were normalized to wild-type. Each assay was performed three times and average and standard deviation were calculated.
Table 3.
Essentiality of cell division genesa
| Gene | C. crescentus | B. subvibrioides | A. tumefaciens | |||
|---|---|---|---|---|---|---|
| Septum Placementb | ||||||
| Gene | Gene | Gene | ||||
| MinC | NH | - | NH | - | Atu3249 | N |
| MinD | NH | - | NH | - | Atu3248 | N |
| MinE | NH | - | NH | - | Atu3247 | N |
| MipZ | CC_2164 | Nc | Bresu_1578 | N | NH | - |
| ParA | CC_3753 | E | Bresu_0371 | N | Atu2829 | E |
| ParB | CC_3752 | E | Bresu_0372 | N | Atu2828 | E |
| Divisome Componentsd | ||||||
| FtsZ | CC_2540 | E | Bresu_2686 | E | Atu2086 Atu4673 |
E N |
| FtsA | CC_2541 | E | Bresu_2688 | E | Atu2087 | N |
| ZapA | CC_3247 | N | Bresu_1293 | N | NH | - |
| FtsE | CC_2216 | E | Bresu_3301 | N | Atu3606 | U |
| FtsX | CC_2217 | E | Bresu_3302 | N | Atu3607 | E |
| FtsK | CC_3704 | E | Bresu_1050 | E | Atu2759 Atu3210 |
N N |
| FtsQ | CC_2542 | E | Bresu_2689 | E | Atu2088 | E |
| FtsL | CC_2561 | E | Bresu_2783 | E | NH | - |
| FtsB | CC_1725 | N | Bresu_1982 | E | Atu1428 | N |
| FtsW | CC_2552 | E | Bresu_2777 | E | Atu2095 | E |
| FtsN | CC_2007 | E | Bresu_2988 | U | NH | - |
| RlpA | CC_1825 | N | Bresu_1995 | N | Atu1500 | N |
| DipM | CC_1996 | U | Bresu_2621 | N | Atu1700 | E |
| FzlA | CC_3639 | E | Bresu_3143 | E | Atu0293 | E |
| Pal | CC_3229 | E | Bresu_0864 | E | Atu3713 | E |
Designations: E = essential, N = non-essential, U = unresolved/high fitness, NH = no homolog.
C. crescentus essential designations based upon (Christen et al., 2011).
Shown non-essential but with a growth defect in (Radhakrishnan et al., 2010).
C. crescentus essential designations based upon (Goley et al., 2011).
C. crescentus uses the Z-ring inhibitor MipZ for septum placement. Homologs to the Min system, Noc and SlmA are not apparent in the chromosome. Similarly, B. subvibrioides has a MipZ homolog and no apparent homologs to Min proteins, Noc or SlmA. MipZ was characterized as essential in C. crescentus along with the ParA and ParB proteins necessary for MipZ gradient formation (Thanbichler & Shapiro, 2006, Christen et al., 2011). It was later shown that mipZ can be deleted from C. crescentus, but deletion results in severely filamentous and slow-growing cells (Radhakrishnan et al., 2010). Our TnSeq data indicate that MipZ, ParA and ParB are non-essential in B. subvibrioides (Figure 3B, Table 3). For further analysis, mipZ was deleted from the B. subvibrioides chromosome. mipZ deletion does not result in the severe filamentation and growth defect seen in C. crescentus, but an increased variability of cell lengths was observed (Figure 3C). The average cell length of ΔmipZ was statistically longer than wild-type, 3.16 ± 1.41 μm compared to 2.91 ± 0.92 (p < 0.005, Table 4), and Figure 3D demonstrates that while wild-type cells had a relatively narrow length distribution, ΔmipZ cells had a broader distribution. Very often predivisional cells divided asymmetrically, with one very large cell and one very small cell (Figure 3C arrows), similar to the classical Escherichia coli minicell phenotype, and in many cases cells had multiple constrictions. Such phenotypes would be expected if septum site selection had become unregulated. It is not clear why mipZ deletion results in a much more severe growth defect in C. crescentus than B. subvibrioides. One possible explanation may be the naturally slower growth rate of B. subvibrioides (see following section). In the absence of negative regulators of improper Z-ring formation in E. coli, FtsZ forms multiple, topologically unrestrained structures that are likely non-functional because of competition for other divisome components (Bernhardt & de Boer, 2005). Therefore, cells elongate and eventually die. The slow growth of B. subvibrioides may provide sufficient time for some complete divisomes to form prior to cell death. The non-essentiality of parA and parB in B. subvibrioides is not surprising since chromosome segregation is often non-essential under laboratory conditions, as exemplified by E. coli (Hiraga et al., 1989). Deletion of mipZ did not appear to disrupt polar morphogenesis as holdfast was produced (Figure 3E), adhesion was slightly elevated compared to wild-type (Figure 3F), and colony expansion in low percentage agar appeared the same as wild-type (Figure 4).
Table 4.
Cell lengths of B. subvibrioides strains used in this study
| Strain | Cell length (μm) | Cells measured |
|---|---|---|
| Wild-type | 2.91 ± 0.92 | 1700 |
| ΔdivJ | 6.23 ± 4.07† | 588 |
| ΔdivK | 2.83 ± 0.88 | 807 |
| ΔdivJΔdivK | 2.38 ± 0.52† | 2040 |
| ΔgcrA | 3.79 ± 1.78† | 1372 |
| ccrM::pNPTS139 | 3.18 ± 1.14† | 789 |
| ΔmipZ | 3.16 ± 1.41† | 1757 |
Statistically significantly different from wild-type based on two tailed t-test assuming unequal variance, p-value < 0.005
Figure 4.
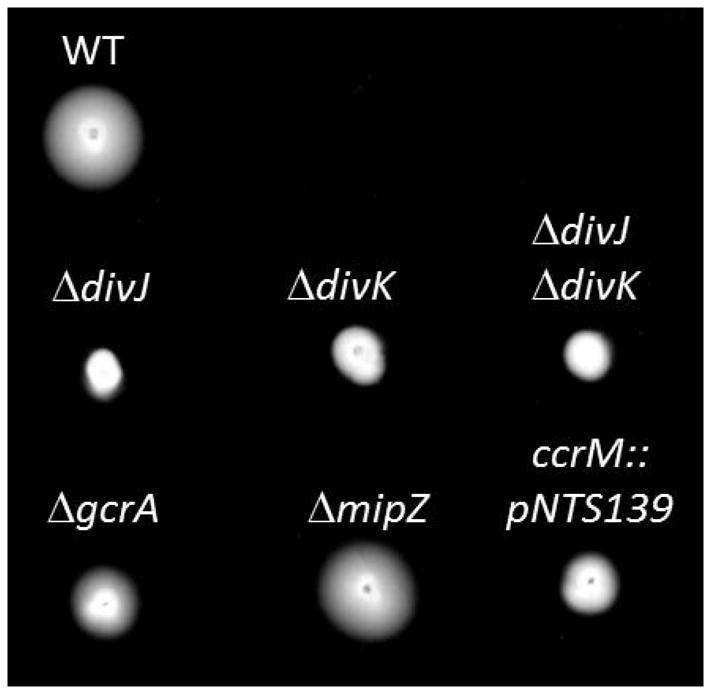
Swim expansion of developmental and cell cycle B. subvibrioides mutants. Equal numbers of cells for each strain were inoculated into low concentration agar PYE medium and incubated in a humid chamber for 5 days. Swim expansion is demonstrated by movement of the colony outwards from the inoculation point.
The divisome is a large multiprotein complex that spans multiple cellular compartments (for review, see (Rico et al., 2013, Lutkenhaus et al., 2012)). The divisome of C. crescentus is well-characterized, and genes and essentiality presented in Table 3 are based upon the work and literature summary of Goley et al (Goley et al., 2011). The divisome components of B. subvibrioides largely match those of C. crescentus, but there are some variations in essentiality. C. crescentus FtsE is essential while the B. subvibrioides homolog is not. It is not clear if B. subvibrioides has a functional paralog since this protein has a high degree of similarity to ABC transporters (de Leeuw et al., 1999), which obscures genome searching. FtsX is also essential in C. crescentus but appears non-essential in B. subvibrioides. Conversely, FtsB is non-essential in C. crescentus but appears essential in B. subvibrioides. Lastly FtsN is essential in C. crescentus but its essentiality is unresolved in B. subvibrioides. Despite these differences, 11 divisome components of 15 analyzed are conserved and have consistent essentiality/non-essentiality between both organisms, suggesting a high degree of similarity in composition and function.
More significant variations in divisome content are seen in A. tumefaciens (Table 3). No homologs to C. crescentus divisome components ZapA, FtsL and FtsN are found in A. tumefaciens. There are also changes in the essentiality of conserved divisome components. A. tumefaciens FtsA (Atu2087) is non-essential while its homolog is essential in C. crescentus. Similarly, A. tumefaciens FtsK (Atu2759) is non-essential, though Atu3210 may be a functional paralog. C. crescentus FtsE is essential but the A. tumefaciens homolog (Atu3606) was unresolved. Lastly, A. tumefaciens has two FtsZ homologs, though only Atu2086 was categorized as essential. Of the 15 divisome components analyzed in this study, only 8 are found in both A. tumefaciens and C. crescentus with the same (non)essentiality. That means roughly half of the divisome components have altered essentiality or are missing in one of the species, representing significant changes in the divisome. Again, the changes in divisome content may reflect the different growth mechanisms of these species, and as stated above, essential cell processes do not appear as flexible in changes to component essentiality until the process has dramatically changed.
A global transcriptional regulator is not essential in B. subvibrioides
Temporal progression of the C. crescentus cell cycle involves several key transcription factors. DnaA initiates chromosome replication and activates genes involved in chromosome partitioning, nucleotide biosynthesis, DNA replication, recombination and repair and gcrA (Hottes et al., 2005). GcrA represses dnaA while activating the transcription of other genes involved in septum site selection, polar development, and ctrA (Holtzendorff et al., 2004, Fioravanti et al., 2013). CtrA regulates at least 95 genes in 55 operons: many of which are involved in polar development, cell division, and DNA replication (Laub et al., 2002). Additionally, CtrA represses gcrA and prevents DNA replication initiation by binding to multiple CtrA boxes at the origin of replication. The TnSeq data were used to analyze the essentiality of homologs to known C. crescentus developmental regulatory signaling and associated cell cycle genes (Table 5). DnaA clearly falls in the essential range as expected because of its critical role in the initiation of DNA replication. CtrA is essential in C. crescentus, and TnSeq data suggests that it is also essential in B. subvibrioides and A. tumefaciens, the latter agreeing with previous results (Kim et al., 2013).
Table 5.
Essentiality of cell cycle regulatorsa
| C. crescentusb | B. subvibrioides | A. tumefaciens | ||||
|---|---|---|---|---|---|---|
| Gene | Gene | Gene | ||||
| DnaA | CC_0008 | E | Bresu_0001 | E | Atu0324 | E |
| GcrA | CC_2245 | Nc | Bresu_0624 | N | NH | - |
| CtrA | CC_3035 | E | Bresu_1213 | E | Atu2434 | E |
| CckA | CC_1078 | E | Bresu_3016 | E | Atu1362 | E |
| DivL | CC_3484 | E | Bresu_0517 | E | Atu0027 | E |
| ChpT | CC_3470 | E | Bresu_1185 | E | Atu2438 | E |
| CpdR | CC_0744 | N | Bresu_0749 | N | Atu3883 | N |
| SciP | CC_0903 | Nd | Bresu_1445 | E | Atu2430 | N |
| CcrM | CC_0378 | Ne | Bresu_2693 | N | Atu0794 | E |
| DivJ | CC_1063 | Nf | Bresu_1199 | N | Atu0921 | E |
| DivK | CC_2463 | E | Bresu_2374 | N | Atu1296 | N |
| PleC | CC_2482 | N | Bresu_0892 | N | Atu0982 | N |
| PodJ | CC_2045 | N | Bresu_3319 | N | Atu0499 | N |
Designations: E = essential, N = non-essential, NH = no homolog.
Essential designations based upon (Christen et al., 2011).
Shown non-essential in (Murray et al., 2013).
Shown non-essential in (Gora et al., 2013)
Shown non-essential in (Gonzalez & Collier, 2013).
Shown non-essential in (Ohta et al., 1992, Jacobs et al., 2001).
Though it was initially characterized as essential (Holtzendorff et al., 2004), GcrA is non- essential in C. crescentus but its deletion causes a severe growth defect and cell filamentation (Murray et al., 2013). In agreement with the C. crescentus result, TnSeq data suggests GcrA is non-essential in B. subvibrioides (Figure 5A). In order to verify this result, an in-frame deletion was created in gcrA. Similar to the C. crescentus ΔgcrA strain, the B. subvibrioides ΔgcrA mutant had a cell filamentation phenotype with a cell length of 3.79 ± 1.78 μm (ave ± st dev) which differs significantly (p < 0.005) from the wild type cell length of 2.91 ± 0.92 μm (Figure 5B, Table 4). However, unlike the C. crescentus mutant the B. subvibrioides ΔgcrA strain did not appear to have a growth rate defect (Figure 5C). The growth rate of ΔgcrA is indistinguishable from wild-type, though it did have a slightly reduced growth yield. Interestingly, the growth defect of C. crescentus ΔgcrA can be partially ameliorated by growing the strain in minimal M2G medium instead of the rich PYE medium (Murray et al., 2013), suggesting that slowing the growth rate of the organism can partially suppress the growth defect. The lack of a growth defect for B. subvibrioides ΔgcrA may stem from the fact this organism naturally grows more slowly than C. crescentus. The doubling time of C. crescentus in PYE has been reported as 89 min (Hottes et al., 2004), while the doubling time of B. subvibrioides is 392 min (6.5 hrs). Deletion of gcrA did impact polar development in B. subvibrioides. Mutants produced holdfast but displayed moderately reduced surface adhesion compared to wild-type (Figure 5BD). Mutants also displayed reduced swim expansion on low-percentage agar plates (Figure 4), though the reduced swim expansion may be caused in part by the cell filamentation. Many polar developmental defects in C. crescentus can be traced to impacts on CtrA (Curtis et al., 2012, Skerker & Shapiro, 2000, Stephens et al., 1995). It may be that deletion of gcrA does not significantly impact the total cell cycle but it may impact CtrA activity enough to result in the defects shown here. It has already been shown that some CtrA-dependent promoters, such as pilA, are more sensitive to changes in CtrA activity than others (Curtis et al., 2013).
Figure 5.

Characterization of the B. subvibrioides ΔgcrA strain. A) Transposon map demonstrating that gcrA is non-essential in this organism. Each bar is a unique insertion site and height represents frequency of detection for that insertion site. B) Lectin staining of holdfast material of wild-type and ΔgcrA. C) Growth of ΔgcrA compared to wild-type in PYE medium. Each strain was analyzed in triplicate. D) Short-term adhesion assay of ΔgcrA. Equal numbers of cells for wild-type and ΔgcrA were inoculated into 24-well petri dishes and incubated for 2 h (in triplicate). After incubation, each well was washed three times with PYE and stained with crystal violet. After washing away excess crystal violet, bound stain was eluted and measured spectrophotometrically. Values were normalized to wild-type. Each assay was performed three times and average and standard deviation were calculated.
While GcrA homologs are present in several A. tumefaciens strains, including F2, 5A, WRT31 and CCNWGS0286, in silico analysis did not reveal a GcrA homolog in the C58 strain used here and in other laboratories. This analysis included both published versions of the C58 genome (Goodner et al., 2001, Wood et al., 2001). Given the fact that GcrA is non-essential in multiple organisms, this brings up the intriguing possibility that GcrA may have been recently lost from the A. tumefaciens C58 strain.
The highly conserved DNA methylase CcrM is non-essential in B. subvibrioides
CcrM is an enzyme that methylates the adenine of GANTC sites within the C. crescentus genome. Promoter methylation has been implicated in the regulation of critical cell cycle components dnaA, ctrA, ftsZ, and mipZ (Collier et al., 2007, Reisenauer & Shapiro, 2002, Gonzalez & Collier, 2013), and recent evidence suggests that the transcription of more than 10% of C. crescentus genes is influenced by CcrM methylation activity (Gonzalez et al., 2014). CcrM is conserved through all Alphaproteobacterial families except the Rickettsiales (Brilli et al., 2010, Gonzalez et al., 2014), and it was found to be essential in R. meliloti (Wright et al., 1997) and B. abortus (Robertson et al., 2000). While CcrM was initially characterized as essential in C. crescentus (Stephens et al., 1996), it was recently shown that CcrM is only essential under fast-growth conditions (Gonzalez & Collier, 2013). The conditional essentiality was linked to a methylation site within the ftsZ promoter region. ccrM mutants could be grown under fast-growth conditions by inducing expression of ftsZ.
The TnSeq data here suggests that CcrM is essential in A. tumefaciens (Figure 6A, Table 2). However, the data also suggest that CcrM is not essential in B. subvibrioides (Figure 6A, Table 2). This result was verified by creating an insertional disruption of the ccrM gene. The resulting mutant displayed very little disruption in the cell cycle. The growth rate of this strain was indistinguishable from wild-type (Figure 6B), though it had a slightly reduced growth yield, and cells were only slightly longer than wild-type 3.18 ± 1.14 μm (p < 0.005, Figure 6C, Table 4).
Figure 6.

Characterization of the B. subvibrioides ΔccrM strain. A) Transposon map of ccrM demonstrating that it is likely essential in A. tumefaciens and non-essential in B. subvibrioides. Each bar is a unique insertion site and height represents frequency of detection for that insertion site. B) Growth of ΔccrM compared to wild-type in PYE medium. Each strain was analyzed in triplicate. C) Lectin staining of holdfast material of wild-type and ΔccrM. C) Growth of ΔgcrA compared to wild-type in PYE medium. Each strain was analyzed in triplicate. D) Comparison of ftsZ promoters from C. crescentus (C.c.) and B. subvibrioides (B.s.). Annotation of features was based up on Kelly et al. (Kelly et al., 1998). E) Short-term adhesion assay of ΔccrM. Equal numbers of cells for wild-type and ΔccrM were inoculated into 24-well petri dishes and incubated for 2 h (in triplicate). After incubation, each well was washed three times with PYE and stained with crystal violet. After washing away excess crystal violet, bound stain was eluted and measured spectrophotometrically. Values were normalized to wild-type. Each assay was performed three times and average and standard deviation were calculated.
The disruption of ccrM in B. subvibrioides does not appear to significantly disrupt the cell cycle, but it does appear to disrupt polar development. While the mutant produces holdfast (Figure 6C), it displays a moderate reduction in adhesion (Figure 6E), and has reduced motility in low percentage agar even though it is motile in liquid media (Figure 4). These are surprising results given that no direct link between CcrM and polar development in C. crescentus has been shown, though in the original CcrM identification study it was shown that constitutive ccrM expression results in aberrant cell elongation and possible stalk morphogenesis defects, likely due to increased chromosome number (Zweiger et al., 1994).
Differing essentialities of DivJ/DivK
In addition to its role in the temporal cascade of regulators in C. crescentus, the activation of the response regulator CtrA is spatially controlled such that it is active in the nascent swarmer cell after division, thus blocking chromosome replication initiation, and de-activated in the nascent stalked cell, permitting chromosome replication initiation. Spatial control of CtrA activation is mediated by a complex signaling network principally composed of two-component signaling proteins (Figure 7A).
Figure 7.

Characterization of the B. subvibrioides ΔdivJ, ΔdivK and ΔdivJΔdivK strains. A) A histidine kinase, DivJ, is localized to the stalked pole in the growing predivisional cell (Wheeler & Shapiro, 1999). DivJ phosphorylates the single domain response regulator DivK (Wheeler & Shapiro, 1999, Matroule et al., 2004). At the pole opposite the stalk (flagellar pole), another histidine kinase, PleC, de-phosphorylates DivK (Deich et al., 2004, Wheeler & Shapiro, 1999). DivJ and PleC have antagonistic activities on DivK until the time of cell division, at which point the activities are physically separated, leading to DivK becoming highly phosphorylated in the stalked cell and de-phosphorylated in the swarmer cell. DivK~P prevents a functional interaction between a degenerate histidine kinase DivL and a hybrid histidine kinase CckA (Tsokos et al., 2011). CckA, along with the histidine phosphotransfer protein ChpT (not pictured), phosphorylates and activates CtrA when CckA functionally interacts DivL (Jacobs et al., 2003, Biondi et al., 2006b). CckA and ChpT also phosphorylate another response regulator CpdR (not pictured) which controls the stability of CtrA (Iniesta et al., 2006). In the nascent stalked cell, DivK becomes phosphorylated, disrupting functional DivL-CckA interaction, reversing phosphate flow, and deactivating CtrA, which permits chromosome replication initiation (Tsokos et al., 2011, Chen et al., 2009). In the nascent swarmer cell, DivK is de-phosphorylated, permitting functional DivL-CckA interaction, activating the phosphorelay that activates CtrA, resulting in repression of chromosome replication. The ability of CtrA to transcriptionally activate genes in the swarmer cell is inhibited by a small regulatory protein SciP (Tan et al., 2010, Gora et al., 2013, Gora et al., 2010). B) Transposon map demonstrating the essentiality or non-essentiality of divJ and divK in A. tumefaciens and B. subvibrioides. Each bar is a unique insertion site and height represents frequency of detection for that insertion site. C) Lectin staining of holdfast material of wild-type and ΔdivJ, ΔdivK and ΔdivJΔdivK strains. D) Short-term adhesion assay of ΔdivJ, ΔdivK and ΔdivJΔdivK strains. Equal numbers of cells were inoculated into 24-well petri dishes and incubated for 2 h (in triplicate). After incubation, each well was washed three times with PYE and stained with crystal violet. After washing away excess crystal violet, bound stain was eluted and measured spectrophotometrically. Values were normalized to wild-type. Each assay was performed three times and average and standard deviation were calculated. E) Transmission electron micrographs demonstrating that the ΔdivJ and ΔdivK strains still produce flagella. F) Histogram of wild-type and ΔdivK cell sizes demonstrating deletion of divK causes a slight decrease in cell length.
As CtrA is essential in C. crescentus, it is no surprise that the phosphorelay involved in its activation is also essential, including DivL, CckA and ChpT (Jacobs et al., 1999, Biondi et al., 2006a, Reisinger et al., 2007, Sciochetti et al., 2005, Christen et al., 2011). CpdR is non-essential in C. crescentus (Iniesta et al., 2006), as well as B. subvibrioides and A. tumefaciens. SciP is non-essential in C. crescentus (Gora et al., 2013, Gora et al., 2010), though disruption does result in growth defects severe enough where it was characterized essential in some studies (Christen et al., 2011, Tan et al., 2010). In this work SciP was found non-essential in A. tumefaciens but essential in B. subvibrioides. DivK is essential in C. crescentus (Hecht et al., 1995), presumably because lack of DivK would result in overactivation of CtrA that then would prevent chromosome replication. Curiously, DivJ is not essential in C. crescentus (Jacobs et al., 2001, Ohta et al., 1992), suggesting that DivK~P can be generated in the cell by alternative means, such as crosstalk with another kinase or small molecule phosphorylation. Disruption of divJ in C. crescentus results in slow growth, cell filamentation, ectopic stalk placement and overproduction of holdfast (Ohta et al., 1992, Jacobs et al., 2001, Pierce et al., 2006). PleC and its localization protein PodJ are not essential in C. crescentus (Viollier et al., 2002a, Viollier et al., 2002b, Hinz et al., 2003, Christen et al., 2011).
The TnSeq data here suggests that DivL, CckA and ChpT are all essential in both B. subvibrioides and A. tumefaciens. In B. subvibrioides the divL transposon density falls in the unresolved trough area, however it is likely essential as the vast majority of detected transposons are found in the C-terminal ATPase domain coding region (which covers more than 20% of the 3’ end), elevating its internal transposon density. It has been previously shown that the ATPase domain can be deleted without causing lethality in C. crescentus (Reisinger et al., 2007, Sciochetti et al., 2005). While these results agree with the C. crescentus data, the data here suggest that DivJ and DivK essentialities are reversed in A. tumefaciens compared to C. crescentus; that DivJ is essential and DivK is not (Figure 7B, Table 5), as recently shown (Kim et al., 2013). These results suggest that in A. tumefaciens DivK may not be the only protein that can modulate the interaction between DivL and CckA.
The TnSeq results for B. subvibrioides are different from both C. crescentus and A. tumefaciens. The data suggest that neither DivJ nor DivK are essential in B. subvibrioides (Figure 7B, Table 5). These results were confirmed by creating deletions of divJ and divK. The B. subvibrioides ΔdivJ mutant has similar phenotypes to the C. crescentus mutant; it displays severe filamentation (6.23 ± 4.07 μm, Table 3) and appears to produce more holdfast than the wild-type (Figure 7C). While holdfast is typically detected in wild-type B. subvibrioides only at the center of rosettes, ΔdivJ cells have holdfasts at the end of the majority of individual cells as well. Correlated with this result, ΔdivJ has slightly increased binding in the short-term adhesion assay (Figure 7D). This strain has severely reduced motility in low percentage agar (Figure 4); it is not clear if this is due to cell filamentation or impacted flagellar synthesis/function. Flagella appear to be produced by this strain based on TEM examination (though perhaps at lower frequency, Figure 7E), and cells are motile under liquid mount (data not shown).
A cold-sensitive divK mutant in C. crescentus grown at the restrictive temperature results in filamentous cells with ectopic stalks placed along the cell filament (Hecht et al., 1995). While the exact nature of the cold-sensitive mutation phenotypes is unknown, a strain depleted of DivK by controlled expression also results in filamentous cells (Iniesta & Shapiro, 2008), though stalk and holdfast formation in this strain are unknown. These phenotypes are similar to those of a divJ mutant, as may be expected because both mutants should result in increased interaction between DivL and CckA leading to increased CtrA activation. Surprisingly, the phenotypes of a ΔdivK mutant in B. subvibrioides were in many ways opposite that of a ΔdivJ mutant. Instead of being filamentous, ΔdivK cells were wild-type in length (Figure 7C, Table 4). The ΔdivK strain showed an average cell length of 2.83 ± 0.88 μm compared to wild-type 2.91 ± 0.92 μm. Though the cells often seemed shorter than wild-type, a two tailed t-test to determine if the populations were different resulted in a p-value of 0.04. A histogram of cell size distribution (Figure 7F) shows a slight shift towards shorter cell sizes for ΔdivK. Cells produced no detectable holdfast by lectin staining (Figure 7C), nor formed rosettes, and the strain was severely deficient in the short-term adhesion assay (Figure 7D) to the point where adhesion was barely detectable. It is clear that the genes deleted in B. subvibrioides are homologs of the C. crescentus counterparts. The B. subvibrioides divJ homolog is the bi-directional best with C. crescentus and has 48% identity at the amino acid level over the entire gene (all other hits only cover the C-terminal portion); the divK ortholog is the bi-directional best hit with the C. crescentus divK gene with 80% identity at the amino acid level (no other predicted protein has more than 35% identity) and it is in the same genomic context within an operon with pleD. Additionally, the histidine kinase PdhS implicated in cell cycle regulation of A. tumefaciens (Kim et al., 2013) is absent in both C. crescentus and B. subvibrioides. The discrepancy in phenotypes suggests that the DivJ-DivK system in B. subvibrioides may be operating differently from that of C. crescentus despite the fact that they are so closely related. Interestingly, the B. subvibrioides ΔdivK mutant displayed severely reduced swim expansion in low percentage agar (Figure 4), despite the fact that flagella appear to be produced as seen by TEM (Figure 7E) and cells are motile in liquid microscopic mounts (data not shown). The reduction in motility despite the fact that swimming motility is observed may be indicative of premature swarmer cell differentiation, which may be reflected in the slight decrease in overall cell length as swarmer cells in C. crescentus are typically shorter than stalked cells (Terrana & Newton, 1975, Lam et al., 2006).
To determine the epistatic relationship between divJ and divK in B. subvibrioides, a ΔdivJ ΔdivK double mutant was constructed and was found to phenocopy ΔdivK. The cells were not filamentous and in this case statistically significantly smaller than wild-type (2.38 ± 0.52 μm, p < 0.005, Figure 7C, Table 4). Cells displayed no holdfast by lectin staining (Figure 8B), virtually no adhesion by the short-term adhesion assay (Figure 7D), and reduced motility in low percentage agar (Figure 4). These results suggest that DivK operates downstream of DivJ as would be expected if they function as a signaling pair as demonstrated in C. crescentus. How the mutations lead to such drastically different phenotypes is unknown.
Discussion
In this study, saturating transposon mutagenesis with subsequent calculation of internal transposon densities was used to determine the essential genes of two Alphaproteobacteria. Clustering analysis was used to group transposon densities, and densities in the regions between essential and non-essential peaks were observed to group together (Figure 2). A previous study that used transposon densities to define essential genes in S. typhi only had 19 genes that could not be classified into one of the two populations (Langridge et al., 2009), compared to 211 ORFs from A. tumefaciens and 120 ORFs from B. subvibrioides in this study. Transposon density is a proxy for the prevalence of insertions in a given gene in the total mutant pool and thus the fitness a gene provides under the mutagenesis conditions. An insertion that causes immediate DNA replication arrest will only have one copy in the pool and thus a much lower probability of sequencing while an insertion that causes no growth defect will have multiple copies in the mutant pool. Different lethal insertions may allow different numbers of replication cycles before growth ceases, yielding different numbers of copies of the insertion. Conversely, an insertion into a gene may not cause lethality, but reduce growth and therefore lead to reduced prevalence of the insertion in the mutant pool. In this case, the area of the transposon density plot between the essential and non-essential gene peaks is potentially where the fitness of an essential gene whose mutation still allows a few replication cycles overlaps with that of a non-essential gene whose mutation causes slow growth. Therefore the transposon densities may provide more subtle degrees of fitness instead of strict essential vs. non-essential categorization.
The comparison of the essential gene sets from the three organisms of interest to this study revealed only 106 genes that were conserved and essential in all the organisms, a surprisingly small number given each organism has over 300 essential genes each. The 106 genes were compared to the 206 Minimal Gene Set developed by Gil et al. (Gil et al., 2004). While those authors specifically point out that an essential gene set and the minimal gene set are quite different things, it provides a useful summary for the genes and functions that would be expected in the conserved essential gene set. 55 of the 106 conserved essential genes are found in the Minimal Gene Set. While many of the remaining 51 conserved essential genes missing from the Minimal Gene Set are easily explained by that set excluding the major processes of cell wall synthesis and electron transport, what is more surprising is the 151 genes in the Minimal Gene Set missing from the conserved essential gene list. These include most of the constituents of the DNA Polymerase III complex, 15 of the 21 tRNA synthase components, many translation components, ATP synthase components, and phospholipid biosynthesis components. Clearly these are essential cell processes and are very likely conserved and essential in all the organisms of this study. So why are they missing from the conserved essential gene list? There are multiple complicating factors. First are the unresolved genes. As stated, the unresolved genes likely contain a number of essential genes, but their categorization as unresolved removes them from the conserved essential set. Secondly, genes orthologs were determined by reciprocal bidirectional best hits, e.g. where gene-1 from organism-A was used to BLAST search organism-B resulting in gene-2 as the best match, then gene-2 was used to BLAST search organism-A and the best result was gene-1. This is a relatively strict measure of orthology and many conserved essential genes are missing because they simply did not meet the reciprocal best hit criteria. For example, valyl-tRNA synthetase, glutamyl-tRNA synthetase, and DNA Pol III subunits β and β’ are found conserved and essential between B. subvibrioides and C. crescentus, and they are not listed as conserved essential in all three organisms because the A. tumefaciens homologs failed the reciprocal best hit analysis. It is also possible for redundant genes to cause some components to be missing from the conserved essential list. Yet despite these complications, this analysis characterized 136 genes conserved between the three organisms that have altered essentiality in at least one. This could represent a significant amount of physiological variation that would not be detected by genomic data alone.
The processes of cell wall synthesis and cell division are critical to the propagation of an organism. It is no surprise then that the biosynthetic pathways for peptidoglycan precursors are virtually identical between all three species. C. crescentus and B. subvibrioides are highly similar in most other cell cycle processes. Though differences are seen in the number of redundant multifunctional PBPs and the essentiality of some conserved divisome components, the cell cycle machinery is largely the same. In this situation, the TnSeq results enrich the genomic information, with essentiality conservation generally following gene conservation. Compare these results to those of the cell cycle regulators. Aside from DnaA and CtrA (and some components of CtrA activation), some cell cycle regulatory genes display altered essentiality despite the genes being conserved in both organisms. In this case, the TnSeq results provide novel (high-throughput-based) information on the functionality of these signaling proteins that cannot be obtained from pure genomic information. Additionally, these results suggest that the cell cycle regulatory mechanisms are more plastic than the cell cycle machinery itself. The plasticity of the cell cycle regulatory mechanisms was also seen in the A. tumefaciens TnSeq results, particularly in the variation of DivJ and DivK essentiality. However, this organism displays greater changes in gene and essentiality conservation of cell wall synthesis and septum formation than the other two. It is likely that these changes stem from the polar growth pattern of the organism. The essential genes are of particular interest as they may provide clues and bases of study into the mechanism of this alternative growth pattern. In total, these results suggest that cell cycle regulatory processes are generally more adaptable than the core processes they regulate and may be a potent source of variation and customization of bacterial cell cycles to better compete in the niches the organisms inhabit. There may be many sources of variability. As different cellular processes are added or removed over the course of evolution, the context in which these regulatory proteins operate may change, causing changes in essentiality. Additionally, some of these proteins have multiple functions. For example, DivK regulates CckA activity, but it is also thought to regulate the kinase/phosphatase activity of PleC during a critical point in the swarmer cell stage (Subramanian et al., 2013). Small changes may emphasize one process over another, again altering essentiality.
In C. crescentus, the MipZ protein performs a similar function to MinCD in that they are concentrated at the cell pole and prevent FtsZ polymerization, thereby directing the Z-ring to the midcell. Removal of MinCD allows ectopic Z-ring polymerization, thus leading to the formation of minicells. Removal of MipZ from B. subvibrioides creates a similar phenotype as seen in the increased variability of cell lengths (Figure 3B), but does not appear to cause significant growth defects. Perhaps then the surprising result is not that MipZ is non-essential in B. subvibrioides, but that its removal causes such severe filamentation in C. crescentus, so much so that in many studies it was categorized as essential (Christen et al., 2011, Thanbichler & Shapiro, 2006). What may cause these differences in phenotype? One hypothesis is that it could be a consequence of growth rate. In C. crescentus, CcrM is non-essential when the growth rate is reduced. It is possible that the filamentation of C. crescentus ΔmipZ may be ameliorated by reducing the growth rate of the strain. Both proteins modulate the formation of the Z-ring; expression in the case of CcrM, localization for MipZ. Categorization of MipZ as clearly non-essential in B. subvibrioides may have been possible because that organism naturally grows slower than C. crescentus on PYE.
The conditional essentiality of CcrM in C. crescentus is linked to methylation-dependent activity of the ftsZ promoter, but does this regulatory scheme explain the essentiality (or non-essentiality) of CcrM in other organisms? A comparison of the ftsZ promoter regions of C. crescentus and B. subvibrioides was performed to determine if the non-essentiality of CcrM in B. subvibrioides could be linked to altered ftsZ regulation, i.e. if the B. subvibrioides ftsZ promoter region lacks a CcrM methylation site. The promoter regions for ftsZ from C. crescentus and B. subvibrioides are presented in Figure 6D, with annotations based upon Kelly et al. (Kelly et al., 1998, Gonzalez & Collier, 2013). The B. subvibrioides ftsZ promoter is similar to that of C. crescentus. Both have CtrA binding sites, and more importantly both have a conserved CcrM methylation region (methylation site and 1 base pair on either side). This suggests that the B. subvibrioides ftsZ promoter region still has different methylation states during the cell cycle like C. crescentus; whether the methylation state impacts ftsZ expression is unknown. Given the similarity in promoters, it may be that CcrM is non-essential in B. subvibrioides because of its naturally slow growth, as slow growth did suppress the ccrM defects in C. crescentus (Gonzalez & Collier, 2013). However, there is a critical difference between the two promoters: the −10 regions are very different. Not only are the sequences different, but there is a 2 bp deletion in the presumed B. subvibrioides −10 region. CcrM may not be essential in B. subvibrioides because ftsZ is under a different mechanism of regulation. However, while the B. subvibrioides sigma-70 homolog shares over 82% amino acid identity to the C. crescentus homolog, it is possible that the B. subvibrioides homolog may recognize a different consensus sequence and could still participate in ftsZ transcription. It is also worth noting that the C. crescentus ftsZ -10 region of AGATTATGC deviates from the published sigma-70 consensus of GCTANAWC (Malakooti & Ely, 1995, Malakooti et al., 1995).
Other methyltransferases in B. subvibrioides may also provide functional redundancy to CcrM. Two other adenine methylation motifs were discovered in C. crescentus and were linked to the proteins encoded by CCNA_00869 and CCNA_00656 (Kozdon et al., 2013), but neither have homologs in B. subvibrioides. However, analysis of the B. subvibrioides genome using REBASE (Roberts et al., 2010) uncovers a number of other potential methyltransferases with no homologs in C. crescentus. CcrM (Bresu_2693, 74% identity to the C. crescentus homolog) is a Type II D21 class adenine methyltransferase; another member of this class is present in the genome (Bresu_1999, 28% identity to C. crescentus CcrM). Additionally, there are two Type II D12 class adenine methyltransferases (Bresu_1408 and Bresu_3035). Bresu_0174 encodes for a C-5 cytosine methyltransferase homologous to CCNA_03741 in C. crescentus, which was shown to recognize the sequence GGCGCC (methylated C bolded, (Kozdon et al., 2013)). None of these enzymes were found to be essential in this study. B. subvibrioides encodes one apparent restriction endonuclease (Type II, Bresu_2032). Interestingly, the endonuclease gene orientation converges with Bresu_2033, a predicted cytosine methyltransferase. While the endonuclease was not found to be essential, the methyltransferase was, suggesting that these two enzymes form a restriction system. Clearly there are a number of DNA methyltransferases that may cover loss of CcrM in B. subvibrioides. However, disruption of ccrM does have phenotypic consequences in polar development in this species, suggesting that if functional redundancy is present in B. subvibrioides it is not totally equivalent. Given these facts, it is unclear why CcrM is non-essential in B. subvibrioides.
CcrM is non-essential in C. crescentus and B. subvibrioides, but it appears essential in A. tumefaciens, R. meliloti and B. abortus. Are these cases where ftsZ is still regulated by promoter methylation and fast culturing conditions prevents the inactivation of ccrM, or is there another explanation? There are no CcrM methylation sites within 300 bp of the R. meliloti ftsZ (SMc01874) translational start site. There is one site 42 bp before the A. tumefaciens ftsZ (Atu2086) and two sites 291 and 123 bp before the B. abortus ftsZ (BAbS19_I13500), but none of these methylation sites are near any putative CtrA-binding sites, as seen in C. crescentus and B. subvibrioides. Therefore it is likely that CcrM is essential in these organisms not because it participates in ftsZ regulation, but for some other reason. Based on these findings, CcrM’s role in the cell cycle may be more variable over genetic distance compared to other cell cycle regulatory components, with its role adapted to different purposes in different organisms.
The differences in CcrM essentiality is just one of the many differences in essentiality between cell cycle components identified in this study. The number and severity of differences between the organisms were startling as we hypothesized the essentiality of the cell cycle components would be virtually identical between C. crescentus and B. subvibrioides given how close they are evolutionarily and ecologically. These results demonstrate that even though the genes may be conserved between organisms, significant operational variation can be found even over short evolutionary distances. These results also suggest that the developmental signaling paradigm established in C. crescentus may be more variable and more customizable than previously thought. It was predicted that cell cycle regulation in the Rhizobia would be very similar to C. crescentus (Brilli et al., 2010), however in A. tumefaciens DivJ and DivK have opposite essentiality than in C. crescentus, a GcrA homolog is missing, and CcrM is likely essential for reasons other than regulating ftsZ expression. The variability of organisms highlights just how much more there is to learn about this group of bacteria.
Experimental Procedures
Strains and growth conditions
A complete list of strains used in this study is presented in Table S-1. B. subvibrioides was cultured at 30°C on PYE medium (Poindexter, 1964) or 2X PYE. Where necessary, kanamycin was used at 5 μg/ml. PYE plates containing 3% sucrose were used for counter-selection. A. tumefaciens was cultured on LB (10 g/L tryptone, 5 g/L yeast extract, 10 g/L NaCl) medium at 26°C. Where necessary, kanamycin was used at 50 μg/ml. Escherichia coli was cultured on LB medium at 37°C. Where necessary, kanamycin was used at 50 μg/ml.
Preparation of transposon libraries
The method of transposon mutagenesis was based on that of Langridge et al (Langridge et al., 2009). EZ-Tn5 <Kan-2> transposome (Epicentre) was electroporated into freshly prepared electrocompetent cells.
For A. tumefaciens, a 25 ml LB culture was grown to OD600 = ~1.0 and cells were harvested by centrifugation (12,000 x g, 5 min, 4°C). Cells were resuspended in 25 ml ice-cold 10% glycerol and centrifuged. Cells were again resuspended in 25 ml ice-cold 10% glycerol, centrifuged and finally resuspended in 250 μl ice-cold 10% glycerol. One microliter of EZ-Tn5 transposome was added to the cells and mixed by gentle pipetting. Cells were then aliquoted to 5 chilled electroporation cuvettes (0.1 mm) and electroporated (2.4 kV, 25 mF, 200 Ω). Each electroporation was resuspended in 1 ml LB and grown shaking at 26°C for 3 h. The cultures were plated 3 X 350 μl on 150 mm diameter LB + kanamycin plates. This procedure was repeated 20 times for a total of 100 transformations. Plates were incubated at room temperature (~23°C) for 2 days and stored at 4°C until colonies were harvested.
For B. subvibrioides, a 25 ml 2X PYE culture was grown to OD600 = ~1.0 and cells were harvested by centrifugation (12,000 x g, 5 min, 4°C). Cells were resuspended in 25 ml ice-cold water and centrifuged. Cells were again resuspended in 25 ml ice-cold water, centrifuged, and finally resuspended in 250 μl ice-cold water. One microliter of EZ-Tn5 transposome was added to the cells and mixed by gentle pipetting. Cells were then aliquoted to 5 chilled electroporation cuvettes (0.1 mm) and electroporated (1.5 kV, 25 μF, 400Ω). Each electroporation was resuspended in 1.0 ml 2X PYE and grown shaking at 30°C for 3 h. The cultures were plated 3 X 350 μl on 150 mm diameter PYE + kanamycin plates. This procedure was repeated 20 times for a total of 100 transformations. Plates were incubated at 30°C for 5 days and stored at 4°C until colonies were harvested.
Cells were harvested from plates with a sterile spreader and were combined into a single pool of transformants per organism. Several aliquots from each pool were frozen at -80°C in 10% DMSO for future study. The remainder of each pool was centrifuged (12,000 x g, 15 min, 4°C) and cell pellets were frozen.
Transposon library sequencing
A schematic overview of library preparation is presented in Figure S-3. Genomic DNA was harvested from transformant pools using the Qiagen Maxi Prep Kit. Cell pellets were thawed with 11 ml Buffer B1 (with RNase A) until the supernatant had an OD600 = ~2.0. This supernatant was then used for the Maxi Prep Kit according to manufacturer’s instructions.
Library preparation, sequencing and sequence analysis was performed by the Indiana University Center for Genomics and Bioinformatics. To prepare the DNA for sequencing, 10 μg of DNA was resuspended in a final volume of 100 μl of TE (Tris-EDTA) buffer and nebulized at 45 psi for 1 min 15 s. Nebulized DNA was then purified and assayed on a DNA7500 chip (Agilent Technologies). Nebulized DNA aliquots were divided in half so that each library would have approximately 5 μg of starting material. Fragmented DNA was subjected to End Repair as outlined in the Multiplexing Sample Preparation Guide (Illumina). Following end repair, the samples were subjected to a 1.8X AmpureXP (Beckman Coulter) cleanup followed by a 1X AmpureXP cleanup to size select the end repaired DNA. One sample was then assayed on D1K High Sensitivity TapeStation tape (Agilent Technologies). Samples were subjected to A-tailing and AmpureXP purification (1.8X) as detailed in the Multiplexing Sample Preparation Guide. Ligation reactions involving the Illumina PE Adaptor were then performed and following purification with a 1X ratio of AmpureXP, the samples were again assayed on the TapeStation using D1K High Sensitivity tapes to verify that adaptor ligation was successful. Amplification reactions were performed with the following conditions: 28 μl DNA template, 1 μl multiplex primer, 10.3 μl water, 5 μl 10X Accustart Buffer, 2 μl 50 mM MgSO4, 1 μl 10 mM dNTP mix, 1 μl Transleft primer (Table S-2, 25 μM), 1 μl IN2.0 primer (0.5 μM) and 0.7 μl Accustart Hifi Taq. The following thermalcycler conditions were used: 94°C 1:30; 5 cycles of 94°C for 15 s, 58°C for 45 s and 68°C for 30 s, 15 cycles of 94°C for 15 s, 65°C for 45 s and 68°C for 30 s, and 68°C for 10 min. Following amplification, the reactions were purified using a 1X ratio of AmpureXP beads and eluted in 28 μl EB buffer. Samples were then assayed on the TapeStation using D1K High Sensitivity tapes.
Sequencing was performed on an Illumina GA2-PEM2X instrument. Sequencing runs were 146 base pair paired-end with 7-base index reads. Sequencing runs were performed using v8.3px and v4 Illumina Cluster Kit (120 tiles per lane) along with a v5 Illumina SBS run reagent kit. Sequencing out of the transposon was accomplished by using the Seq-out-transposon primer (Table S-2, 0.5 mM). This primer annealed over the junction of the 3’ end of the inner transposon and the 3’ mosaic sequence; thus all sequencing read outward of the 3’ end of the transposon. Exposure time for the lasers was 1225ms (A=500, C=350, G=200, T=175). Image analysis was performed by Illumina RTA 1.9.35.
The sequencing data were processed as follows. Sequence reads that lacked the 10 bp transposon sequence at the start were culled, and the transposon sequences were trimmed from reads of interest prior to mapping. Sequences were mapped using the following reference genetic elements: A. tumefaciens C58 genomes and plasmids (NC_003304.1, NC_003305.1, NC_003306.1, NC_003308.1), B. subvibrioides ATCC 15264 genome (CP002102.1). The mapping tool used was BWA allowing -n = 3 (max number of mismatches per read) and -o = 1 (max number of gap openings) (Li & Durbin, 2009, Li & Durbin, 2010). The read alignments with insertion sites are inferred from the BWA output, which is in SAM format, by filtering for soft clipped portions. From the alignment file, the insertion site for each read was listed where the insertion site was defined as the coordinate to which the 5’ end of the read mapped. The frequency of the insertion site was computed where the frequency was defined as the number of reads at any given unique insertion site. The insertion sites were annotated based on the ORF coordinates.
Identification of essential genes
An analysis similar to that performed for Salmonella typhi, which used transposon density, was utilized (Langridge et al., 2009). There were two complicating factors in using transposon density in this study. First, determination of ORFs in these organisms was performed by auto-annotation and very often had incorrect start sites. Many genes were seen that had a large number of transposon insertions at the 5’ end, but very few insertions in the bulk of the coding sequence. Second, many essential genes can tolerate insertions in the 3’ portion of the coding region, producing a truncated, but partially functional gene product. To compensate for these issues, 5, 10, 15 and 20% of the coding sequence from both the 5’ end and 3’ end of each ORF was disregarded in calculating transposon density. Excluding 20% from each end of genes from the analysis provided the best distinction between essential and non-essential genes. The transposon density for the internal 60% of each ORF was calculated and plotted on a histogram. While the histogram produced an essential gene peak and a non-essential gene peak, the area between the peaks was more extensive and contained a large number of unresolved genes. Internal transposon densities were subjected to Ward’s clustering analysis to categorize genes as essential, non-essential and unresolved.
Cloning and mutagenesis
A complete list of primers used in this study is presented in Table S-2. A B. subvibrioides divJ deletion construct was created by PCR amplifying a ~500 bp upstream fragment using primers Bsub1-1 and Bsub1-2 and a ~500 bp downstream fragment using primers Bsub1-3 and Bsub1-4, followed by digestion and ligation into plasmid pNPTS139 (M.R.K. Alley, unpublished). A B. subvibrioides divK deletion construct was created by PCR amplifying a ~500 bp upstream fragment using primers Bsub2-1 and Bsub2-2 and a ~500 bp downstream fragment using primers Bsub2-3 and Bsub2-4, followed by digestion and ligation into plasmid pNPTS139. A B. subvibrioides gcrA deletion construct was created by PCR amplifying a ~500 bp upstream fragment using primers Bsub3-1 and Bsub3-2 and a ~500 bp downstream fragment using primers Bsub3-3 and Bsub3-4, followed by digestion and ligation into plasmid pNPTS139. A B. subvibrioides mipZ deletion construct was created by PCR amplifying a ~500 bp upstream fragment using primers Bsub4-1 and Bsub4-2 and a ~500 bp downstream fragment using primers Bsub4-3 and Bsub4-4, followed by digestion and ligation into plasmid pNPTS139. A B. subvibrioides ccrM insertional disruption construct was created by PCR amplifying a ~500 bp internal fragment situated close to the 5’ end of the gene using primers Bsub5-5in and Bsub5-6in, followed by digestion and ligation into plasmid pNPTS139.
Deletion constructs were transformed using the B. subvibrioides electroporation protocol described above. Genetic deletion was performed by two-step selection, first for kanamycin resistance and sucrose sensitivity, followed by sucrose resistance and kanamycin sensitivity (Stephens et al., 1996). Successful deletion was confirmed by PCR.
Imaging
Phase contrast imaging was performed on either a Nikon Eclipse E800 microscope with a 100× Plan Apo oil immersion objective and a Photometrics Cascade 1K cooled charged-coupled device camera, or an Olympus IX-81 microscope with a 100x Plan Apo oil immersion objective and an Andor iXon EMCCD camera. Cells were spotted on agarose pads made using PYE broth and 1.0% electrophoresis-grade agarose and immediately viewed. Fluorescent wheat germ agglutinin (lectin) binding assays were performed as previously described (Janakiraman & Brun, 1999). Transmission electron microscopy was performed as per Toh et al. (Toh et al., 2008).
Cell length quantification
Three independent cultures were grown of each strain and 10 phase contrast images were taken of cells from each culture for a total of 30 images of each strain. Cell lengths were determined using the Microbetracker software package (Sliusarenko et al., 2011). The alg1_interp.set cell detection parameters included in the software were used for cell detection. Incorrectly identified cells were removed manually. Cell lengths from all 30 images of each strain were combined. At least 550 cells from each strain were used in the analysis, with most strains having provided over 1000 cells.
Swarm assay
Strains were grown overnight in PYE, diluted to an OD600 of 0.1, and allowed to grow for two doublings (to OD600 of ~0.4). All strains were diluted to OD600 = 0.05 (quantified on a Thermo Nanodrop 2000 (Thermo Scientific)) and 1 μl of culture was injected into a 0.3% Agar PYE plate. Plates were incubated 5 days in a humid container.
Short term adhesion assay
This assay was based upon Hardy et al. (Hardy et al., 2010). Overnight exponential phase PYE cultures were diluted to OD600 = 0.03 and 0.5 ml of culture was placed in the well of a 24-well culture dish in triplicate (as well as a media-only control). Plates were incubated without shaking for 2 h at 30°C. Supernatant was removed. Each well was washed three times with 0.5 ml PYE. 0.5 ml 0.1% crystal violet was added to each well and incubated 20 min. Crystal violet was removed and the plate was washed by dunking in a tub of water three times. Bound crystal violet was eluted with 0.5 ml 10% acetic acid and the A589 of this solution was measured.
The average A589 of the media only controls was subtracted from the A589 of each culture-containing well. Then the A589 of each well was divided by the average A589 for wild type wells and multiplied by 100 to normalize each well to a percentage of wild-type adhesion. The average percent wild-type adhesion was calculated for each strain. The assay was performed three times and the average and standard deviation for each strain was calculated using the average percent wild-type adhesion from the triplicate assays.
Growth curve
For B. subvibrioides growth curves, three independent cultures of each strain were grown overnight in PYE medium (supplemented with kanamycin where necessary), diluted 1:1 and grown for 1 h, then diluted to an OD600 = 0.015 in 20 ml PYE medium without antibiotic. Samples were removed every hour for 24 h for OD600 measurement. The average and standard deviation for each time point was calculated using the three samples from each strain.
Supplementary Material
Acknowledgments
The authors wish to thank Doug Rusch, Ram Podicheti, James Ford and Aaron Buechlein of the Indiana University Center for Genomics and Bioinformatics for the assistance in library construction, sequencing and data analysis. The authors also wish to thank Ellen Quardokus for helping with the TEM images, Clay Fuqua for helpful advice and discussion of A. tumefaciens physiology and mutagenesis, Steve Brewer for his assistance in statistical analyses, Pamela Brown and David Kysela for providing the phylogenetic tree, and the Brun laboratory for critical reading of the manuscript. This work was supported by National Institutes of Health Grant GM051986 and National Science Foundation Grant MCB0731950 to YVB.
References
- Baba T, Ara T, Hasegawa M, Takai Y, Okumura Y, Baba M, Datsenko KA, Tomita M, Wanner BL, Mori H. Construction of Escherichia coli K-12 in-frame, single-gene knockout mutants: the Keio collection. Molecular systems biology. 2006;2 doi: 10.1038/msb4100050. 2006 0008. [DOI] [PMC free article] [PubMed] [Google Scholar]
- Barnett MJ, Hung DY, Reisenauer A, Shapiro L, Long SR. A homolog of the CtrA cell cycle regulator is present and essential in Sinorhizobium meliloti. J Bacteriol. 2001;183:3204–3210. doi: 10.1128/JB.183.10.3204-3210.2001. [DOI] [PMC free article] [PubMed] [Google Scholar]
- Bellefontaine AF, Pierreux CE, Mertens P, Vandenhaute J, Letesson JJ, De Bolle X. Plasticity of a transcriptional regulation network among alpha-proteobacteria is supported by the identification of CtrA targets in Brucella abortus. Mol Microbiol. 2002;43:945–960. doi: 10.1046/j.1365-2958.2002.02777.x. [DOI] [PubMed] [Google Scholar]
- Bernhardt TG, de Boer PA. SlmA, a nucleoid-associated, FtsZ binding protein required for blocking septal ring assembly over chromosomes in E. coli. Mol Cell. 2005;18:555–564. doi: 10.1016/j.molcel.2005.04.012. [DOI] [PMC free article] [PubMed] [Google Scholar]
- Biondi EG, Reisinger SJ, Skerker JM, Arif M, Perchuk BS, Ryan KR, Laub MT. Regulation of the bacterial cell cycle by an integrated genetic circuit. Nature. 2006a;444:899–904. doi: 10.1038/nature05321. [DOI] [PubMed] [Google Scholar]
- Biondi EG, Skerker JM, Arif M, Prasol MS, Perchuk BS, Laub MT. A phosphorelay system controls stalk biogenesis during cell cycle progression in Caulobacter crescentus. Mol Microbiol. 2006b;59:386–401. doi: 10.1111/j.1365-2958.2005.04970.x. [DOI] [PubMed] [Google Scholar]
- Bird TH, MacKrell A. A CtrA homolog affects swarming motility and encystment in Rhodospirillum centenum. Arch Microbiol. 2011;193:451–459. doi: 10.1007/s00203-011-0676-y. [DOI] [PubMed] [Google Scholar]
- Brassinga AK, Siam R, McSween W, Winkler H, Wood D, Marczynski GT. Conserved response regulator CtrA and IHF binding sites in the alpha-proteobacteria Caulobacter crescentus and Rickettsia prowazekii chromosomal replication origins. J Bacteriol. 2002;184:5789–5799. doi: 10.1128/JB.184.20.5789-5799.2002. [DOI] [PMC free article] [PubMed] [Google Scholar]
- Brilli M, Fondi M, Fani R, Mengoni A, Ferri L, Bazzicalupo M, Biondi EG. The diversity and evolution of cell cycle regulation in alpha-proteobacteria: a comparative genomic analysis. BMC Syst Biol. 2010;4:52. doi: 10.1186/1752-0509-4-52. [DOI] [PMC free article] [PubMed] [Google Scholar]
- Brown PJ, de Pedro MA, Kysela DT, Van der Henst C, Kim J, De Bolle X, Fuqua C, Brun YV. Polar growth in the Alphaproteobacterial order Rhizobiales. Proceedings of the National Academy of Sciences of the United States of America. 2012;109:1697–1701. doi: 10.1073/pnas.1114476109. [DOI] [PMC free article] [PubMed] [Google Scholar]
- Chen YE, Tsokos CG, Biondi EG, Perchuk BS, Laub MT. Dynamics of two Phosphorelays controlling cell cycle progression in Caulobacter crescentus. J Bacteriol. 2009;191:7417–7429. doi: 10.1128/JB.00992-09. [DOI] [PMC free article] [PubMed] [Google Scholar]
- Christen B, Abeliuk E, Collier JM, Kalogeraki VS, Passarelli B, Coller JA, Fero MJ, McAdams HH, Shapiro L. The essential genome of a bacterium. Molecular systems biology. 2011;7:528. doi: 10.1038/msb.2011.58. [DOI] [PMC free article] [PubMed] [Google Scholar]
- Collier J, McAdams HH, Shapiro L. A DNA methylation ratchet governs progression through a bacterial cell cycle. Proc Natl Acad Sci U S A. 2007;104:17111–17116. doi: 10.1073/pnas.0708112104. [DOI] [PMC free article] [PubMed] [Google Scholar]
- Curtis NA, Eisenstadt RL, Turner KA, White AJ. Inhibition of penicillin-binding protein 3 of Escherichia coli K-12. Effects upon growth, viability and outer membrane barrier function. The Journal of antimicrobial chemotherapy. 1985;16:287–296. doi: 10.1093/jac/16.3.287. [DOI] [PubMed] [Google Scholar]
- Curtis PD, Brun YV. Getting in the loop: regulation of development in Caulobacter crescentus. Microbiol Mol Biol Rev. 2010;74:13–41. doi: 10.1128/MMBR.00040-09. [DOI] [PMC free article] [PubMed] [Google Scholar]
- Curtis PD, Klein D, Brun YV. Effect of a ctrA promoter mutation, causing a reduction in CtrA abundance, on the cell cycle and development of Caulobacter crescentus. BMC microbiology. 2013;13:166. doi: 10.1186/1471-2180-13-166. [DOI] [PMC free article] [PubMed] [Google Scholar]
- Curtis PD, Quardokus EM, Lawler ML, Guo X, Klein D, Chen JC, Arnold RJ, Brun YV. The scaffolding and signalling functions of a localization factor impact polar development. Mol Microbiol. 2012;84:712–735. doi: 10.1111/j.1365-2958.2012.08055.x. [DOI] [PMC free article] [PubMed] [Google Scholar]
- de Boer PA, Crossley RE, Rothfield LI. A division inhibitor and a topological specificity factor coded for by the minicell locus determine proper placement of the division septum in E. coli. Cell. 1989;56:641–649. doi: 10.1016/0092-8674(89)90586-2. [DOI] [PubMed] [Google Scholar]
- de Leeuw E, Graham B, Phillips GJ, ten Hagen-Jongman CM, Oudega B, Luirink J. Molecular characterization of Escherichia coli FtsE and FtsX. Mol Microbiol. 1999;31:983–993. doi: 10.1046/j.1365-2958.1999.01245.x. [DOI] [PubMed] [Google Scholar]
- Deich J, Judd EM, McAdams HH, Moerner WE. Visualization of the movement of single histidine kinase molecules in live Caulobacter cells. Proc Natl Acad Sci U S A. 2004;101:15921–15926. doi: 10.1073/pnas.0404200101. [DOI] [PMC free article] [PubMed] [Google Scholar]
- Derouaux A, Wolf B, Fraipont C, Breukink E, Nguyen-Disteche M, Terrak M. The monofunctional glycosyltransferase of Escherichia coli localizes to the cell division site and interacts with penicillin-binding protein 3, FtsW, and FtsN. J Bacteriol. 2008;190:1831–1834. doi: 10.1128/JB.01377-07. [DOI] [PMC free article] [PubMed] [Google Scholar]
- Doublet P, van Heijenoort J, Mengin-Lecreulx D. Identification of the Escherichia coli murI gene, which is required for the biosynthesis of D-glutamic acid, a specific component of bacterial peptidoglycan. J Bacteriol. 1992;174:5772–5779. doi: 10.1128/jb.174.18.5772-5779.1992. [DOI] [PMC free article] [PubMed] [Google Scholar]
- Edgar RC. MUSCLE: multiple sequence alignment with high accuracy and high throughput. Nucleic Acids Res. 2004;32:1792–1797. doi: 10.1093/nar/gkh340. [DOI] [PMC free article] [PubMed] [Google Scholar]
- Edwards DH, Errington J. The Bacillus subtilis DivIVA protein targets to the division septum and controls the site specificity of cell division. Mol Microbiol. 1997;24:905–915. doi: 10.1046/j.1365-2958.1997.3811764.x. [DOI] [PubMed] [Google Scholar]
- Fioravanti A, Fumeaux C, Mohapatra SS, Bompard C, Brilli M, Frandi A, Castric V, Villeret V, Viollier PH, Biondi EG. DNA Binding of the Cell Cycle Transcriptional Regulator GcrA Depends on N6-Adenosine Methylation in Caulobacter crescentus and Other Alphaproteobacteria. PLOS Genet. 2013;9 doi: 10.1371/journal.pgen.1003541. [DOI] [PMC free article] [PubMed] [Google Scholar]
- French CT, Lao P, Loraine AE, Matthews BT, Yu H, Dybvig K. Large-scale transposon mutagenesis of Mycoplasma pulmonis. Mol Microbiol. 2008;69:67–76. doi: 10.1111/j.1365-2958.2008.06262.x. [DOI] [PMC free article] [PubMed] [Google Scholar]
- Gallagher LA, Ramage E, Jacobs MA, Kaul R, Brittnacher M, Manoil C. A comprehensive transposon mutant library of Francisella novicida, a bioweapon surrogate. Proc Natl Acad Sci U S A. 2007;104:1009–1014. doi: 10.1073/pnas.0606713104. [DOI] [PMC free article] [PubMed] [Google Scholar]
- Gil R, Silva FJ, Pereto J, Moya A. Determination of the core of a minimal bacterial gene set. Microbiol Mol Biol Rev. 2004;68:518–537. doi: 10.1128/MMBR.68.3.518-537.2004. table of contents. [DOI] [PMC free article] [PubMed] [Google Scholar]
- Glass JI, Assad-Garcia N, Alperovich N, Yooseph S, Lewis MR, Maruf M, Hutchison CA, 3rd, Smith HO, Venter JC. Essential genes of a minimal bacterium. Proc Natl Acad Sci U S A. 2006;103:425–430. doi: 10.1073/pnas.0510013103. [DOI] [PMC free article] [PubMed] [Google Scholar]
- Goley ED, Yeh YC, Hong SH, Fero MJ, Abeliuk E, McAdams HH, Shapiro L. Assembly of the Caulobacter cell division machine. Mol Microbiol. 2011;80:1680–1698. doi: 10.1111/j.1365-2958.2011.07677.x. [DOI] [PMC free article] [PubMed] [Google Scholar]
- Gonzalez D, Collier J. DNA methylation by CcrM activates the transcription of two genes required for the division of Caulobacter crescentus. Mol Microbiol. 2013;88:203–218. doi: 10.1111/mmi.12180. [DOI] [PMC free article] [PubMed] [Google Scholar]
- Gonzalez D, Kozdon JB, McAdams HH, Shapiro L, Collier J. The functions of DNA methylation by CcrM in Caulobacter crescentus: a global approach. Nucleic Acids Res. 2014 doi: 10.1093/nar/gkt1352. [DOI] [PMC free article] [PubMed] [Google Scholar]
- Goodner B, Hinkle G, Gattung S, Miller N, Blanchard M, Qurollo B, Goldman BS, Cao Y, Askenazi M, Halling C, Mullin L, Houmiel K, Gordon J, Vaudin M, Iartchouk O, Epp A, Liu F, Wollam C, Allinger M, Doughty D, Scott C, Lappas C, Markelz B, Flanagan C, Crowell C, Gurson J, Lomo C, Sear C, Strub G, Cielo C, Slater S. Genome sequence of the plant pathogen and biotechnology agent Agrobacterium tumefaciens C58. Science. 2001;294:2323–2328. doi: 10.1126/science.1066803. [DOI] [PubMed] [Google Scholar]
- Gora KG, Cantin A, Wohlever M, Joshi KK, Perchuk BS, Chien P, Laub MT. Regulated proteolysis of a transcription factor complex is critical to cell cycle progression in Caulobacter crescentus. Mol Microbiol. 2013;87:1277–1289. doi: 10.1111/mmi.12166. [DOI] [PMC free article] [PubMed] [Google Scholar]
- Gora KG, Tsokos CG, Chen YE, Srinavasan BS, Perchuk BS, Laub MT. A cell-type-specific protein-protein interaction modulates transcriptional activity of a master regulator in Caulobacter crescentus. Mol Cell. 2010 doi: 10.1016/j.molcel.2010.06.024. [DOI] [PMC free article] [PubMed] [Google Scholar]
- Greene SE, Brilli M, Biondi EG, Komeili A. Analysis of the CtrA pathway in Magnetospirillum reveals an ancestral role in motility in alphaproteobacteria. J Bacteriol. 2012;194:2973–2986. doi: 10.1128/JB.00170-12. [DOI] [PMC free article] [PubMed] [Google Scholar]
- Hallez R, Mignolet J, Van Mullem V, Wery M, Vandenhaute J, Letesson JJ, Jacobs-Wagner C, De Bolle X. The asymmetric distribution of the essential histidine kinase PdhS indicates a differentiation event in Brucella abortus. EMBO J. 2007;26:1444–1455. doi: 10.1038/sj.emboj.7601577. [DOI] [PMC free article] [PubMed] [Google Scholar]
- Hardy GG, Allen RC, Toh E, Long M, Brown PJ, Cole-Tobian JL, Brun YV. A localized multimeric anchor attaches the Caulobacter holdfast to the cell pole. Mol Microbiol. 2010;76:409–427. doi: 10.1111/j.1365-2958.2010.07106.x. [DOI] [PMC free article] [PubMed] [Google Scholar]
- Hecht GB, Lane T, Ohta N, Sommer JM, Newton A. An essential single domain response regulator required for normal cell division and differentiation in Caulobacter crescentus. EMBO J. 1995;14:3915–3924. doi: 10.1002/j.1460-2075.1995.tb00063.x. [DOI] [PMC free article] [PubMed] [Google Scholar]
- Hinz AJ, Larson DE, Smith CS, Brun YV. The Caulobacter crescentus polar organelle development protein PodJ is differentially localized and is required for polar targeting of the PleC development regulator. Mol Microbiol. 2003;47:929–941. doi: 10.1046/j.1365-2958.2003.03349.x. [DOI] [PubMed] [Google Scholar]
- Hiraga S, Niki H, Ogura T, Ichinose C, Mori H, Ezaki B, Jaffe A. Chromosome partitioning in Escherichia coli: novel mutants producing anucleate cells. J Bacteriol. 1989;171:1496–1505. doi: 10.1128/jb.171.3.1496-1505.1989. [DOI] [PMC free article] [PubMed] [Google Scholar]
- Holtzendorff J, Hung D, Brende P, Reisenauer A, Viollier PH, McAdams HH, Shapiro L. Oscillating global regulators control the genetic circuit driving a bacterial cell cycle. Science. 2004;304:983–987. doi: 10.1126/science.1095191. [DOI] [PubMed] [Google Scholar]
- Hottes AK, Meewan M, Yang D, Arana N, Romero P, McAdams HH, Stephens C. Transcriptional profiling of Caulobacter crescentus during growth on complex and minimal media. J Bacteriol. 2004;186:1448–1461. doi: 10.1128/JB.186.5.1448-1461.2004. [DOI] [PMC free article] [PubMed] [Google Scholar]
- Hottes AK, Shapiro L, McAdams HH. DnaA coordinates replication initiation and cell cycle transcription in Caulobacter crescentus. Mol Microbiol. 2005;58:1340–1353. doi: 10.1111/j.1365-2958.2005.04912.x. [DOI] [PubMed] [Google Scholar]
- Iniesta AA, McGrath PT, Reisenauer A, McAdams HH, Shapiro L. A phospho-signaling pathway controls the localization and activity of a protease complex critical for bacterial cell cycle progression. Proc Natl Acad Sci U S A. 2006;103:10935–10940. doi: 10.1073/pnas.0604554103. [DOI] [PMC free article] [PubMed] [Google Scholar]
- Iniesta AA, Shapiro L. A bacterial control circuit integrates polar localization and proteolysis of key regulatory proteins with a phospho-signaling cascade. Proc Natl Acad Sci U S A. 2008;105:16602–16607. doi: 10.1073/pnas.0808807105. [DOI] [PMC free article] [PubMed] [Google Scholar]
- Jacobs C, Ausmees N, Cordwell SJ, Shapiro L, Laub MT. Functions of the CckA histidine kinase in Caulobacter cell cycle control. Mol Microbiol. 2003;47:1279–1290. doi: 10.1046/j.1365-2958.2003.03379.x. [DOI] [PubMed] [Google Scholar]
- Jacobs C, I, Domian J, Maddock JR, Shapiro L. Cell cycle-dependent polar localization of an essential bacterial histidine kinase that controls DNA replication and cell division. Cell. 1999;97:111–120. doi: 10.1016/s0092-8674(00)80719-9. [DOI] [PubMed] [Google Scholar]
- Jacobs C, Hung D, Shapiro L. Dynamic localization of a cytoplasmic signal transduction response regulator controls morphogenesis during the Caulobacter cell cycle. Proc Natl Acad Sci U S A. 2001;98:4095–4100. doi: 10.1073/pnas.051609998. [DOI] [PMC free article] [PubMed] [Google Scholar]
- Janakiraman RS, Brun YV. Cell cycle control of a holdfast attachment gene in Caulobacter crescentus. J Bacteriol. 1999;181:1118–1125. doi: 10.1128/jb.181.4.1118-1125.1999. [DOI] [PMC free article] [PubMed] [Google Scholar]
- Kahng LS, Shapiro L. The CcrM DNA methyltransferase of Agrobacterium tumefaciens is essential, and its activity is cell cycle regulated. J Bacteriol. 2001;183:3065–3075. doi: 10.1128/JB.183.10.3065-3075.2001. [DOI] [PMC free article] [PubMed] [Google Scholar]
- Kelly AJ, Sackett MJ, Din N, Quardokus E, Brun YV. Cell cycle-dependent transcriptional and proteolytic regulation of FtsZ in Caulobacter. Genes Dev. 1998;12:880–893. doi: 10.1101/gad.12.6.880. [DOI] [PMC free article] [PubMed] [Google Scholar]
- Kim J, Heindl JE, Fuqua C. Coordination of division and development influences complex multicellular behavior in Agrobacterium tumefaciens. PloS one. 2013;8:e56682. doi: 10.1371/journal.pone.0056682. [DOI] [PMC free article] [PubMed] [Google Scholar]
- Kozdon JB, Melfi MD, Luong K, Clark TA, Boitano M, Wang S, Zhou B, Gonzalez D, Collier J, Turner SW, Korlach J, Shapiro L, McAdams HH. Global methylation state at base-pair resolution of the Caulobacter genome throughout the cell cycle. Proc Natl Acad Sci U S A. 2013 doi: 10.1073/pnas.1319315110. [DOI] [PMC free article] [PubMed] [Google Scholar]
- Kuru E, Hughes HV, Brown PJ, Hall E, Tekkam S, Cava F, de Pedro MA, Brun YV, VanNieuwenhze MS. In Situ probing of newly synthesized peptidoglycan in live bacteria with fluorescent D-amino acids. Angewandte Chemie. 2012;51:12519–12523. doi: 10.1002/anie.201206749. [DOI] [PMC free article] [PubMed] [Google Scholar]
- Lam H, Schofield WB, Jacobs-Wagner C. A landmark protein essential for establishing and perpetuating the polarity of a bacterial cell. Cell. 2006;124:1011–1023. doi: 10.1016/j.cell.2005.12.040. [DOI] [PubMed] [Google Scholar]
- Lang AS, Beatty JT. Genetic analysis of a bacterial genetic exchange element: the gene transfer agent of Rhodobacter capsulatus. Proc Natl Acad Sci U S A. 2000;97:859–864. doi: 10.1073/pnas.97.2.859. [DOI] [PMC free article] [PubMed] [Google Scholar]
- Langridge GC, Phan MD, Turner DJ, Perkins TT, Parts L, Haase J, Charles I, Maskell DJ, Peters SE, Dougan G, Wain J, Parkhill J, Turner AK. Simultaneous assay of every Salmonella Typhi gene using one million transposon mutants. Genome research. 2009;19:2308–2316. doi: 10.1101/gr.097097.109. [DOI] [PMC free article] [PubMed] [Google Scholar]
- Laub MT, Chen SL, Shapiro L, McAdams HH. Genes directly controlled by CtrA, a master regulator of the Caulobacter cell cycle. Proc Natl Acad Sci U S A. 2002;99:4632–4637. doi: 10.1073/pnas.062065699. [DOI] [PMC free article] [PubMed] [Google Scholar]
- Li H, Durbin R. Fast and accurate short read alignment with Burrows-Wheeler transform. Bioinformatics. 2009;25:1754–1760. doi: 10.1093/bioinformatics/btp324. [DOI] [PMC free article] [PubMed] [Google Scholar]
- Li H, Durbin R. Fast and accurate long-read alignment with Burrows-Wheeler transform. Bioinformatics. 2010;26:589–595. doi: 10.1093/bioinformatics/btp698. [DOI] [PMC free article] [PubMed] [Google Scholar]
- Lutkenhaus J, Pichoff S, Du S. Bacterial cytokinesis: From Z ring to divisome. Cytoskeleton. 2012;69:778–790. doi: 10.1002/cm.21054. [DOI] [PMC free article] [PubMed] [Google Scholar]
- Malakooti J, Ely B. Principal sigma subunit of the Caulobacter crescentus RNA polymerase. J Bacteriol. 1995;177:6854–6860. doi: 10.1128/jb.177.23.6854-6860.1995. [DOI] [PMC free article] [PubMed] [Google Scholar]
- Malakooti J, Wang SP, Ely B. A consensus promoter sequence for Caulobacter crescentus genes involved in biosynthetic and housekeeping functions. J Bacteriol. 1995;177:4372–4376. doi: 10.1128/jb.177.15.4372-4376.1995. [DOI] [PMC free article] [PubMed] [Google Scholar]
- Matroule JY, Lam H, Burnette DT, Jacobs-Wagner C. Cytokinesis monitoring during development; rapid pole-to-pole shuttling of a signaling protein by localized kinase and phosphatase in Caulobacter. Cell. 2004;118:579–590. doi: 10.1016/j.cell.2004.08.019. [DOI] [PubMed] [Google Scholar]
- Murray SM, Panis G, Fumeaux C, Viollier PH, Howard M. Computational and genetic reduction of a cell cycle to its simplest, primordial components. PLoS Biol. 2013;11:e1001749. doi: 10.1371/journal.pbio.1001749. [DOI] [PMC free article] [PubMed] [Google Scholar]
- Ogura T, Bouloc P, Niki H, D'Ari R, Hiraga S, Jaffe A. Penicillin-binding protein 2 is essential in wild-type Escherichia coli but not in lov or cya mutants. J Bacteriol. 1989;171:3025–3030. doi: 10.1128/jb.171.6.3025-3030.1989. [DOI] [PMC free article] [PubMed] [Google Scholar]
- Ohta N, Lane T, Ninfa EG, Sommer JM, Newton A. A histidine protein kinase homologue required for regulation of bacterial cell division and differentiation. Proc Natl Acad Sci U S A. 1992;89:10297–10301. doi: 10.1073/pnas.89.21.10297. [DOI] [PMC free article] [PubMed] [Google Scholar]
- Pierce DL, O'Donnol DS, Allen RC, Javens JW, Quardokus EM, Brun YV. Mutations in DivL and CckA rescue a divJ null mutant of Caulobacter crescentus by reducing the activity of CtrA. J Bacteriol. 2006;188:2473–2482. doi: 10.1128/JB.188.7.2473-2482.2006. [DOI] [PMC free article] [PubMed] [Google Scholar]
- Poindexter JS. Biological properties and classification of the Caulobacter group. Bacteriol Rev. 1964;28:231–295. doi: 10.1128/br.28.3.231-295.1964. [DOI] [PMC free article] [PubMed] [Google Scholar]
- Quon KC, Marczynski GT, Shapiro L. Cell cycle control by an essential bacterial two-component signal transduction protein. Cell. 1996;84:83–93. doi: 10.1016/s0092-8674(00)80995-2. [DOI] [PubMed] [Google Scholar]
- Radhakrishnan SK, Pritchard S, Viollier PH. Coupling prokaryotic cell fate and division control with a bifunctional and oscillating oxidoreductase homolog. Dev Cell. 2010;18:90–101. doi: 10.1016/j.devcel.2009.10.024. [DOI] [PubMed] [Google Scholar]
- Reisenauer A, Shapiro L. DNA methylation affects the cell cycle transcription of the CtrA global regulator in Caulobacter. EMBO J. 2002;21:4969–4977. doi: 10.1093/emboj/cdf490. [DOI] [PMC free article] [PubMed] [Google Scholar]
- Reisinger SJ, Huntwork S, Viollier PH, Ryan KR. DivL performs critical cell cycle functions in Caulobacter crescentus independent of kinase activity. J Bacteriol. 2007;189:8308–8320. doi: 10.1128/JB.00868-07. [DOI] [PMC free article] [PubMed] [Google Scholar]
- Rico AI, Krupka M, Vicente M. In the beginning, Escherichia coli assembled the proto-ring: an initial phase of division. J Biol Chem. 2013;288:20830–20836. doi: 10.1074/jbc.R113.479519. [DOI] [PMC free article] [PubMed] [Google Scholar]
- Roberts RJ, Vincze T, Posfai J, Macelis D. REBASE--a database for DNA restriction and modification: enzymes, genes and genomes. Nucleic Acids Res. 2010;38:D234–236. doi: 10.1093/nar/gkp874. [DOI] [PMC free article] [PubMed] [Google Scholar]
- Robertson GT, Reisenauer A, Wright R, Jensen RB, Jensen A, Shapiro L, Roop RM., 2nd The Brucella abortus CcrM DNA methyltransferase is essential for viability, and its overexpression attenuates intracellular replication in murine macrophages. J Bacteriol. 2000;182:3482–3489. doi: 10.1128/jb.182.12.3482-3489.2000. [DOI] [PMC free article] [PubMed] [Google Scholar]
- Sciochetti SA, Ohta N, Newton A. The role of polar localization in the function of an essential Caulobacter crescentus tyrosine kinase. Mol Microbiol. 2005;56:1467–1480. doi: 10.1111/j.1365-2958.2005.04652.x. [DOI] [PubMed] [Google Scholar]
- Skerker JM, Shapiro L. Identification and cell cycle control of a novel pilus system in Caulobacter crescentus. EMBO J. 2000;19:3223–3234. doi: 10.1093/emboj/19.13.3223. [DOI] [PMC free article] [PubMed] [Google Scholar]
- Sliusarenko O, Heinritz J, Emonet T, Jacobs-Wagner C. High-throughput, subpixel precision analysis of bacterial morphogenesis and intracellular spatio-temporal dynamics. Mol Microbiol. 2011;80:612–627. doi: 10.1111/j.1365-2958.2011.07579.x. [DOI] [PMC free article] [PubMed] [Google Scholar]
- Stamatakis A. RAxML-VI-HPC: maximum likelihood-based phylogenetic analyses with thousands of taxa and mixed models. Bioinformatics. 2006;22:2688–2690. doi: 10.1093/bioinformatics/btl446. [DOI] [PubMed] [Google Scholar]
- Stephens C, Reisenauer A, Wright R, Shapiro L. A cell cycle-regulated bacterial DNA methyltransferase is essential for viability. Proc Natl Acad Sci U S A. 1996;93:1210–1214. doi: 10.1073/pnas.93.3.1210. [DOI] [PMC free article] [PubMed] [Google Scholar]
- Stephens C, Zweiger G, Shapiro L. Cooridinate cell cycle control of a Caulobacter DNA methyltransferase and the flagellar genetic hierarchy. Journal of Bacteriology. 1995;177:1662–1669. doi: 10.1128/jb.177.7.1662-1669.1995. [DOI] [PMC free article] [PubMed] [Google Scholar]
- Strobel W, A Moll HH, Kiekebusch D, Klein KE, Thanbichler M. Function and localization dynamics of bifunctional penicillin-binding proteins in Caulobacter crescentus. J Bacteriol. 2014 doi: 10.1128/JB.01194-13. [DOI] [PMC free article] [PubMed] [Google Scholar]
- Subramanian K, Paul MR, Tyson JJ. Potential role of a bistable histidine kinase switch in the asymmetric division cycle of Caulobacter crescentus. PLoS computational biology. 2013;9:e1003221. doi: 10.1371/journal.pcbi.1003221. [DOI] [PMC free article] [PubMed] [Google Scholar]
- Tan MH, Kozdon JB, Shen X, Shapiro L, McAdams HH. An essential transcription factor, SciP, enhances robustness of Caulobacter cell cycle regulation. Proc Natl Acad Sci U S A. 2010;107:18985–18990. doi: 10.1073/pnas.1014395107. [DOI] [PMC free article] [PubMed] [Google Scholar]
- Terrana B, Newton A. Pattern of unequal cell division and development in Caulobacter crescentus. Dev Biol. 1975;44:380–385. doi: 10.1016/0012-1606(75)90409-1. [DOI] [PubMed] [Google Scholar]
- Thanbichler M, Shapiro L. MipZ, a spatial regulator coordinating chromosome segregation with cell division in Caulobacter. Cell. 2006;126:147–162. doi: 10.1016/j.cell.2006.05.038. [DOI] [PubMed] [Google Scholar]
- Toh E, Kurtz HD, Jr, Brun YV. Characterization of the Caulobacter crescentus holdfast polysaccharide biosynthesis pathway reveals significant redundancy in the initiating glycosyltransferase and polymerase steps. J Bacteriol. 2008;190:7219–7231. doi: 10.1128/JB.01003-08. [DOI] [PMC free article] [PubMed] [Google Scholar]
- Tsokos CG, Perchuk BS, Laub MT. A Dynamic Complex of Signaling Proteins Uses Polar Localization to Regulate Cell-Fate Asymmetry in Caulobacter crescentus. Developmental cell. 2011;20:329–341. doi: 10.1016/j.devcel.2011.01.007. [DOI] [PMC free article] [PubMed] [Google Scholar]
- Typas A, Banzhaf M, Gross CA, Vollmer W. From the regulation of peptidoglycan synthesis to bacterial growth and morphology. Nat Rev Microbiol. 2012;10:123–136. doi: 10.1038/nrmicro2677. [DOI] [PMC free article] [PubMed] [Google Scholar]
- Viollier PH, Sternheim N, Shapiro L. A dynamically localized histidine kinase controls the asymmetric distribution of polar pili proteins. EMBO J. 2002a;21:4420–4428. doi: 10.1093/emboj/cdf454. [DOI] [PMC free article] [PubMed] [Google Scholar]
- Viollier PH, Sternheim N, Shapiro L. Identification of a localization factor for the polar positioning of bacterial structural and regulatory proteins. Proc Natl Acad Sci U S A. 2002b;99:13831–13836. doi: 10.1073/pnas.182411999. [DOI] [PMC free article] [PubMed] [Google Scholar]
- Wheeler RT, Shapiro L. Differential localization of two histidine kinases controlling bacterial cell differentiation. Mol Cell. 1999;4:683–694. doi: 10.1016/s1097-2765(00)80379-2. [DOI] [PubMed] [Google Scholar]
- Wood DW, Setubal JC, Kaul R, Monks DE, Kitajima JP, Okura VK, Zhou Y, Chen L, Wood GE, Almeida NF, Jr, Woo L, Chen Y, Paulsen IT, Eisen JA, Karp PD, Bovee D, Sr, Chapman P, Clendenning J, Deatherage G, Gillet W, Grant C, Kutyavin T, Levy R, Li MJ, McClelland E, Palmieri A, Raymond C, Rouse G, Saenphimmachak C, Wu Z, Romero P, Gordon D, Zhang S, Yoo H, Tao Y, Biddle P, Jung M, Krespan W, Perry M, Gordon-Kamm B, Liao L, Kim S, Hendrick C, Zhao ZY, Dolan M, Chumley F, Tingey SV, Tomb JF, Gordon MP, Olson MV, Nester EW. The genome of the natural genetic engineer Agrobacterium tumefaciens C58. Science. 2001;294:2317–2323. doi: 10.1126/science.1066804. [DOI] [PubMed] [Google Scholar]
- Wright R, Stephens C, Shapiro L. The CcrM DNA methyltransferase is widespread in the alpha subdivision of proteobacteria, and its essential functions are conserved in Rhizobium meliloti and Caulobacter crescentus. J Bacteriol. 1997;179:5869–5877. doi: 10.1128/jb.179.18.5869-5877.1997. [DOI] [PMC free article] [PubMed] [Google Scholar]
- Wu J, Ohta N, Zhao JL, Newton A. A novel bacterial tyrosine kinase essential for cell division and differentiation. Proc Natl Acad Sci U S A. 1999;96:13068–13073. doi: 10.1073/pnas.96.23.13068. [DOI] [PMC free article] [PubMed] [Google Scholar]
- Wu LJ, Errington J. Nucleoid occlusion and bacterial cell division. Nat Rev Microbiol. 2012;10:8–12. doi: 10.1038/nrmicro2671. [DOI] [PubMed] [Google Scholar]
- Yakhnina AA, Gitai Z. Diverse functions for six glycosyltransferases in Caulobacter crescentus cell wall assembly. J Bacteriol. 2013;195:4527–4535. doi: 10.1128/JB.00600-13. [DOI] [PMC free article] [PubMed] [Google Scholar]
- Zweiger G, Marczynski G, Shapiro L. A Caulobacter DNA methyltransferase that functions only in the predivisional cell. J Mol Biol. 1994;235:472–485. doi: 10.1006/jmbi.1994.1007. [DOI] [PubMed] [Google Scholar]
- Zweiger G, Shapiro L. Expression of Caulobacter dnaA as a function of the cell cycle. J Bacteriol. 1994;176:401–408. doi: 10.1128/jb.176.2.401-408.1994. [DOI] [PMC free article] [PubMed] [Google Scholar]
Associated Data
This section collects any data citations, data availability statements, or supplementary materials included in this article.