

Abstract
Objective: This study aimed to investigate the role of microRNA-132 in the epileptogenesis. Methods: Antagomir-132 (Ant-132) was used to silence the expression of miR-132 and non-targeting scrambled sequence (Scr) as a control. Rats were randomly divided into ant-132 group and Scr group in which rats were pretreated with An-132 and Scr, respectively, and then induced temporal lobe epilepsy (TLE) by Li-Pilo. Behavioral observation was done, and results showed the changes in spontaneous recurrent seizures in the chronic phase between two groups. Bax and Bcl-2 were detected aiming to evaluate the neuronal apoptosis. NPY staining was done to investigate the mossy fiber sprouting (MFS). Golgi staining was used to assess the changes in the dendritic morphology. Results: Our study showed that ant-132 induced miR-132 silencing in rats could increase the on-set epilepsy threshold and suppress the numbers of spontaneous recurrent seizures. The number of apoptotic neurons and MFS reduced after miR-132 silencing. In addition, the dendrites of neurons were highly suppressed in the CA3 region of the hippocampus. Conclusions: miR-132 silencing suppresses the spontaneous seizures. The better outcome may result from the neuroprotective effect and the inhibition of MFs-CA3 pathway following miR-132 silencing. Thus, miR-132 may serve as a potential target for the development of anti-epileptic drugs.
Keywords: Temporal lobe epilepsy, microRNA-132, antagomirs, mossy fber sprouting
Introduction
Temporal lobe epilepsy (TLE), accompanied by hippocampal sclerosis and mossy fber sprouting (MFS), is a common form of focal epilepsy in humans [1,2]. It is characterized by recurrent spontaneous seizures and associated with abnormal formation of excitatory circuits, including dendrites, axons, and synaptic connections [3].
MicroRNAs (miRNA), endogenously highly conserved and non-coding single strand RNAs with about 22 nucleotides, are able to regulate the gene expression at the post-transcriptional level [4,5]. Change in the abundance of miRNAs has been found in TLE patients [6], and several of them are involved in the formation and development of dendrites, axons and synaptic plasticity [7,8] and can partly regulate the occurrence of spontaneous seizures [9]. The expression of mir-132, an activity-dependent RNA, has been found to increase in the pyramidal cells and granule cells as the neurons become mature [10]. Following physiological and pathophysiological stimulation, miR-132 in the sensory neurons has been addressed in the regulation of synaptic plasticity via modulating the dendritic growth and spinogenesis in cultured hippocampal neurons by targeting p250GAP [11-14]. In addition, miR-132 was also found to be involved in the negative regulation of cognitive memory [15-17] and the decreased miR-132 expression could extenuate the seizure induced neuronal death [18] in vivo.
miR-132 is regulated by the CAMP response element binding protein (CREB), which binds to the CRE region of a gene and then promotes the transcription and translation of the gene when the ser133 of CREB is phosphorylated [19]. p-CREB promotes the formation of new synapses and affects the physiological function (such as long-term synaptic potentiation) of neurons by regulating protein synthesis [19], increasing Na+ conductance and decreasing K+ conductance to increase the neural excitation [20]. In addition, CREB is a downstream protein of ERK1/2 signal pathway which is related to MFS [19,21,22], a common epileptic pathophysiology involved in the formation of abnormal excitatory loops in TLE [23]. Studies have shown that transgenic rat constitutively over-expressing the active form of CREB for more than 3-4 weeks occasionally shows spontaneous seizures [24], but the decreased expression of CREB suppresses the onset of epilepsy [25].
Our previous experiment revealed that the expressions of p-CREB and miR-132 were up-regulated in the acute phase of li-pilo TLE, but the miR-132 expression was down-regulated in the chronic phase, especially in TLE patients (date not shown). We concluded that the decreased expression of miR-132 in the chronic phase is a protective factor. On the basis of previous findings, we hypothesized that the p-CREB/miR-132 signal pathway participates in the pathophysiological process of TLE. This study was undertaken to investigate the role of miR-132 in the epilepsy and explore the consequence of miR-132 silencing in vivo.
Methods
Intracerebroventricular injection
Rats were randomly divided into ant-132 group and SCR group. After intraperitoneal anesthesia with 10% chloral hydrate, rats were placed in a rat-adapted stereotaxic instrument. A midline incision was made at the head, the bregma was located, and three partial craniectomies were performed for the placement of skull-mounted recording screws. A fourth craniectomy was done for the placement of a guide cannula (coordinates from the bregma: anterior-posterior [AP] = -1.1 mm, lateral (L) = -1.5 mm, ventral (V) = -4.5 mm) based on a stereotaxic atlas. Rats received a either Ant-132 or Scr in double distilled water (5 µl/nmol). Rats were housed for 2 days, and then subjected to preparation of LI-PILO TLE animal model.
TLE models
The lithium-pilocarpine (Li-Pilo) rat model has been widely used to simulate human TLE [26]. Adult male Sprague–Dawley rats (12 weeks old) weighing 180-220 g were purchased from the Experimental Animal Center of Chongqing Medical University, China. Rats were housed under controlled environmental conditions (temperature: 26°C; humidity: 50–60%, 12 h / 12 h light-dark cycle) and given ad libitum accessed to standard food and water. The animal experiments were approved by the Ethical Commission of Chongqing Medical University and in accordance with international standards.
Lithium chloride (127 mg/kg, i.p., Sigma, USA) and atropina (1 mg/kg, i.p.) were injected at 20 h and 30 min prior to the administration of pilocarpine (35 mg/kg, i.p., Sigma, USA), respectively. Rats then received repeated injections of pilocarpine (10 mg/kg, i.p.) every 10 min until they developed seizures of stage 4 (Racine, 1972). In control group, rats were injected with equal volume of normal saline instead of pilocarpine. After epileptic seizure of stage 4 and stage 5 determined according to the Racine’s scale (Racine, 1972), rats were maintained in the state of seizure for 1 h, and then injected with diazepam (10 mg/kg, i.p.) and atropina (1 mg/kg, i.p.) to terminate seizures. Rats exhibiting epileptic seizures of under stage 4 were excluded.
Analysis of spontaneous seizures by continuous video monitoring
After inducing the temporal epilepsy, 5 rats per group were randomly selected at 4 weeks after SE induction, and then received monitoring of behaviors for 5 days. Cameras connected to H.264 hard disk video were placed at 40 cm from the cages in a room. Videos from 5 d of continuous monitoring during week 4-5 after status epilepticus were reviewed by an observer blind to study. Seizures were counted using a modified six-point Racine scale for rats [9]. Clinical events with score below 2 were not included.
Tissue processing
For RT-PCR and western blot assay, rats were sacrificed by decapitation after intraperitoneal administration of 3.5 mg/kg hydrated chloral (1 ml/kg i.p.). Two slices of the hippocampus were obtained, and then stored in liquid nitrogen. For immunohistochemistry, rats were anesthetized and perfused with normal saline followed by 4.0% paraformaldehyde. Brain tissues were immediately fixed in 4% paraformaldehyde for 24 h, embedded in paraffin and sectioned (5–μm) for immunohistochemistry.
Golgi Cox staining
We used Hito Golgi-Cox OptimStain Kit (Hitobiotec Inc.) for visualization of the dendritic branching pattern and dendritic spines. Brain tissues were prepared according the vibratome protocol before vibratome sectioning into 100 μm coronal sections.
Dendritic branching length and dendritic spines density analysis
Neurites of neurons were traced and quantified by using the NEURONJ program that allows semiautomatic tracings of neurites. Neurites were traced and quantified in a blinded manner. Measurements were done at the CA1 and CA3 areas of the dorsal hippocampus. About 4 fragments per brain were analyzed from each hippocampal subregion. First, 24 bits color photographs were taken with a Leica DFC 480 camera mounted on a Leica DM5000B microscope with the maximal resolution of 4080 × 3072 pixels. A 20 × objective giving good dendritic branching resolution was used. Pixels on the resulting image represent area with a size of 1 μm × 1 μm.
Immunohistochemistry
After paraffinization and dehydration, tissues were incubated in H2O2 (3%, 20 min) to block the endogenous peroxide, and then antigen retrieval was done in a microwave oven for 4 min at 92-98°C in 10 mmol/L sodium citrate buffer (pH 6.0). Non-specific binding was blocked by incubating these sections with 10% goat serum (Zhongshan Golden Bridge Inc., Beijing, China) at 37°C for 30 min. Then, sections were incubated with primary antibody against bax, bcl-2 or NPY (Zhongshan Golden Bridge Inc., Beijing, China) for 2 h at 4°C and then for1 h at 37°C, These sections were treated with anti-rabbit secondary antibody for 25 min at 37°C, and then with ABC solution (Zhongshan Golden Bridge Inc., Beijing, China) at 37°C for 25 min. Immunoreactivity was visualized with DAB (Zhongshan Golden Bridge, Inc., Beijing, China). The LEICA DM6000B automatic microscope (Leica, Germany) was used to collect images. Ten fields were randomly selected for each sample and analyzed automatically and semi-quantitatively using the Image-Pro Plus 6.0 image analysis system. The level of MFS was analyzed by NPY staining: 1. normal; 2. distinction between IML/OML horizontal fibers visible but increased radial fiber networks in GCL and IML; 3. loss of boundary between IML/OML and increased radial fibers in GCL and IML; 4. above with increased fiber plexus in hilar region in addition.
Western blot assay
Total proteins were extracted from the brain tissues using the whole protein extraction kit (Keygen Biotech, Nanjing, China). Protein concentration was determined with the Enhanced BCA Protein Assay Kit (Beyotime, Haimen, China). Proteins (50-100 μg per lane) were separated by SDS-PAGE (5% stacking gel, 60 V, 30 min; 10% separating gel, 100 V, 60 min), and then electrotransferred onto polyvinylidene fluoride (PVDF) membranes at 250 mA for 60 min. PVDF membranes were incubated at 37°C for 60 min in 5% skim milk to block non-specific binding, and then with primary antibody against bax or bcl-2 or rabbit anti-rat β-actin polyclonal antibody (1:1000, Santa Cruz, USA) at 4°C overnight. After washing with Tween-20-Tris-buffered saline (TTBS) 4 times (10 min for each), membranes were incubated with a horseradish peroxidase-conjugated secondary antibody (rabbit anti-goat IgG-HRP, 1:4000,) for 60 min at 37°C and washed with TTBS 4 times (10 min per time). The protein bands were visualized with an enhanced chemiluminescence substrate (Pierce, USA) and scanned (Bio-Rad Laboratories). The optical density (OD) of these bands was quantified using the Quantity One software (Bio-Rad Laboratories). The mean OD of p-CREB relative to β-actin was determined.
RNA isolation and reverse transcription
Total RNA was extracted from the brain tissues using RNAiso plus (TaKaRa, Dalian, China) according to the manufacturer’s instructions. The concentration and purity of RNA were measured at 260 (A260) and 280 (A280) nm. RNA samples were used for reverse transcription (RT) reaction when the A260/A280 was between 1.90 and 2.20. In brief, 1 μg of total RNA was added into 10 μl of RT system using the SYBR® PrimeScript™ miRNA RT-PCR Kit (TaKaRa, Dalian, China). The RT reaction was done under the following conditions: (1) 37°C for 60 min; (2) 85°C for 5 s. For each RT reaction, a blank control was prepared using all the reagents, but the RNA was replaced with an equivalent volume of water. Each reaction mixture was diluted to 100 μl for real-time PCR.
SYBR-Green quantitative real-time PCR
Real-time PCR was done on BIO-RED CFX96. SYBR® Premix Ex Taq™ II (TaKaRa, Dalian, China), Uni-miR qPCR Primer (TaKaRa, Dalian, China) and miR-132 specific primer (F 5’-GCCGCTAACAGTCTACAGCCAT-3’) (Genscript, China) were used. PCR mixture contained 10 μl of SYBR® Premix Ex Taq™ II, 0.5 μl of 10 μM Uni-miR qPCR primer, 0.5 μl of miR-132 specific primer, 1 μl of RT reaction solution and 8 μl of ddH2O. Real-time PCR was done under the following conditions: stage 1, 95°C for 30 s; stage 2, a total of 40 cycles of 95°C for 5 s and 60°C for 20 s; stage 3, dissociation. Standard curves of miR-132 and β-actin were delineated to assure the efficiencies of amplification between 90% and 110%. After PCR, the amplification and melting curves were checked, and data were analyzed with Bio-Rad CFX Manager and represented as mean 2-ΔΔCT ± standard deviation (SD). U6b was used for normalization.
Data analysis
Data are expressed as means ± SD. Student’s t-test (SPSS 17) was used for statistical analysis of data between Ant-132 group and Scr groups. Data among groups were compared with one-way ANOVA followed by turkey’s HSD post hoc multiple comparison test (Graph-Pad Prism 5). A value of P < 0.05 was considered statistically significant.
Results
Depletion of miR-132 using antagomirs in vivo
To explore the function of miR-132 in vivo, rats were intraventricularly (i.c.v.) injected with antagomirs targeting miR-132 (Ant-132) in Ant-132 group, and with a non-targeting scrambled sequence (Scr) in control (Scr) group. Rats in two groups were induced SE subsequently. Rats were injected with Ant-132 or Scr (i.c.v.) at different concentration and then the miRNA levels of the hippocampus was measured at 24 h after SE induction aiming to identify an appropriate Ant-132 concentration for miR-132 depletion. Results showed miR-132 was not completely silenced after injection of 0.5 nmol Ant-132, but absent after injection of 1.0 and 1.5 nmol Ant-132 (P < 0.05) when compared with Scr group. Moreover, the silencing efficiency in 1.0 nmol group was comparable to that in 1.5 nmol group (Figure 1A). Thus, 1 nmol Ant-132 was used in following experiments. In addition, the specificity of miR-132 silencing with Ant-132 was also determined. Results showed that, an unrelated miRNA, miR-134, was not silenced after injection of Ant-132 (Figure 1B).
Figure 1.
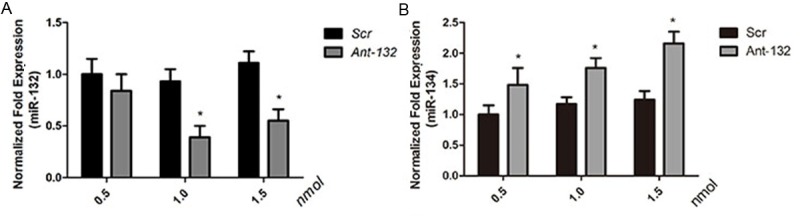
Mir-132 and miR-134 expression in rat hippocampus 24 h after SE induction. A. Showed the normalized expression of miR-132 (black column: Scr group; gray column: Ant-132 group); B. Showed the normalized expression of miR-134 (black column: Scr group; gray column: Ant-132 group). U6 was used as a reference gene. *P < 0.05.
Silencing of miR-132 extends the latency to SE
The latency (time from the pilocarpine injection to SE) was determined in different groups. In control group, rats were intraventricularly injected with double distilled water. Results showed the latency after injection of Ant-132 at different concentrations was significantly longer than that in control group, and the higher the Ant-132 concentration, the longer the latency was. After injection of 1.5 nmol Ant-132, two of five rats developed SE finally (Figure 2).
Figure 2.
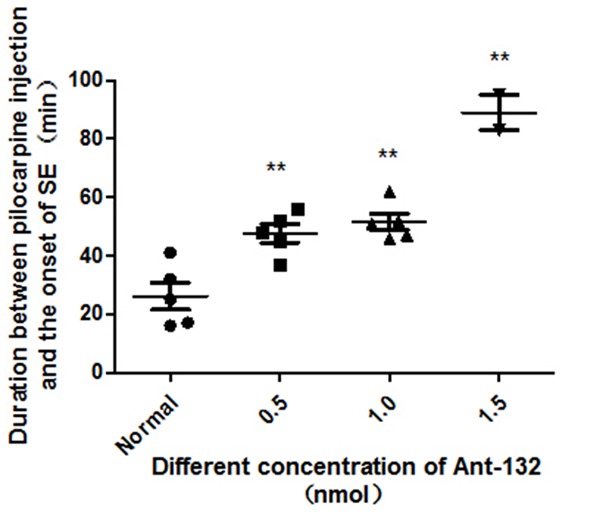
Latency to SE among different groups. **P < 0.01 vs control group.
MiR-132 silencing reduces spontaneous recurrent seizures
The recurrent spontaneous seizures were recorded in the epileptic chronic phase according to the video record within 5 days. The median number of epileptic seizures in Scr group was 57, and a total of 285 epileptic seizures were observed in Scr group. In contrast, only 60% of rats in Ant-132 group developed spontaneous seizures in the chronic phase. Ant-132-injected rat had a median number of epileptic seizure was 8, and a total of 40 epileptic seizures were recorded in 5 rats (P < 0.001, vs. Scr group by t test). The duration of individual epileptic seizure was similar between groups. (Figure 3).
Figure 3.
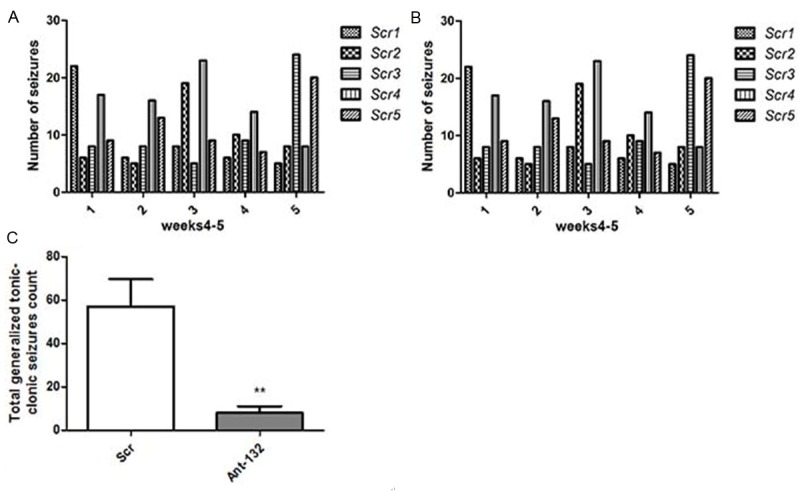
Number of recurrent spontaneous seizures in the epileptic chronic phase. A: Number of spontaneous recurrent seizures in Ant-132 group; B: The number of spontaneous recurrent seizures in Scr group; C: Mean number of epileptic seizures in two groups. **P < 0.01 vs control group.
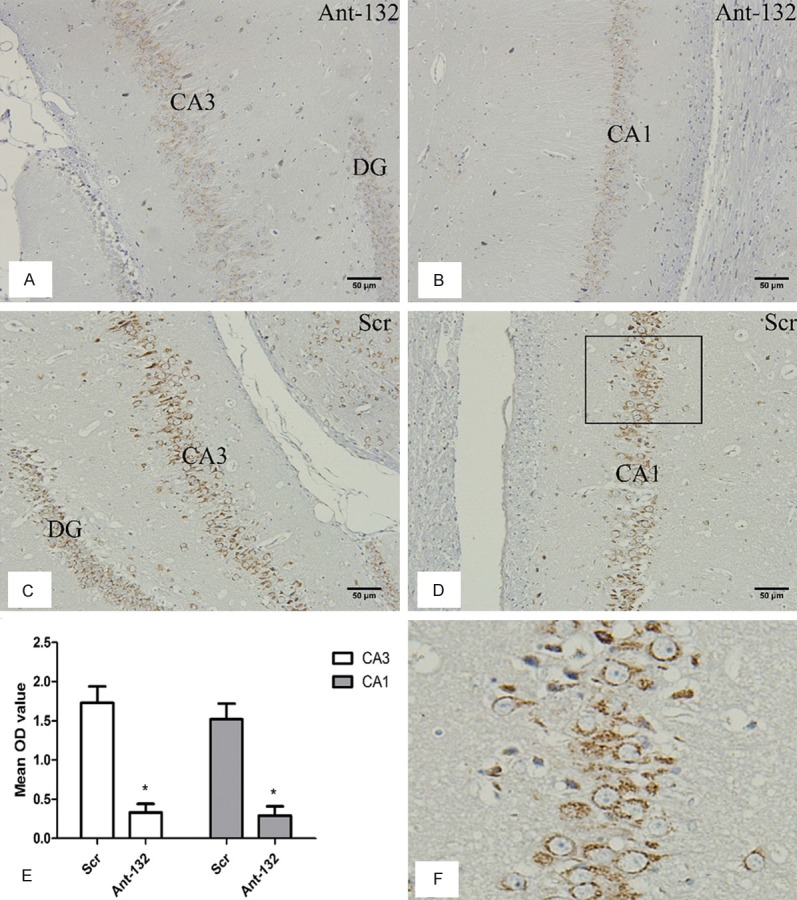
Bax expression was down-regulated by miR-132 silencing
At 14 d after SE induction, the bax expression was detected in Ant-132 group and Scr group by immunohistochemistry. As shown in Figure 4, bax was expressed in the cytoplasm of neurons of hippocampus (CA1 and CA3 regions). Results showed the bax expression after SE induction was significantly higher in Scr-injected rats than in control group, but was dramatically inhibited in Ant-132 group (P < 0.05 vs. Scr group).
Figure 4.
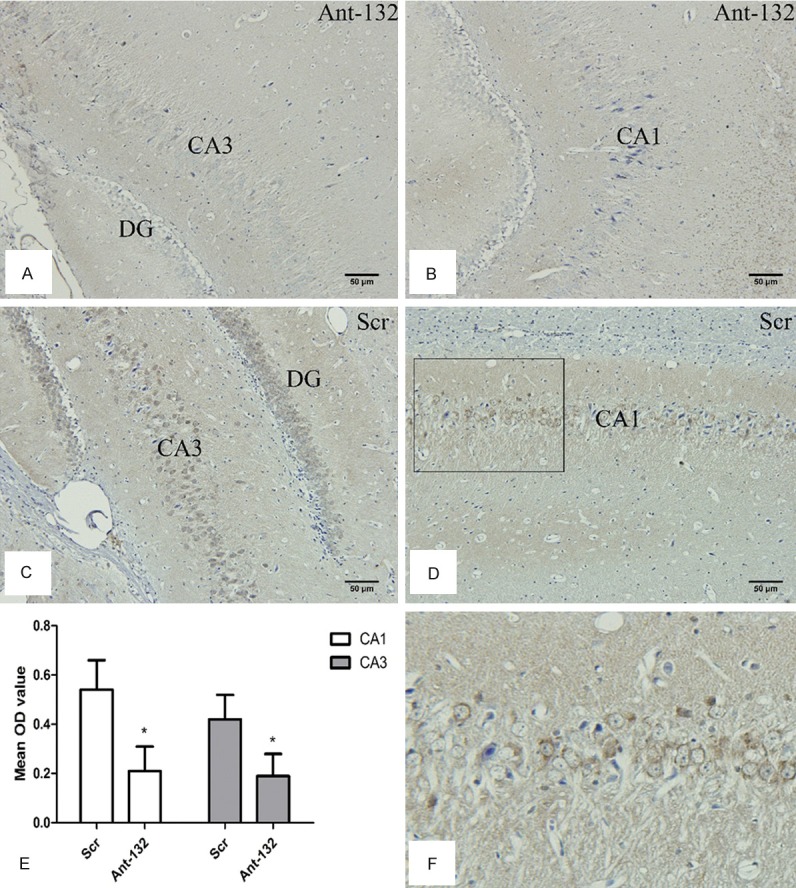
Bax expression at 14 days after SE induction. A and B: Bax expression in Ant-132 group. C and D: Bax expression in Scr group. DG, CA3 and CA1 indicated the subfield of the rat hippocampus. Bax expression was found in the cytoplasm of neurons. Scale bar: 50 μm. E: Mean OD value of Bax expression (white column: CA1 region; gray column: CA3 region). F: Enlarged part for the selected region in D, and bax expression was found in the cytoplasm of neurons. *P < 0.05.
Bcl-2 expression was down-regulated by miR-132 silencing
At 14 d after SE induction, the bcl-2 expression was detected in Ant-132-injected and Scr-injected rats by immunohistochemistry. As shown in Figure 5, bcl-2 was expressed in the cytoplasm of neurons of hippocampus (CA1 and CA3 regions). The bcl-2 expression after induced SE was significantly higher in Scr group than in control group, but was markedly down-regulated in Ant-132 group (P < 0.05 vs. Scr group).
Figure 5.
Bcl-2 expression at 14 days after SE induction. A and B: Bcl-2 expression in Ant-132 group. C and D: Bax expression in Scr group. DG, CA3 and CA1 indicated the subfield of the rat hippocampus. Bcl-2 expression was found in the cytoplasm of neurons. Scale bar: 50 μm. E: Mean OD of bcl-2 expression in the subfields of hippocampus (white column: CA3 region, gray column: CA1 region). F: Enlarged part of the selected region in D, and Bcl-2 expression was observed in the cytoplasm of neurons. *P < 0.05.
MFS was decreased by miR-132 silencing
Neuropeptide Y (NPY) is an index of increased reorganization of the hippocampus, and NPY expression is also associated with MFS (Figure 6A). NPY staining was performed to evaluate the hippocampal sclerosis and MFS. As shown in Figure 6B, the fiber plexus increased in the hilar region of Scr group. Figure 6C showed the NPY scores of two groups. NPY scores in Ant-132-injected rats were significantly lower (P < 0.05) than that in Scr-injected rats.
Figure 6.
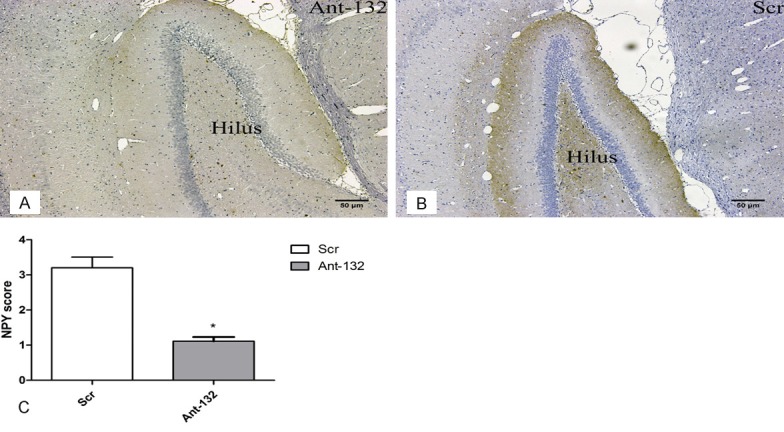
NPY staining of the hippocampus at 30 days after SE induction. A: NPY staining in Ant-132 group; B: NPY staining in Scr group. NPY positive cells were found in the hilus region of Scr group. Scale bar: 50 μm. C: NPY score of two groups (white column: Scr group; gray column: Ant-132 group). *P < 0.05.
Dendritic morphology in the hippocampus by Golgi staining
Hito Golgi-Cox OptimStain Kit (Hitobiotec Inc.) was used for visualization of the dendritic branching pattern in Ant-132 group and Scr group. Three rats per group were selected for visualizing the dendritic branching length. The plain dendritic morphology of neurons in CA3 region was evaluated, and 5 fields were randomized selected to calculate the average length of the dendrites. The dendritic branching length in CA3 and CA1 regions of Ant-132 group was significantly suppressed (P < 0.01) when compared with Scr group. The apical dendritic branches in Ant-132-injected rats were almost invisible (Figure 7).
Figure 7.
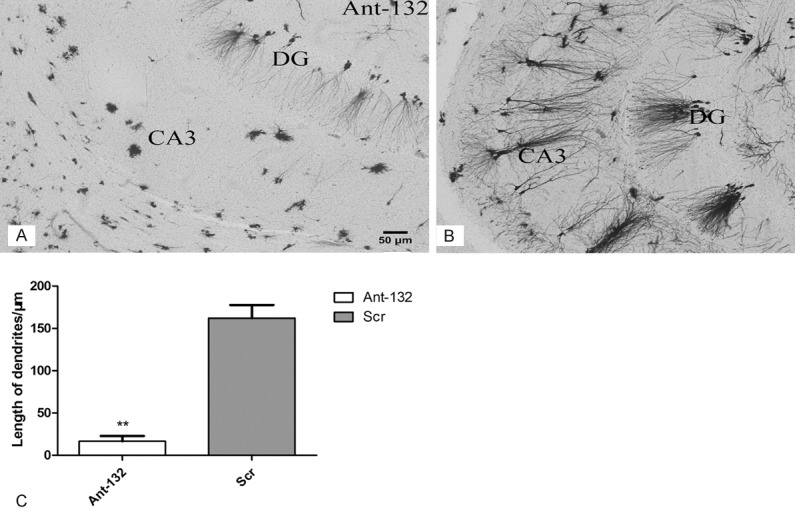
Dendritic morphology of the hippocampus by Golgi staining. A: Morphology of the dendrites in Ant-132 group; B: Morphology of the dendrites in Scr group; C: Mean length of the dendrites in CA3 region. White column: Ant-132 group; gray column: Scr group. **P < 0.01. Scale bar: 50 μm.
Discussion
Our study showed that miR-132 silencing using antago-mirs suppressed the evoked seizures, spontaneous seizures and mossy fiber sprouting, and alleviated the neuronal apoptosis after SE. In addition, there was adjustability of neuronal dendrites in vivo. To our knowledge, it is for the first time to report that inhibition of a single mature miR-132 can alter the pathologic changes in the brain in vivo, and thus miR-132 may become a new therapeutic target for epilepsy.
Neuronal loss and mossy fiber sprouting have been described as main features of TLE and miR-132 depletion can reduce the seizure-induced neuronal death [18]. In the present study, our results showed miR-132 silencing also reduced the neuronal apoptosis. Of importance, miR-132 silencing after SE resulted in significant reduction in the recurrent spontaneous seizures when compared with Scr-injected rats. Epilepsy was frequently present in Scr-injected rats, whereas spontaneous seizures seldom occurred in Ant-132-injected rats. Then, we investigated the mechanism underlying the reduction in spontaneous seizures. The suppression of neuronal loss and neuronal apoptosis may be closely associated with reduction in spontaneous seizures. In addition, NPY staining [27] also demonstrated that mossy fiber spouting reduced in Ant-132-injected rats. Golgi staining was performed to investigate the dendritic morphology. Of interest, results showed the dendrites were almost suppressed completely by Ant-132 in vivo in the CA3 and CA1 regions when compared with Scr group.
As we known, the CA3 and CA1 regions and granular layer have mossy fiber sprouting, and the over-discharge during epilepsy relied on the connections between local circuit neurons. So the dendrite of the neuron in CA3 and CA1 degenerate underlined reduce the mossy fiber sprouting and the occurrence of spontaneous seizures. There is also a hypothesis that CA3 circuit participates in the pathogenesis of epilepsy [28].
There were two theories explaining the spontaneous epileptic seizures. One is synaptic reorganization of the mossy fiber sprouting. Mossy fibers of the dentate gyrus granule cells normally emit the axons to the neurons of CA3 and hilar region of the hippocampus. When the neuronal loss or apoptosis is present in CA3 region, the mossy fibers of granule cells lose normal connections with CA3 neurons, otherwise develop collaterals into an abnormal location such as inner molecular layer subfields (IML), and form circulation circuit among granule cells in the dentate gyrus [29]. There is still controversy on whether the abnormal mossy fiber sprouting contributes to the spontaneous epileptic seizures. Mossy fiber sprouting might be related to the spontaneous epileptic seizures. However, a study showed there is no relationship between mossy fiber sprouting and spontaneous epileptic seizures [30]. The other theory is feed forward inhibition in the CA3 region. In the CA3 region, mossy fibers from the dentate gyrus granule cells form synapses both with CA3 pyramidal neurons and local circuit interneurons. These two different synapse types ensure the exquisite control of pyramidal cell discharge. The activation of interneurons occurs as in the inhibitory neurons to suppress the activation of pyramidal neurons. At the center of seizure focus in the hippocampus, mossy fibers connected to interneurons reduce, while the excitatory connections to pyramidal cells remain largely intact. This remodeling of MF axons in the CA3 region may lead to excessive activation of pyramidal cells and increase the predisposition to epilepsy [28]. Thus, we speculated that the inhibition of recurrent spontaneous seizures in our study was attributed to the suppression of mossy fiber connections to CA3 pyramidal neurons. Ant-132 significantly reduced thsse dendritic length of the hippocampal CA3 and CA1 regions in vivo. A key target of miR-132 is p250GAP, which regulates the dendritic length and spine density in vitro [13]. In addition, miR-132 has multiple downstream targets. Whether miR-132 reduces the dendrites in vivo also through the miR132/p250GAP pathway is still unclear and requires to be further studied. p250GAP, a downstream factor of miR-132, may be the signal molecule related to the increased hippocampal excitability. However, other miR-132 targets with effects on the excitability and seizure suppression are unknown, and we can not exclude the involvement of these targets in the effects on dendritic morphology.
On the basis of behavioral observation, the spontaneous seizures reduced significantly after administration of miR-132 antagomirs. We postulated that miR-132 could be used as a potential target for the development of anti-epileptic drugs. However, we will face two major problems: first, we need to know if the dendritic reduction can affect the cognitive function; second, miR-132 has multiple downstream targets, and the exact function of most of these targets is unclear. Thus, more studies are required to reveal the role of miR-132 signal pathway in the epileptogenesis.
Acknowledgements
The study was supported by National Natural Science Foundation of China (No.81171225).
Disclosure of conflict of interest
None.
References
- 1.Sutula T, Cascino G, Cavazos J, Parada I, Ramirez L. Mossy fiber synaptic reorganization in the epileptic human temporal lobe. Ann Neurol. 1989;26:321–330. doi: 10.1002/ana.410260303. [DOI] [PubMed] [Google Scholar]
- 2.Babb TL, Kupfer WR, Pretorius JK, Crandall PH, Levesque MF. Synaptic reorganization by mossy fibers in human epileptic fascia dentata. Neuroscience. 1991;42:351–363. doi: 10.1016/0306-4522(91)90380-7. [DOI] [PubMed] [Google Scholar]
- 3.Gardiner J, Marc J. Disruption of normal cytoskeletal dynamics may play a key role in the pathogenesis of epilepsy. Neuroscientist. 2010;16:28–39. doi: 10.1177/1073858409334422. [DOI] [PubMed] [Google Scholar]
- 4.Ambros V. The functions of animal microRNAs. Nature. 2004;431:6. doi: 10.1038/nature02871. [DOI] [PubMed] [Google Scholar]
- 5.Bartel DP. MicroRNAs: genomics, biogenesis, mechanism, and function. Cell. 2004;116:281–297. doi: 10.1016/s0092-8674(04)00045-5. [DOI] [PubMed] [Google Scholar]
- 6.Kan A. Profiling cytokines in temporal lobe epilepsy. 2012 [Google Scholar]
- 7.Song YJ, Tian XB, Zhang S, Zhang YX, Li X, Li D, Cheng Y, Zhang JN, Kang CS, Zhao W. Temporal lobe epilepsy induces differential expression of hippocampal miRNAs including let-7e and miR-23a/b. Brain Res. 2011;1387:134–140. doi: 10.1016/j.brainres.2011.02.073. [DOI] [PubMed] [Google Scholar]
- 8.Barbato C, Giorgi C, Catalanotto C, Cogoni C. Thinking about RNA? MicroRNAs in the brain. Mamm Genome. 2008;19:541–551. doi: 10.1007/s00335-008-9129-6. [DOI] [PubMed] [Google Scholar]
- 9.Jimenez-Mateos EM, Engel T, Merino-Serrais P, McKiernan RC, Tanaka K, Mouri G, Sano T, O’Tuathaigh C, Waddington JL, Prenter S, Delanty N, Farrell MA, O’Brien DF, Conroy RM, Stallings RL, DeFelipe J, Henshall DC. Silencing microRNA-134 produces neuroprotective and prolonged seizure-suppressive effects. Nat Med. 2012;18:1087–1094. doi: 10.1038/nm.2834. [DOI] [PMC free article] [PubMed] [Google Scholar]
- 10.Luikart BW, Bensen AL, Washburn EK, Perederiy JV, Su KG, Li Y, Kernie SG, Parada LF, Westbrook GL. miR-132 mediates the integration of newborn neurons into the adult dentate gyrus. PLoS One. 2011;6:e19077. doi: 10.1371/journal.pone.0019077. [DOI] [PMC free article] [PubMed] [Google Scholar]
- 11.Impey S, Davare M, Lesiak A, Fortin D, Ando H, Varlamova O, Obrietan K, Soderling TR, Goodman RH, Wayman GA. An activity-induced microRNA controls dendritic spine formation by regulating Rac1-PAK signaling. Mol Cell Neurosci. 2010;43:146–156. doi: 10.1016/j.mcn.2009.10.005. [DOI] [PMC free article] [PubMed] [Google Scholar]
- 12.Nudelman AS, DiRocco DP, Lambert TJ, Garelick MG, Le J, Nathanson NM, Storm DR. Neuronal activity rapidly induces transcription of the CREB-regulated microRNA-132, in vivo. Hippocampus. 2010;20:492–498. doi: 10.1002/hipo.20646. [DOI] [PMC free article] [PubMed] [Google Scholar]
- 13.Wayman GA, Davare M, Ando H, Fortin D, Varlamova O, Cheng HY, Marks D, Obrietan K, Soderling TR, Goodman RH, Impey S. An activity-regulated microRNA controls dendritic plasticity by down-regulating p250GAP. Proc Natl Acad Sci U S A. 2008;105:9093–9098. doi: 10.1073/pnas.0803072105. [DOI] [PMC free article] [PubMed] [Google Scholar]
- 14.Vo N, Klein ME, Varlamova O, Keller DM, Yamamoto T, Goodman RH, Impey S. A cAMP-response element binding protein-induced microRNA regulates neuronal morphogenesis. Proc Natl Acad Sci U S A. 2005;102:16426–16431. doi: 10.1073/pnas.0508448102. [DOI] [PMC free article] [PubMed] [Google Scholar]
- 15.Hansen KF, Sakamoto K, Wayman GA, Impey S, Obrietan K. Transgenic miR132 alters neuronal spine density and impairs novel object recognition memory. PLoS One. 2010;5:e15497. doi: 10.1371/journal.pone.0015497. [DOI] [PMC free article] [PubMed] [Google Scholar]
- 16.Scott HL, Tamagnini F, Narduzzo KE, Howarth JL, Lee YB, Wong LF, Brown MW, Warburton EC, Bashir ZI, Uney JB. MicroRNA-132 regulates recognition memory and synaptic plasticity in the perirhinal cortex. Eur J Neurosci. 2012;36:2941–2948. doi: 10.1111/j.1460-9568.2012.08220.x. [DOI] [PMC free article] [PubMed] [Google Scholar]
- 17.Shaltiel G, Hanan M, Wolf Y, Barbash S, Kovalev E, Shoham S, Soreq H. Hippocampal microRNA-132 mediates stress-inducible cognitive deficits through its acetylcholinesterase target. Brain Struct Funct. 2013;218:59–72. doi: 10.1007/s00429-011-0376-z. [DOI] [PMC free article] [PubMed] [Google Scholar]
- 18.Jimenez-Mateos EM, Bray I, Sanz-Rodriguez A, Engel T, McKiernan RC, Mouri G, Tanaka K, Sano T, Saugstad JA, Simon RP, Stallings RL, Henshall DC. miRNA Expression profile after status epilepticus and hippocampal neuroprotection by targeting miR-132. Am J Pathol. 2011;179:2519–2532. doi: 10.1016/j.ajpath.2011.07.036. [DOI] [PMC free article] [PubMed] [Google Scholar]
- 19.Wu H, Zhou Y, Xiong ZQ. Transducer of regulated CREB and late phase long-term synaptic potentiation. FEBS J. 2007;274:3218–3223. doi: 10.1111/j.1742-4658.2007.05891.x. [DOI] [PubMed] [Google Scholar]
- 20.Benito E, Barco A. CREB’s control of intrinsic and synaptic plasticity: implications for CREB-dependent memory models. Trends Neurosci. 2010;33:230–240. doi: 10.1016/j.tins.2010.02.001. [DOI] [PubMed] [Google Scholar]
- 21.Xu ZC, Chen YM, Xu P, Liu H, Xie YL, Zeng KB. Epileptiform discharge upregulates p-ERK1/2, growth-associated protein 43 and synaptophysin in cultured rat hippocampal neurons. Seizure. 2009;18:680–685. doi: 10.1016/j.seizure.2009.09.004. [DOI] [PubMed] [Google Scholar]
- 22.Hu B, Liu C, Bramlett H, Sick TJ, Alonso OF, Chen S, Dietrich WD. Changes in trkB-ERK1/2-CREB/Elk-1 pathways in hippocampal mossy fiber organization after traumatic brain injury. J Cereb Blood Flow Metab. 2004;24:934–943. doi: 10.1097/01.WCB.0000125888.56462.A1. [DOI] [PubMed] [Google Scholar]
- 23.Thomas AM, Corona-Morales AA, Ferraguti F, Capogna M. Sprouting of mossy fibers and presynaptic inhibition by group II metabotropic glutamate receptors in pilocarpine-treated rat hippocampal slice cultures. Neuroscience. 2005;131:303–320. doi: 10.1016/j.neuroscience.2004.11.002. [DOI] [PubMed] [Google Scholar]
- 24.Lopez de Armentia M, Jancic D, Olivares R, Alarcon JM, Kandel ER, Barco A. cAMP response element-binding protein-mediated gene expression increases the intrinsic excitability of CA1 pyramidal neurons. J Neurosci. 2007;27:13909–13918. doi: 10.1523/JNEUROSCI.3850-07.2007. [DOI] [PMC free article] [PubMed] [Google Scholar]
- 25.Zhu X, Han X, Blendy JA, Porter BE. Decreased CREB levels suppress epilepsy. Neurobiol Dis. 2012;45:253–263. doi: 10.1016/j.nbd.2011.08.009. [DOI] [PMC free article] [PubMed] [Google Scholar]
- 26.Majores M, Schoch S, Lie A, Becker AJ. Molecular neuropathology of temporal lobe epilepsy: complementary approaches in animal models and human disease tissue. Epilepsia. 2007;48(Suppl 2):4–12. doi: 10.1111/j.1528-1167.2007.01062.x. [DOI] [PubMed] [Google Scholar]
- 27.Lurton D, Cavalheiro EA. Neuropeptide-Y immunoreactivity in the pilocarpine model of temporal lobe epilepsy. Exp Brain Res. 1997;116:186–190. doi: 10.1007/pl00005739. [DOI] [PubMed] [Google Scholar]
- 28.Lawrence JJ, McBain CJ. Interneuron diversity series: containing the detonation--feedforward inhibition in the CA3 hippocampus. Trends Neurosci. 2003;26:631–640. doi: 10.1016/j.tins.2003.09.007. [DOI] [PubMed] [Google Scholar]
- 29.Dudek FE, Shao LR. Mossy fiber sprouting and recurrent excitation: direct electrophysiologic evidence and potential implications. Epilepsy Currents. 2004;4:184–187. doi: 10.1111/j.1535-7597.2004.04507.x. [DOI] [PMC free article] [PubMed] [Google Scholar]
- 30.Longo BM, Mello LE. Blockade of pilocarpine- or kainate-induced mossy fiber sprouting by cycloheximide does not prevent subsequent epileptogenesis in rats. Neurosci Lett. 1997;226:163–166. doi: 10.1016/s0304-3940(97)00267-x. [DOI] [PubMed] [Google Scholar]