

Abstract
Background: The relationship between diabetic nephropathy, visceral adipose tissue (VAT), and inflammation has been shown. The neutrophil-to-lymphocyte ratio (NLR) and platelet-to-lymphocyte ratio (PLR) are simple, inexpensive, and useful markers to determine inflammation. However, to date, in the literature, there have been no studies demonstrating the relationship between epicardial adipose tissue (EAT), inflammation, and albuminuria. Aims: We aimed to investigate the association between diabetic nephropathy, NLR, and PLR as inflammatory markers and EAT thickness. Methods: This was a cross-sectional study involving 200 diabetic patients. The patients were separated into three groups according to their albuminuria levels. The NLR and PLR were calculated from a complete blood count. EAT was measured by transthoracic echocardiography. The estimated glomerular filtration rate (eGFR) was calculated by the modification of diet in renal disease (MDRD) equation. Results: Disease duration, EAT, creatinine, NLR, PLR, absolute neutrophil, lymphocyte, and platelet count tended to increase with increasing albuminuria while the eGFR decreased. When patients were separated into two groups according to NLR and PLR medians, albuminuria levels increased with an increase of the NLR (p = 0.003) and PLR (p = 0.009). A correlation analysis showed that albuminuria was significantly correlated with EAT, disease duration, creatinine, eGFR, PLR, and NLR levels. Additionally, in a binary logistic regression analysis, EAT, NLR, and PLR were found to be independently associated with albuminuria. Conclusions: Determining various inflammatory cytokines and measuring abdominal VAT in diabetic patients is complex and expensive. Simply measuring EAT and calculating NLR and PLR can predict inflammation and albuminuria in patients with diabetes.
Keywords: Epicardial adipose tissue, neutrophil-to-lymphocyte ratio, platelet-to-lymphocyte ratio, diabetic nephropathy
Introduction
Patients with diabetes, compared to non-diabetic patients, are at an increased risk for coronary artery disease [1]. The association between micro- and macrovascular disease in diabetes mellitus (DM) and the importance of early detection of microangiopathy for vascular risk assessment in DM has been determined [2]. Moreover; the association between diabetic nephropathy (DN), inflammation, and coronary artery disease has been defined [3-7].
DN is the leading cause of end-stage renal failure worldwide [8]. It is a chronic disease that contributes to patient morbidity and mortality, and increases nations’ health care costs. The pathogenesis of DN is still not fully elucidated, and induction of inflammation and oxidative stress by the metabolism of hyperglycemia and dyslipidemia may play a significant role in developing vascular complications including DN [3-5,9-12].
Many patients with DN have increased serum levels of inflammatory mediators including C-reactive protein (CRP), Interleukin-1 (IL-1), Interleukin-6 (IL-6), Interferon-γ (IF-γ), and Tumor Necrosis Factor-α (TNF-α) [3-5]. The white blood cell (WBC) count and its subtypes are classic markers of inflammation [13-16]. In recent years, the neutrophil-to-lymphocyte ratio (NLR) and platelet-to-lymphocyte ratio (PLR) were introduced as potential markers to determine inflammation in cardiac and non-cardiac disorders [13,14,17-21]. Additionally, an association between NLR and worsening renal function in diabetic patients has been determined [22].
Epicardial adipose tissue (EAT) has been proposed as a novel cardiovascular risk in the general population [23-25] and in end-stage renal disease patients [26-28]. Additionally, it has been demonstrated that EAT acts as an extremely active organ that produces several bioactive adipokines, proinflammatory and proatherogenic cytokines [23,29-34].
However, to date, the data about EAT, the simple inflammatory markers of the NLR and PLR, and their association with DN are scant in the literature. Therefore, we aimed to define the relationship between EAT, the novel inflammatory markers of the NLR and PLR, and the association between DN in type 2 DM patients.
Study population and methods
Patients
This was a cross-sectional study involving 200 type 2 diabetic patients (103 females, 97 males; mean age = 57.28±10.64; known diabetes duration = 93.69±78.74). The study protocol was approved by the Medical Ethics Committee of Erzincan University (School of Medicine, Erzincan, Turkey). Written informed consent was obtained from all subjects included in the study. Patients aged 18-80 years who were willing to participate were screened. A review of their medical records (including information on age, sex, weight, height, disease duration, medications, and history of other diseases) was undertaken. Exclusion criteria were infection, autoimmune disease, and acute diabetic complications.
Two hundred and sixteen patients were evaluated and 16 patients were excluded from the study. Of these 16 patients, 15 patients had an active infection, and one patient had diabetic ketoacidosis. The remaining 200 diabetic patients fulfilled the above criteria and were enrolled in the study. Of these 200 patients, 44 patients were taking insulin and oral antidiabetics, 95 patients were taking only oral antidiabetics, 27 patients were taking only insulin, and 34 patients were not taking any antidiabetic medication.
The systolic blood pressure (SBP) and diastolic blood pressure (DBP) readings were measured using an Erka sphygmomanometer (PMS Instruments Limited, Berkshire, UK) with an appropriate cuff size in the upright sitting position after more than five minutes of rest. Two readings were recorded for each individual and the mean value of the two readings was used for analysis. Patients who were already on antihypertensive treatment (n = 99) or with a SBP and DBP >140 mmHg and 90 mmHg (24 patients not on any antihypertensive treatment), respectively, were assumed to be hypertensive.
Weight and height was measured with the lightest clothing possible and without shoes.
Biochemical analyses, data collection, and procedures
Venous blood samples for biochemical analyses were drawn after at least 10 hours of fasting and before taking any medication. All biochemical analyses were undertaken in the Central Biochemistry Laboratory of the Erzincan University School of Medicine, Mengücek Gazi Training and Research Hospital.
The quantitative urine albumin/creatinine (Cr) ratio in morning spot urine samples were used for standard microalbuminuria determination. Normoalbuminuria was defined as ≤ 30 mg/g Cr and increased albuminuria was defined as >30 mg/g Cr (microalbuminuria: 30-299 mg/g Cr and macroalbuminuria: >300 mg/g Cr). Serum and urine creatinine and albumin were measured with spectrophotometric analysis (Beckman Coulter Inc. kits and LH 2000 analyzer, Lismeehan, O’Callaghan’s Mills, Ireland). Hemoglobin A1c (HbA1c) was measured by high-performance liquid chromatography (Adams A1c HA-8160, Arkray). Estimated glomerular filtration rate (eGFR) was calculated by the modification of diet in renal disease (MDRD) equation.
Definition of PLR and NLR
Complete blood counts with automated differential counts, which included total WBCs, neutrophils, and lymphocytes, were obtained. The NLR and PLR were calculated as the ratio of the neutrophils and platelets to lymphocytes, respectively, with both obtained from the same automated blood sample at the onset of the study.
Definition of EAT
All participants underwent transthoracic echocardiography imaging using an echocardiograph equipped with a broadband transducer (Vivid S4, GE Medical Systems, USA). Echocardiograms were recorded on videotapes. EAT appears as an echo-free space in the pericardial layers on a 2-D echocardiography. EAT thickness was measured on the free wall of the right ventricle at the end-diastole from the parasternal long- and short-axis views by two cardiologists (E.M.B and H.H) blinded to clinical data. Measurements from the parasternal long- and short-axis were averaged.
Statistical analysis
Statistical analyses were carried out using the Statistical Package for Social Sciences for Windows version 15.0 (SPSS, Chicago, IL, USA). Descriptive statistics for each variable were determined. Normally distributed data were expressed as mean ± standard deviation. Median and minimum-maximum values were used for variables without a normal distribution. Data with a normal distribution were compared by Student’s t test and ANOVA test. Comparisons of continuous variables with an asymmetric distribution were made by using the Mann-Whitney U test and Kruskal-Wallis test. Associations between the variables were explored using the Pearson correlation and Spearman’s rho (for data that were not normally distributed). Binary logistic regression analysis was also performed to define variables associated with albuminuria. Receiver-operating characteristic (ROC) analyses was used to compare the performance and prognostic power of the EAT, NLR, and PLR for albuminuria. The predictive validities were quantified as the area under the ROC curves (c statistics), and the comparisons of c statistics were performed by MedCalc statistic software (version 11.3.8.0, Mariakerke, Belgium). A P value less than 0.05 was considered significant.
Results
The baseline characteristics of 200 DM patients enrolled in the study are shown in Table 1. There were no differences with respect to the following variables between normoalbuminuric, microalbuminuric, and macroalbuminuric patients: age, gender, body mass index (BMI), waist circumference, SBP, DBP, HbA1c, and WBC. Disease duration, EAT, creatinine, NLR, PLR absolute neutrophil, lymphocyte, and platelet count tended to increase with increasing albuminuria while eGFR decreased.
Table 1.
Demographic, clinic and laboratory features of the study groups
| Parameters | Normoalbuminuric patients (n = 132) | Microalbuminuric patients (n = 34) | Macroalbuminuric patients (n = 34) | P value |
|---|---|---|---|---|
| Age (years)* | 56.03±10.54 | 60.35±11.40 | 59.03±9.61 | 0.061 |
| Female/Male** | 69/63 | 16/18 | 18/16 | 0.849 |
| BMI (kg/m2)*** | 30.50 (19.50-49.80) | 29.65 (21.40-46.50) | 31.25 (21.10-41.40) | 0.662 |
| Waist Circumference (cm)*** | 104 (75-142) | 102.5 (76-127) | 102 (78-128) | 0.571 |
| EAT (mm)*** | 4.21 (1.76-9.77) | 4.45 (2.00-9.00) | 5.30 (4.44-9.00) | <0.001 |
| Disease Duration (Months)*** | 60 (0-324) | 108 (0-360) | 102 (12-348) | 0.002 |
| SBP (mmHg)*** | 140 (80-220) | 137.5 (100-210) | 130 (90-190) | 0.504 |
| DBP (mmHg)*** | 80 (40-140) | 77.5 (60-90) | 80 (40-110) | 0.233 |
| HbA1c (%)*** | 8.25 (4.10-15.60) | 9.15 (6.00-14.50) | 9.00 (6.20-13.10) | 0.168 |
| eGFR (mL/min)* | 102.69±28.76 | 94.06±29.35 | 64.29±44.26 | <0.001 |
| Albuminuria (mg/g Cr)*** | 9.79 (0.30-27.50) | 74.87 (33.40-293.80) | 716.35 (312.50-1985.00) | <0.001 |
| Creatinine (mg/dL)*** | 0.75 (0.37-1.87) | 0.75 (0.48-1.96) | 1.43 (0.44-3.45) | <0.001 |
| WBC(103/mm3)*** | 7.30 (3.30-13.20) | 7.05 (4.90-11.10) | 7.90 (4.20-11.40) | 0.486 |
| Absolute neutrophil count (103/mm3)*** | 4.22 (1.49-9.11) | 4.27 (1.33-6.83) | 4.58 (2.12-7.76) | 0.041 |
| Absolute lymphocyte count (103/mm3)*** | 2.51 (1.40-5.99) | 2.28 (0.96-4.31) | 2.23 (0.75-3.90) | 0.019 |
| Absolute platelet count (106/mm3)*** | 238 (95-451) | 236 (150-393) | 271 (183-458) | 0.037 |
| NLR*** | 1.56 (0.76-4.14) | 1.96 (0.81-3.71) | 2.03 (0.85-6.91) | 0.001 |
| PLR*** | 95.70 (31.33-181.31) | 115.22 (50.51-276.04) | 118.45 (57.73-361.33) | <0.001 |
Oneway ANOVA Test (mean ± standard deviation),
Chi-Square Test,
Kruskal Wallis Test [median(min-max)].
BMI: Body Mass Index, EAT: Epicardial adipose tissue, SBP: Systolic Blood Pressure, DBP: Diastolic Blood Pressure, eGFR: Estimated Glumerular Filtration Rate, WBC; White Blood Cell, NLR: Neutrophil-to-Lymphocyte Ratio, PLR: Platelet-to-Lymphocyte Ratio.
When the patients were separated into two groups according to the NLR median [group 1; NLR < 1.68 (n = 100) and group 2; NLR ≥ 1.68 (n = 100)], albuminuria [12.88 (0.30-1079.90) vs 19.09 (0.90-1985.00); P = 0.003], and creatinine [0.76 (0.37-3.43) vs 0.85 (0.44-3.45); p = 0.015], the levels increased with an increase of the NLR while the eGFR [102.07±30.96 vs 87.32±37.00; P = 0.003] decreased and other parameters of the patients were not statistically different.
When the patients were separated into two groups according to the PLR median [group 1; PLR < 101.45 (n = 100) and group 2; PLR ≥ 101.45 (n = 100)], albuminuria [12.88 (0.30-1079.90) vs 19.09 (0.90-1985.00); P = 0.009], the levels increased with an increase of the PLR while other parameters of the patients were not statistically different.
The correlation between albuminuria and several other parameters was tested using bivariate correlation analysis. As shown in Table 2, albuminuria was significantly correlated with EAT, disease duration, creatinine, eGFR, PLR, and NLR levels.
Table 2.
Bivariate correlation results between albuminuria and other significant parameters in diabetic patients
| Parameters | rS | P value |
|---|---|---|
| EAT (mm) | 0.318 | <0.001 |
| Disease Duration (Months) | 0.202 | 0.004 |
| Creatinine (mg/dL) | 0.261 | <0.001 |
| eGFR (mL/min) | -0.264 | <0.001 |
| NLR | 0.259 | <0.001 |
| PLR | 0.252 | <0.001 |
EAT: Epicardial adipose tissue, eGFR: Estimated Glumerular Filtration Rate, NLR: Neutrophil-to-Lymphocyte Ratio, PLR: Platelet-to-Lymphocyte Ratio.
Binary logistic regression analysis was also performed to define variables associated with albuminuria (Table 3). Disease duration, BMI, EAT, HbA1c, NLR, PLR, and eGFR levels were included in this model. Disease duration, EAT, HbA1c, NLR, PLR, and eGFR levels were found to be independently associated with albuminuria.
Table 3.
Binary logistic regression of Albuminuria
| Parameters | Odds Ratio | 95% C.I. | P value | |
|---|---|---|---|---|
|
| ||||
| Lower | Upper | |||
| BMI (kg/m2) | 0.956 | 0.896 | 0.183 | 0.183 |
| EAT (mm) | 1.320 | 1.050 | 0.017 | 0.017 |
| Disease Duration (Months) | 1.006 | 1.002 | 0.006 | 0.006 |
| HbA1c (%) | 1.193 | 1.014 | 0.033 | 0.033 |
| NLR | 1.823 | 1.038 | 0.037 | 0.037 |
| PLR | 1.012 | 1.000 | 0.041 | 0.041 |
| eGFR (mL/min) | 0.983 | 0.973 | 0.002 | 0.002 |
BMI: Body Mass Index, EAT: Epicardial adipose tissue, eGFR: Estimated Glumerular Filtration Rate, NLR: Neutrophil-to-Lymphocyte Ratio, PLR: Platelet-to-Lymphocyte Ratio.
The cut-off values of EAT, NLR, and PLR for albuminuria were 4.5 mm with a sensitivity of 70.6% and a specificity of 67.4% (AUC, 0.678; 95% CI, 0.608-0.742; P<0.0001), 1.7 with a sensitivity of 61.8% and a specificity of 70.5% (AUC, 0.660; 95% CI, 0.590-0.725; P = 0.0001), and 135.2 with a sensitivity of 36.8% and a specificity of 91.7% (AUC, 0.654; 95% CI, 0.583-0.719; P = 0.0004), respectively, in the ROC curve analysis (Figure 1). However, AUC comparison of these parameters did not reach statistical significance (P>0.05).
Figure 1.
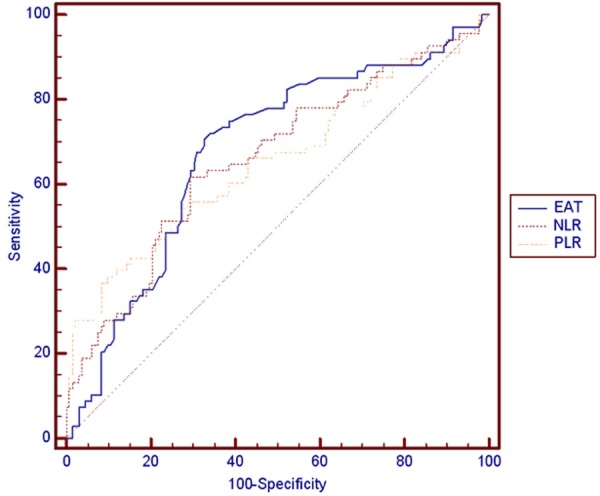
Comparison of receiver-operating characteristics (ROC) analysis of Epicardial adipose tissue (EAT), Neutrophil-to-Lymphocyte (NLR), and Platelet-to-Lymphocyte Ratio (PLR) for predicting albuminuria.
Discussion
There were four main findings of the present study. First, inflammation markers, including the PLR and NLR, were significantly elevated in patients with increased albuminuria. Second, EAT was found to be greater in the albuminuric group compared to the normoalbuminuric group. Third, albuminuria was positively correlated with the PLR, NLR, EAT, and disease duration, and creatinine was negatively correlated with the eGFR. Fourth, the PLR, NLR, and EAT were found to be independent predictors of increased albuminuria with disease duration, HbA1c, and the eGFR in diabetic patients. Finally, we demonstrated threshold values for EAT, the NLR, and the PLR (4.5 mm, 1.7, and 135.2, respectively) to determine high risk for albuminuria.
Developments in recent decades have revealed that inflammation, endothelial dysfunction, and procoagulant imbalance play a significant role in the development of diabetes, insulin resistance, and diabetes-related complications [3-5]. Increased inflammatory markers such as C-reactive protein, IL-1, IL-6, and TNF, and especially interstitial cellular adhesion molecule-1, vascular cellular adhesion molecule-1, and E-selectin are associated with nephropathy, retinopathy, and cardiovascular disease in DM [3-5,9-11]. Although metabolic and hemodynamic factors are the main causes of DN, inflammation and inflammatory molecules are believed to effect glomerular functions by alternations in vascular permeability, vasodilatatory and vasoconstrictor mechanisms, extracellular matrix dynamics, and the proliferation of mesangial, endothelial, and vascular smooth muscle cells, and the induction of cytotoxicity, apoptosis, and necrosis [4,9,11]. The NLR and PLR have emerged as simple, inexpensive and useful markers of inflammation related to various inflammatory, cardiovascular, and neoplastic diseases [13,14,17-20,35]. An association between the WBC and DN and an association between the NLR and worsening renal function in diabetic patients has been determined [22,36-38]. In the present study, we found that albuminuric patients had higher EAT, PLR, and NLR levels than normoalbuminuric patients. Patients with NLR values greater than 1.7 were found to be associated with albuminuria with a higher sensitivity but lower specificity when compared to patients with PLR values greater than 135.2 (61.8% vs 36.8% and 70.5% vs 91.7%, respectively). Moreover, patients with higher NLR and PLR had higher albuminuria; and NLR, PLR were found to be predictors of albuminuria in diabetic patients. This relationship might be attributed to increased inflammation and impaired endothelial dysfunction in this population.
Visceral fat deposition has been recognized as an important risk factor for cardiovascular disease, insulin resistance, and pathogenesis of diabetes. Hence, determining the amount of visceral fat is a helpful and practical tool for clinicians whose aim is to manage patients at high risk for cardiovascular disease [39]. Additionally, studies suggest that increased visceral adipose tissue (VAT), but not subcutaneous fat, is associated with microalbuminuria in patients with diabetes [40,41]. In clinical practice, visceral fat is typically measured by surrogate markers, such as waist circumference or other anthropometric measurements. Direct measurements of visceral fat, including magnetic resonance imaging (MRI), computerized tomography (CT), or dual energy X-ray absorptiometry are more definitive, but the implementation is difficult and expensive for clinical practice. VAT has a strong correlation with EAT [39]. EAT is a metabolically active tissue that produces proatherogenic, proinflammatory bioactive adipokines, including TNF-α, IL-6, resistin, visfatin, omentin, leptin, plasminogen activator inhibitor-1 (PAI-1), and angiotensinogen [23,33,34,42].
In the present study, we found that albuminuric patients had higher levels of EAT. We also demonstrated that diabetic patients with EAT values greater than 4.5 mm were found to be associated with albuminuria with a sensitivity of 70.6% and a specificity of 67.4%. Moreover, EAT was found to be a predictor of albuminuria with disease duration, HbA1c, and eGFR. The authors believe that increased albuminuria at higher EAT levels may be explained with advanced endothelial dysfunction caused by proatherogenic, proinflammatory, and bioactive molecules secreted from epicardial fat tissue. Thus, VAT, inflammation, and EAT are closely related. Additionally, measuring EAT with echocardiography is more sensitive than VAT assessments with anthropometric measurements such as waist circumference, and more practical than CT and MRI. From this perspective, EAT might be a useful tool for evaluating patients with a higher degree of albuminuria and risk determination in normoalbuminuric diabetic patients.
Our study had two main limitations. First, this was a cross-sectional analysis. Second, the sample size was relatively small. This was not a prospective controlled study; therefore, we cannot draw cause-and-effect relationships from our findings.
In conclusion, determining various inflammatory cytokines and measuring abdominal VAT in diabetic patients is extremely complex and expensive. However, simply measuring EAT and calculating the NLR and PLR can predict inflammation in this population. Further randomized and controlled studies evaluating the relationship between EAT, PLR, NLR, and DN are needed.
Disclosure of conflict of interest
None.
References
- 1.Rana JS, Dunning A, Achenbach S, Al-Mallah M, Budoff MJ, Cademartiri F, Callister TQ, Chang HJ, Cheng VY, Chinnaiyan K, Chow BJ, Cury R, Delago A, Feuchtner G, Hadamitzky M, Hausleiter J, Kaufmann P, Karlsberg RP, Kim YJ, Leipsic J, Labounty TM, Lin FY, Maffei E, Raff G, Villines TC, Shaw LJ, Berman DS, Min JK. Differences in prevalence, extent, severity, and prognosis of coronary artery disease among patients with and without diabetes undergoing coronary computed tomography angiography: results from 10,110 individuals from the CONFIRM (COronary CT Angiography EvaluatioN For Clinical Outcomes): an InteRnational Multicenter Registry. Diabetes Care. 2012;35:1787–1794. doi: 10.2337/dc11-2403. [DOI] [PMC free article] [PubMed] [Google Scholar]
- 2.Rosenson RS, Fioretto P, Dodson PM. Does microvascular disease predict macrovascular events in type 2 diabetes? Atherosclerosis. 2011;218:13–18. doi: 10.1016/j.atherosclerosis.2011.06.029. [DOI] [PubMed] [Google Scholar]
- 3.Goldberg RB. Cytokine and cytokine-like inflammation markers, endothelial dysfunction, and imbalanced coagulation in development of diabetes and its complications. J Clin Endocrinol Metab. 2009;94:3171–3182. doi: 10.1210/jc.2008-2534. [DOI] [PubMed] [Google Scholar]
- 4.Lim AK, Tesch GH. Inflammation in diabetic nephropathy. Mediators Inflamm. 2012;2012:146154. doi: 10.1155/2012/146154. [DOI] [PMC free article] [PubMed] [Google Scholar]
- 5.Astrup AS, Tarnow L, Pietraszek L, Schalkwijk CG, Stehouwer CD, Parving HH, Rossing P. Markers of endothelial dysfunction and inflammation in type 1 diabetic patients with or without diabetic nephropathy followed for 10 years: association with mortality and decline of glomerular filtration rate. Diabetes Care. 2008;31:1170–1176. doi: 10.2337/dc07-1960. [DOI] [PubMed] [Google Scholar]
- 6.Ross R. Atherosclerosis--an inflammatory disease. N Engl J Med. 1999;340:115–126. doi: 10.1056/NEJM199901143400207. [DOI] [PubMed] [Google Scholar]
- 7.Wang Y, Yuan A, Yu C. Correlation between microalbuminuria and cardiovascular events. Int J Clin Exp Med. 2013;6:973–978. [PMC free article] [PubMed] [Google Scholar]
- 8.Packham DK, Alves TP, Dwyer JP, Atkins R, de Zeeuw D, Cooper M, Shahinfar S, Lewis JB, Lambers Heerspink HJ. Relative incidence of ESRD versus cardiovascular mortality in proteinuric type 2 diabetes and nephropathy: results from the DIAMETRIC (Diabetes Mellitus Treatment for Renal Insufficiency Consortium) database. Am J Kidney Dis. 2012;59:75–83. doi: 10.1053/j.ajkd.2011.09.017. [DOI] [PubMed] [Google Scholar]
- 9.Sun YM, Su Y, Li J, Wang LF. Recent advances in understanding the biochemical and molecular mechanism of diabetic nephropathy. Biochem Biophys Res Commun. 2013;433:359–361. doi: 10.1016/j.bbrc.2013.02.120. [DOI] [PubMed] [Google Scholar]
- 10.Mima A. Inflammation and oxidative stress in diabetic nephropathy: new insights on its inhibition as new therapeutic targets. J Diabetes Res. 2013;2013:248563. doi: 10.1155/2013/248563. [DOI] [PMC free article] [PubMed] [Google Scholar]
- 11.Luis-Rodriguez D, Martinez-Castelao A, Gorriz JL, De-Alvaro F, Navarro-Gonzalez JF. Pathophysiological role and therapeutic implications of inflammation in diabetic nephropathy. World J Diabetes. 2012;3:7–18. doi: 10.4239/wjd.v3.i1.7. [DOI] [PMC free article] [PubMed] [Google Scholar]
- 12.Wang L, Wu CG, Fang CQ, Gao J, Liu YZ, Chen Y, Chen YN, Xu ZG. The protective effect of alpha-Lipoic acid on mitochondria in the kidney of diabetic rats. Int J Clin Exp Med. 2013;6:90–97. [PMC free article] [PubMed] [Google Scholar]
- 13.Turkmen K, Erdur FM, Ozcicek F, Ozcicek A, Akbas EM, Ozbicer A, Demirtas L, Turk S, Tonbul HZ. Platelet-to-lymphocyte ratio better predicts inflammation than neutrophil-to-lymphocyte ratio in end-stage renal disease patients. Hemodial Int. 2013;17:391–396. doi: 10.1111/hdi.12040. [DOI] [PubMed] [Google Scholar]
- 14.Turkmen K, Guney I, Yerlikaya FH, Tonbul HZ. The relationship between neutrophil-to-lymphocyte ratio and inflammation in end-stage renal disease patients. Ren Fail. 2012;34:155–159. doi: 10.3109/0886022X.2011.641514. [DOI] [PubMed] [Google Scholar]
- 15.Turkmen K, Erdur FM, Guney I, Ozbiner H, Toker A, Gaipov A, Ozbek O, Yeksan M, Tonbul HZ, Turk S. Relationship between Plasma Pentraxin-3, Neutrophil-to-Lymphocyte Ratio, and Atherosclerosis in Renal Transplant Patients. Cardiorenal Med. 2012;2:298–307. doi: 10.1159/000343887. [DOI] [PMC free article] [PubMed] [Google Scholar]
- 16.Horne BD, Anderson JL, John JM, Weaver A, Bair TL, Jensen KR, Renlund DG, Muhlestein JB Intermountain Heart Collaborative Study Group. Which white blood cell subtypes predict increased cardiovascular risk? J Am Coll Cardiol. 2005;45:1638–1643. doi: 10.1016/j.jacc.2005.02.054. [DOI] [PubMed] [Google Scholar]
- 17.Raungkaewmanee S, Tangjitgamol S, Manusirivithaya S, Srijaipracharoen S, Thavaramara T. Platelet to lymphocyte ratio as a prognostic factor for epithelial ovarian cancer. J Gynecol Oncol. 2012;23:265–273. doi: 10.3802/jgo.2012.23.4.265. [DOI] [PMC free article] [PubMed] [Google Scholar]
- 18.Noh H, Eomm M, Han A. Usefulness of pretreatment neutrophil to lymphocyte ratio in predicting disease-specific survival in breast cancer patients. J Breast Cancer. 2013;16:55–59. doi: 10.4048/jbc.2013.16.1.55. [DOI] [PMC free article] [PubMed] [Google Scholar]
- 19.Kaya A, Kurt M, Tanboga IH, Isik T, Gunaydin ZY, Kaya Y, Topcu S, Sevimli S. Relation of Neutrophil to Lymphocyte Ratio With the Presence and Severity of Stable Coronary Artery Disease. Clin Appl Thromb Hemost. 2013;20:473–477. doi: 10.1177/1076029612473517. [DOI] [PubMed] [Google Scholar]
- 20.Ergelen M, Uyarel H, Altay S, Kul S, Ayhan E, Isik T, Kemaloglu T, Gul M, Sonmez O, Erdogan E, Turfan M. Predictive Value of Elevated Neutrophil to Lymphocyte Ratio in Patients Undergoing Primary Angioplasty for ST-Segment Elevation Myocardial Infarction. Clin Appl Thromb Hemost. 2014;20:427–32. doi: 10.1177/1076029612473516. [DOI] [PubMed] [Google Scholar]
- 21.Turkmen K. Platelet-to-Lymphocyte Ratio: One of the novel and valuable platelet indices in hemodialysis patients. Hemodial Int. 2013;17:670. doi: 10.1111/hdi.12095. [DOI] [PubMed] [Google Scholar]
- 22.Azab B, Daoud J, Naeem FB, Nasr R, Ross J, Ghimire P, Siddiqui A, Azzi N, Rihana N, Abdallah M, Azzi N, Patel P, Kleiner M, El-Sayegh S. Neutrophil-to-lymphocyte ratio as a predictor of worsening renal function in diabetic patients (3-year follow-up study) Ren Fail. 2012;34:571–576. doi: 10.3109/0886022X.2012.668741. [DOI] [PubMed] [Google Scholar]
- 23.Baker AR, Silva NF, Quinn DW, Harte AL, Pagano D, Bonser RS, Kumar S, McTernan PG. Human epicardial adipose tissue expresses a pathogenic profile of adipocytokines in patients with cardiovascular disease. Cardiovasc Diabetol. 2006;5:1. doi: 10.1186/1475-2840-5-1. [DOI] [PMC free article] [PubMed] [Google Scholar]
- 24.Mahabadi AA, Berg MH, Lehmann N, Kalsch H, Bauer M, Kara K, Dragano N, Moebus S, Jockel KH, Erbel R, Mohlenkamp S. Association of epicardial fat with cardiovascular risk factors and incident myocardial infarction in the general population: the Heinz Nixdorf Recall Study. J Am Coll Cardiol. 2013;61:1388–1395. doi: 10.1016/j.jacc.2012.11.062. [DOI] [PubMed] [Google Scholar]
- 25.Gedik O, Ozturk M, Turan OE, Ilter A, Hosoglu Y, Kiris G. Epicardial adipose tissue thickness is increased in patients with cardiac syndrome X. Int J Clin Exp Med. 2014;7:194–198. [PMC free article] [PubMed] [Google Scholar]
- 26.Turkmen K, Kayikcioglu H, Ozbek O, Solak Y, Kayrak M, Samur C, Anil M, Zeki Tonbul H. The relationship between epicardial adipose tissue and malnutrition, inflammation, atherosclerosis/calcification syndrome in ESRD patients. Clin J Am Soc Nephrol. 2011;6:1920–1925. doi: 10.2215/CJN.00890111. [DOI] [PMC free article] [PubMed] [Google Scholar]
- 27.Turkmen K, Ozbek O, Kayikcioglu H, Kayrak M, Solak Y, Nayman A, Anil M, Babur H, Tonbul HZ. The Relationship between Epicardial Adipose Tissue and Coronary Artery Calcification in Peritoneal Dialysis Patients. Cardiorenal Med. 2012;2:43–51. doi: 10.1159/000335495. [DOI] [PMC free article] [PubMed] [Google Scholar]
- 28.Erdur MF, Tonbul HZ, Ozbiner H, Ozcicek A, Ozcicek F, Akbas EM, Ozbek O, Hamur H, Turkmen K. The relationship between atherogenic index of plasma and epicardial adipose tissue in hemodialysis and peritoneal dialysis patients. Ren Fail. 2013;35:1193–1198. doi: 10.3109/0886022X.2013.823826. [DOI] [PubMed] [Google Scholar]
- 29.Arita Y, Kihara S, Ouchi N, Maeda K, Kuriyama H, Okamoto Y, Kumada M, Hotta K, Nishida M, Takahashi M, Nakamura T, Shimomura I, Muraguchi M, Ohmoto Y, Funahashi T, Matsuzawa Y. Adipocyte-derived plasma protein adiponectin acts as a platelet-derived growth factor-BB-binding protein and regulates growth factor-induced common postreceptor signal in vascular smooth muscle cell. Circulation. 2002;105:2893–2898. doi: 10.1161/01.cir.0000018622.84402.ff. [DOI] [PubMed] [Google Scholar]
- 30.Hirata Y, Kurobe H, Akaike M, Chikugo F, Hori T, Bando Y, Nishio C, Higashida M, Nakaya Y, Kitagawa T, Sata M. Enhanced inflammation in epicardial fat in patients with coronary artery disease. Int Heart J. 2011;52:139–142. doi: 10.1536/ihj.52.139. [DOI] [PubMed] [Google Scholar]
- 31.Hirata Y, Tabata M, Kurobe H, Motoki T, Akaike M, Nishio C, Higashida M, Mikasa H, Nakaya Y, Takanashi S, Igarashi T, Kitagawa T, Sata M. Coronary atherosclerosis is associated with macrophage polarization in epicardial adipose tissue. J Am Coll Cardiol. 2011;58:248–255. doi: 10.1016/j.jacc.2011.01.048. [DOI] [PubMed] [Google Scholar]
- 32.Laine P, Kaartinen M, Penttila A, Panula P, Paavonen T, Kovanen PT. Association between myocardial infarction and the mast cells in the adventitia of the infarct-related coronary artery. Circulation. 1999;99:361–369. doi: 10.1161/01.cir.99.3.361. [DOI] [PubMed] [Google Scholar]
- 33.Mazurek T, Zhang L, Zalewski A, Mannion JD, Diehl JT, Arafat H, Sarov-Blat L, O’Brien S, Keiper EA, Johnson AG, Martin J, Goldstein BJ, Shi Y. Human epicardial adipose tissue is a source of inflammatory mediators. Circulation. 2003;108:2460–2466. doi: 10.1161/01.CIR.0000099542.57313.C5. [DOI] [PubMed] [Google Scholar]
- 34.Kremen J, Dolinkova M, Krajickova J, Blaha J, Anderlova K, Lacinova Z, Haluzikova D, Bosanska L, Vokurka M, Svacina S, Haluzik M. Increased subcutaneous and epicardial adipose tissue production of proinflammatory cytokines in cardiac surgery patients: possible role in postoperative insulin resistance. J Clin Endocrinol Metab. 2006;91:4620–4627. doi: 10.1210/jc.2006-1044. [DOI] [PubMed] [Google Scholar]
- 35.Kayrak M, Erdogan HI, Solak Y, Akilli H, Gul EE, Yildirim O, Erer M, Akilli NB, Bekci TT, Aribas A, Yazici M. Prognostic Value of Neutrophil to Lymphocyte Ratio in Patients with Acute Pulmonary Embolism: A Restrospective Study. Heart Lung Circ. 2014;23:56–62. doi: 10.1016/j.hlc.2013.06.004. [DOI] [PubMed] [Google Scholar]
- 36.Tong PC, Lee KF, So WY, Ng MH, Chan WB, Lo MK, Chan NN, Chan JC. White blood cell count is associated with macro- and microvascular complications in chinese patients with type 2 diabetes. Diabetes Care. 2004;27:216–222. doi: 10.2337/diacare.27.1.216. [DOI] [PubMed] [Google Scholar]
- 37.Chung FM, Tsai JC, Chang DM, Shin SJ, Lee YJ. Peripheral total and differential leukocyte count in diabetic nephropathy: the relationship of plasma leptin to leukocytosis. Diabetes Care. 2005;28:1710–1717. doi: 10.2337/diacare.28.7.1710. [DOI] [PubMed] [Google Scholar]
- 38.Cavalot F, Massucco P, Perna P, Traversa M, Anfossi G, Trovati M. White blood cell count is positively correlated with albumin excretion rate in subjects with type 2 diabetes. Diabetes Care. 2002;25:2354–2355. doi: 10.2337/diacare.25.12.2354-a. [DOI] [PubMed] [Google Scholar]
- 39.De Larochelliere E, Cote J, Gilbert G, Bibeau K, Ross MK, Dion-Roy V, Pibarot P, Despres JP, Larose E. Visceral/epicardial adiposity in nonobese and apparently healthy young adults: Association with the cardiometabolic profile. Atherosclerosis. 2014;234:23–29. doi: 10.1016/j.atherosclerosis.2014.01.053. [DOI] [PubMed] [Google Scholar]
- 40.Hanai K, Babazono T, Nyumura I, Toya K, Ohta M, Bouchi R, Suzuki K, Inoue A, Iwamoto Y. Involvement of visceral fat in the pathogenesis of albuminuria in patients with type 2 diabetes with early stage of nephropathy. Clin Exp Nephrol. 2010;14:132–136. doi: 10.1007/s10157-009-0245-8. [DOI] [PubMed] [Google Scholar]
- 41.Sibley SD, de Boer IH, Steffes MW, Brunzell JD, Diabetes C, Complications Trial/Epidemiology of Diabetes I, Complications Research Study G. Intra-abdominal fat and elevated urine albumin excretion in men with type 1 diabetes. Diabetes Care. 2007;30:1898–1900. doi: 10.2337/dc06-2345. [DOI] [PMC free article] [PubMed] [Google Scholar]
- 42.Iacobellis G, Malavazos AE, Corsi MM. Epicardial fat: from the biomolecular aspects to the clinical practice. Int J Biochem Cell Biol. 2011;43:1651–1654. doi: 10.1016/j.biocel.2011.09.006. [DOI] [PubMed] [Google Scholar]