

Individuals with autism are often characterized as ‘not seeing the forest for the trees’, attuned to visual details in the world at the expense of the global percept. Robertson et al. relate an archetypal global processing deficit in autism to perturbations at the earliest stages of cortical visual processing.
Keywords: autism, motion, fMRI, vision, global perception
Abstract
Individuals with autism are often characterized as ‘seeing the trees, but not the forest’—attuned to individual details in the visual world at the expense of the global percept they compose. Here, we tested the extent to which global processing deficits in autism reflect impairments in (i) primary visual processing; or (ii) decision-formation, using an archetypal example of global perception, coherent motion perception. In an event-related functional MRI experiment, 43 intelligence quotient and age-matched male participants (21 with autism, age range 15–27 years) performed a series of coherent motion perception judgements in which the amount of local motion signals available to be integrated into a global percept was varied by controlling stimulus viewing duration (0.2 or 0.6 s) and the proportion of dots moving in the correct direction (coherence: 4%, 15%, 30%, 50%, or 75%). Both typical participants and those with autism evidenced the same basic pattern of accuracy in judging the direction of motion, with performance decreasing with reduced coherence and shorter viewing durations. Critically, these effects were exaggerated in autism: despite equal performance at the long duration, performance was more strongly reduced by shortening viewing duration in autism (P < 0.015) and decreasing stimulus coherence (P < 0.008). To assess the neural correlates of these effects we focused on the responses of primary visual cortex and the middle temporal area, critical in the early visual processing of motion signals, as well as a region in the intraparietal sulcus thought to be involved in perceptual decision-making. The behavioural results were mirrored in both primary visual cortex and the middle temporal area, with a greater reduction in response at short, compared with long, viewing durations in autism compared with controls (both P < 0.018). In contrast, there was no difference between the groups in the intraparietal sulcus (P > 0.574). These findings suggest that reduced global motion perception in autism is driven by an atypical response early in visual processing and may reflect a fundamental perturbation in neural circuitry.
Introduction
Visual perception is commonly thought to involve two levels of analysis, local and global. Looking at a visual scene (e.g. 20 birds flying above a lake), we are both able to individuate ‘local’ elements (e.g. each bird, its particular plumage and motion) and also to synthesize this visual manifold into ‘global’ units (e.g. a flock of geese flying North). Individuals with Autism Spectrum Disorders (ASD) are reportedly poor at such synthesis, attuned to details of the visual world but not the global percept they compose. Experimentally, individuals with ASD often demonstrate deficits when tasks emphasize aggregating local elements into a global whole (Rinehart et al., 2000; Behrmann et al., 2006) and superior performance when tasks emphasize the perception of local elements (Shah and Frith, 1983; Plaisted et al., 1998).
Despite being amongst the most consistent characteristics of ASD, the mechanism underlying reduced global perception remains unknown. First, it is unclear whether this characteristic reflects a dysfunction in, or simply a disinclination towards, global perceptual analysis (Happé and Frith, 2006; Koldewyn et al., 2013). Second, assuming a dysfunction, two possible accounts of the disorder exist. The autistic brain might have a specific deficit in the integration of local elements into a global percept (Frith, 1989). Under this account, the integration of visual information in higher-order cortical areas is perturbed in ASD, but the basic representation of information in early visual areas is intact. Alternatively, the earliest levels of visual analysis might be altered in the autistic brain (Spencer et al., 2000; Milne et al., 2002), possibly indicating a distributed systemic disorder. To address these issues, we turned to an archetypal test of global perception: coherent motion perception.
Numerous investigations have reported coherent motion processing deficits in ASD (Spencer et al., 2000; Milne et al., 2002), and performance in this task has been found to correlate with other markers of atypical global perception (Pellicano et al., 2005). Thus, this task provides a clear example of atypical global perceptual processing in ASD. In a recent behavioural study (Robertson et al., 2012), we systematically varied the amount of time over which motion signals could be integrated towards a global percept and found an exaggerated dependence on viewing duration in ASD. Specifically, while individuals with ASD showed comparable performance to control participants at a long duration (1.5 s), they were significantly impaired at the shortest duration (0.2 s). This pattern of results suggests that the neural circuit underlying coherent motion perception is intact in ASD, but takes longer to integrate local signals into a global percept. Here, we seek to understand the neurobiological basis of this finding.
Coherent motion perception can be parsed, computationally (Palmer et al., 2005) and neurobiologically (Heekeren et al., 2004; Gold and Shadlen, 2007), into two processing stages: (i) the detection of momentary local motion signals in the environment, which is thought to occur in early visual areas of the brain (the primary visual area, V1, and the middle temporal area, hMT+); and (ii) the spatiotemporal integration of these signals into a global percept or decision-variable, which is thought to occur in parietal cortex. This circuit is one of the most well-characterized circuits in the primate brain (Mikami et al., 1986; Freedman and Assad, 2006; Gold and Shadlen, 2007), and thus provides an opportunity to elucidate the neural correlates of reduced global perception in ASD.
Many accounts of autism would predict a high-level deficit in motion integration, but spared primary representations of motion stimuli (Frith, 1989). However, weak or noisy motion signals generated in V1/hMT+ might also produce global motion processing deficits (Spencer et al., 2000; Milne et al., 2002), requiring more sampling to reflect the accurate global motion direction. Here, we sought to establish the first level of processing at which global motion atypicalities are evident in the autistic brain by interrogating three nodes in the canonical motion-processing circuit: V1, hMT+, and intraparietal sulcus. In the context of an event-related functional MRI paradigm, we varied the amount of available sensory evidence (stimulus duration) presented to individuals with and without ASD during a coherent motion perception task and examined the impact of stimulus duration on individuals’ performance, as well as on the magnitude of response in each component of the neural circuit underlying coherent motion perception.
Our findings pinpoint global motion processing deficits in ASD to differences in early visual processing. Specifically, we found that early visual areas of the brain (V1 and hMT+) that process moment-to-moment motion signals in the environment are disproportionately affected by reducing stimulus duration in ASD, mirroring autistic behavioural performance. In contrast, responses in intraparietal sulcus were comparable in individuals with and without ASD. These results suggest that perturbed primary visual responses to elemental visual information (‘the trees’) underlie this autistic global perceptual deficit, presumably altering the rate at which those local details are integrated into a global percept (‘the forest’). These results have implications for our understanding of autistic neurobiology, demonstrating atypical neural responses at even the earliest levels of visual processing.
Materials and methods
Participants
We tested 43 male adolescents and adults (22 controls, 21 ASD), recruited from the Washington D.C. metropolitan area. Groups were matched for age (ASD: 19.53, controls: 19.47, P > 0.946), verbal (ASD: 112.56, controls: 114.94, P > 0.620), and non-verbal IQ (ASD: 116.28, controls: 113.72, P > 0.556) as measured by the Wechsler Abbreviated Scale of Intelligence (Table 1). All individuals with ASD met Diagnostic and Statistical Manual of Mental Disorders-IV diagnostic criteria (n = 13 Asperger’s, n = 3 high-functioning autism, n = 2 pervasive developmental disorder, not otherwise specified) as assessed by an experienced clinician. The Autism Diagnostic Interview-Revised (Lord et al., 1994) and the Autism Diagnostic Observation Schedule (ADOS) (Lord et al., 2000) were also administered to participants with ASD by a trained, research-reliable clinician. All ASD participants’ scores met cut-off for the category designated as ‘Broad Autism Spectrum Disorder’ (Lainhart et al., 2006). Exclusion criteria for the ASD group included age <15 years, IQ <70, or any known comorbid medical conditions. Controls were excluded from participation if they had ever received mental health treatment, taken psychiatric medications, required special services in school, been diagnosed with a genetic or neurological disorder, or had brain trauma/injury. All participants had normal or corrected-to-normal vision. Written consent was obtained from all participants and/or their parent/guardian, in accordance with a protocol approved by the National Institutes of Health Institutional Review Board.
Table 1.
Psychometric data
| n | Minimum | Maximum | Mean | Standard deviation | ||
|---|---|---|---|---|---|---|
| ASD | Age | 18 | 16 | 27 | 19.53 | 3.376 |
| Verbal IQ | 18 | 68 | 138 | 112.56 | 16.447 | |
| Performance IQ | 18 | 81 | 138 | 116.28 | 14.851 | |
| Full IQ | 18 | 72 | 143 | 116.11 | 16.481 | |
| ADI-R | 17 | 28 | 61 | 34.23 | 7.128 | |
| ADOS | 18 | 5 | 18 | 13.61 | 4.189 | |
| Control | Age | 18 | 15 | 23 | 19.47 | 2.295 |
| Verbal IQ | 18 | 99 | 141 | 114.94 | 11.854 | |
| Performance IQ | 18 | 95 | 129 | 113.72 | 10.560 | |
| Full IQ | 18 | 101 | 136 | 116.22 | 10.109 | |
ASD and control groups who participated in the experiment were matched in age (t = −0.068, P > 0.946), verbal (t = 0.500, P > 0.620), performance (t = −0.595, P > 0.556), and Full-scale IQ (t = 0.024, P > 0.981). All participants were male.
ADI-R = Autism Diagnostic Interview-Revised.
Stimulus presentation
Stimuli were presented using PsychToolbox (Brainard, 1997) on a translucent screen using an LCD projector and viewed through a mirror attached to the head coil. Stimulus presentation scripts were adapted from the Shadlen lab’s MATLAB code (https://www.shadlenlab.columbia.edu/resources/VCRDM.html).
Stimuli
Participants performed two blocked versions of the classic forced-choice motion discrimination task (Britten et al., 1992), manually indicating the global direction of motion (right or left) of a random-dot kinematogram (RDK). Stimuli were identical to those used in Robertson et al. (2012): 150 white dots (dot diameter: 0.04°, density: 1.85 dots/deg2, speed: 5.0°/s) appeared in an aperture (diameter: 9°) on the black screen, 8° above a fixation point (centre-to-centre distance). A peripheral stimulus aperture was chosen to reduce the effect of motion on eye movements, and set in the upper visual field to match previous studies using this paradigm (Shadlen and Newsome, 2001).
Participants completed 38 trials at each of five different coherence levels and two stimulus durations (four blocks of 95 trials). In each trial, a fixed percentage of dots (4%, 15%, 30%, 50%, or 75%) moved in a coherent direction (0° or 180°) for the duration of the trial. Coherence in the display was defined by the proportion of dots moving in the global direction of motion, rather than the variance of the motion vector assigned to any one dot. On each frame (0.017 s), one-third of the total set of dots was replotted. The probability that a dot was shifted in the global direction of motion, as opposed to randomly replotted, was determined by the level of coherence in the display (Roitman and Shadlen, 2002; Robertson et al., 2012). Coherence level (motion strength) and dot direction were randomized across trials.
In each of the four blocks, the total stimulus duration was fixed (either 0.6 s or 0.2 s). These two durations were chosen from consideration of our earlier findings: the latter a duration at which autistic performance was found to be inferior to control performance, and the former falling between two longer durations (0.4 and 1.5 s) at which autistic performance was typical (Robertson et al., 2012). Different stimulus durations were created by increasing the number of frames in which dots were plotted (rather than extending dot lifetime). Participants performed two blocks of each stimulus duration, always beginning with the 0.6 seconds duration block and alternating thereafter.
Procedure
Prior to the experiment, participants were introduced to the task through both verbal description and practice at the highest level of coherence (75%) and longest stimulus duration (0.6 s). The task was likened to watching a group of leaves glimmering on a tree in order to judge in what direction the wind was blowing.
During each trial, a patch of dots would appear on the screen for a fixed duration, after which the screen would become blank and participants indicated the ‘general direction’ in which the dots were moving by key press (Fig. 1). Participants were instructed to delay their response until after the stimulus had been removed from the screen, and responses before stimulus offset were excluded from analyses so that responses reflected complete integration of the available motion signals. Participants were encouraged to consider ‘the entire duration of motion presentation’ before deciding their answer, but to respond as soon as possible after dot offset during the 2-s response period. Due to the temporal jitter between trials, the intertrial interval ranged from 2–8 s. A red fixation point was present throughout the entire trial. Participants were instructed to fixate on this point throughout the task.
Figure 1.
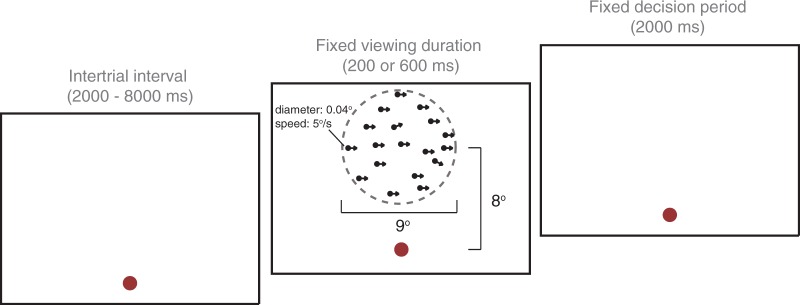
One trial of the Motion Coherence Task. Participants manually indicated the ‘general direction of motion’ of 150 white dots, presented on a black screen above a fixation point. The field of dots occupied the extent of an invisible circular aperture, illustrated here with a dotted line. Viewing duration varied between blocks (200 ms or 600 ms), titrating the amount of time available for motion integration, but the decision period remained constant regardless of viewing duration.
Behavioural analysis
To ensure participants were able to perform the task, they were only considered for analysis if they were able to detect the general direction of motion (average accuracy >80% correct) at the highest coherence level during trials enduring for the longest presentation time (0.6 s) (excluded n = 2 with ASD). We compared the accuracy and response times of each group using a repeated-measures ANOVA with ‘Coherence’ (4–75%) and ‘Duration’ (0.2 s, 0.6 s) as within-subject factors and ‘Diagnosis’ (ASD, Control) as a between-subject factor. We emphasize accuracy, rather than response times, because of the difficulty in disambiguating the degree to which response times reflects motor preparation or decision-formation in this delayed-response task. The button-box failed to record responses from two participants (both with ASD: one for both 0.6 s, one for both 0.2 s runs). These participants are included in all reported functional MRI analyses, as exclusion of these participants did not qualitatively affect the results. In all statistical analyses, Greenhouse-Geisser corrections were used for non-spherical data. All reported results remained significant when ‘Age’ and ‘Full-scale IQ’ were treated as covariates of no interest.
Functional MRI
Localizer procedure
In addition to the four event-related task runs, an independent localizer, designed to functionally localize hMT+ and the intraparietal sulcus, was collected for each participant. This coherent motion localizer used an on/off block design to identify parts of the brain that responded more to coherent than random motion. The stimulus parameters in this localizer were identical to those used in the event-related task, but the stimuli were presented in 12 alternating blocks of coherent and random motion (12 s each). During blocks of coherent motion, dots changed their coherent direction every second to avoid adaptation to any constant direction of motion. Participants were encouraged to ‘pay attention to the direction in which the dots were moving’. Regions of interest were defined considering the contrast of coherent > random motion, in keeping with the extant literature on a monotonic increase in hMT+ activity with increasingly coherent motion (Rees et al., 2000).
Data acquisition
Participants were scanned on a 3 T Signa scanner (GE Medical Systems), equipped with an 8-channel head gradient coil and located on the National Institutes of Health campus. We acquired partial volumes of the parietal, occipital, and frontal cortices of participants’ brains (26 slices; voxel size = 2 × 2 × 3 mm; interslice gap = 0.3 mm; time repetition = 2 s; echo time = 30 ms; matrix size = 96 × 96; field of view = 192 mm). Oblique slices were oriented so as to capture the ventral-most point of the occipital cortex and the dorsal-most point of the parietal cortex.
Four event-related runs (246 repetition times), two independent localizer scans (148 and 144 repetition times), and a high-resolution, whole-brain anatomical volume using a T1-weighted magnetization-prepared rapid acquisition gradient echo imaging sequence (MPRAGE) (124 slices; voxel size = 0.938 × 0.938 × 1.2 mm; repetition time = 25 ms; echo time = 6 ms; matrix size = 256 × 256 × 124 mm; field of view = 240.128 × 240.128 × 148.8 mm) were acquired in each session. Each session began with the anatomical scan. A localizer scan followed every two event-related runs. The scan-session lasted ∼75 min, with experimental task runs occupying 32.8 min of the session.
Data preprocessing
Data were preprocessed using Analysis of Functional NeuroImages software (AFNI) (http://afni.nimh.nih.gov/afni) (Cox, 1996). Data from the first eight repetition times of each event-related run were discarded to minimize the effect of transient magnetic saturation. The first block of each localizer scan was also discarded to account for any visual transients evoked by the sudden onset of stimuli. All functional volumes were slice-time and motion corrected. Volumes acquired during localizer scans were resampled and spatially smoothed using a 5 mm full-width at half-maximum Gaussian kernel.
Cortical surfaces were generated from the high-resolution, skull-stripped anatomical volume using FreeSurfer (Fischl et al., 1999). Anatomical regions of interest of the intraparietal sulcus and V1 were reconstructed for each participant using gyral and sulcal anatomy (Fischl et al., 1999). Functional volumes were de-obliqued and aligned to the high-resolution anatomy for all analyses involving anatomical regions of interest.
Identification of primary visual cortex
V1 was bilaterally defined on each participant’s cortical surface, which was reconstructed from the high-resolution anatomical volume using FreeSurfer. For each participant, automated anatomical criteria were employed to reconstruct a probabilistic map of the location of V1 along the calcarine sulcus using the gyral and sulcal anatomy (Hinds et al., 2008). This region of interest was further refined into the lower bank of V1 (corresponding to the representation of the upper visual field) by manually tracing the calcarine sulcus and selecting voxels that lay both within the probablistic map and below the fundus of the calcarine sulcus. Results were comparable between the left and right hemispheres in V1; we therefore collapsed across hemispheres for all reported analyses.
Identification of the middle temporal area
We computed significance maps of the brain for each individual’s localizer scan, thresholded at P < 10−4 (uncorrected). hMT+ (V5) was defined bilaterally as a contiguous cluster of suprathreshold voxels evidenced in the coherent motion localizer and visually inspected for anatomical location (Huk et al., 2002). Only regions of interest whose sizes exceeded 10 voxels were considered for analyses. hMT+ was not apparent in five participants (four controls, one ASD), who were not considered for further analysis. Results were comparable between the left and right hemispheres in hMT+; we therefore collapsed across hemispheres for all reported analyses.
Identification of the intraparietal sulcus
The intraparietal sulcus was defined bilaterally using an anatomical region of interest derived from a FreeSurfer reconstruction of each individual’s cortical surface. This anatomical parcel was extracted and reverse-normalized to each participant’s native volumetric space (using AFNI’s 3dSurfToVol). We also created an intraparietal sulcus region of interest using the conjunction of suprathreshold voxels from the coherent motion localizer and an anatomical region of interest of the intraparietal sulcus. Using this definition, intraparietal sulcus was not apparent in two participants (one control, one ASD). We therefore use the anatomical intraparietal sulcus region of interest in all results presented here, although results were qualitatively similar when the conjunction region of interest was considered instead. The intraparietal sulcus results were comparable between the left and right hemispheres; we therefore collapsed across hemispheres for all analyses involving intraparietal sulcus.
Data analysis
Data analyses were performed using AFNI, SUMA (http://afni.nimh.nih.gov/afni/suma), and custom MATLAB scripts to measure blood oxygenation level-dependent changes in MRI signal intensity. Event-related data were deconvolved with a generalized linear model (GLM) to estimate the haemodynamic response function to each stimulus condition in each voxel. Deconvolutions were carried out in two different ways, using: (i) a standard GLM in which responses were convolved with a gamma function; and (ii) a GLM in which responses were convolved with a series of tent functions that spanned from stimulus onset to 24 s after stimulus onset. The first type of deconvolution was used for all statistical analyses; the second to simply confirm strong responses in our regions of interest, and subsequently for illustrative purposes only. Results were qualitatively similar regardless of which deconvolution was used.
Motion parameters were modelled as regressors of no interest in the design matrices of all deconvolutions to model out potential head motion artefacts. We also examined potential group differences in motion by calculating the root-mean-square of each of the six motion parameters for each participant and entering these data into a two-way repeated-measures ANOVA. No main effects or interactions involving diagnosis were observed (all P > 0.362). Between-group differences in movement are therefore unlikely to account for the results reported below.
We employed an region of interest analysis for two reasons: (i) our a priori hypotheses focused on the key components of the motion processing circuit (V1, middle temporal and intraparietal sulcus) (Heekeren et al., 2004; Gold and Shadlen, 2007); and (ii) previous reports that the location of hMT+ (Huk et al., 2002) and the configuration of the calcarine sulcus (Benson et al., 2012) varies widely between individuals. We therefore performed a group analysis only to check whether any effects were manifest outside of our regions of interest.
In all statistical analyses, Greenhouse-Geisser corrections were used for non-spherical data. One-tailed t-tests were used in correlation analyses involving diagnostic measures because of our a priori prediction that global motion processing would be worse in individuals with higher autistic symptoms (Robertson et al., 2012), and bootstrapped 95% Spearman’s rank confidence intervals between are reported (Schwarzkopf et al., 2012). All reported results remained significant when Age and Full-Scale IQ were treated as covariates of no interest.
Results
We aimed to test whether coherent motion processing would evidence a greater effect of the strength of local motion signals in ASD (Robertson et al., 2012), and to establish where this difference would be functionally mirrored in the neural circuit thought to support coherent motion perception: either in early visual (V1 and hMT+) or decision-related (intraparietal sulcus) regions of the brain.
Greater effect of stimulus duration on performance in autism
To investigate the effect of stimulus duration on behavioural performance in ASD, we conducted a three-way ANOVA with ‘Duration’ and ‘Coherence’ as repeated measures factors and ‘Diagnosis’ as a between-subjects factor for both accuracy and response times. For accuracy, no main effect of Diagnosis was observed [F(1,32) = 0.017, P < 0.896], indicating that the two groups showed comparable overall performance. However, a highly significant main effect of Duration [F(1,32) = 33.559, P < 0.001] was observed, reflecting the overall decrease in accuracy in both ASD and controls when motion presentation time was short (Fig. 2A). Critically, this effect was exaggerated for individuals with ASD, as indicated by a significant Duration × Diagnosis interaction [F(1,32) = 6.573, P < 0.015]. This result replicates our previous finding (Robertson et al., 2012) indicating an atypical rate at which local motion signals are integrated towards a global percept in ASD.
Figure 2.

Increased effect of viewing duration on performance in ASD. (A) In both groups, accuracy was worse when viewing duration was short (across coherence levels), reflecting the shorter amount of time available to integrate motion signals towards a global percept. This effect of viewing duration was much stronger for individuals with ASD, indicating that individuals with ASD require more time to integrate motion signals towards a global percept. Dotted lines indicate 82% perceptual thresholds. (B) For both groups, reaction time (calculated from stimulus offset) decreased with increasing coherence in the display. Raw reaction times were comparable between the two groups. (C) Behavioural performance in ASD correlated with higher-order measures of autistic symptomatology, as measured by the Autism Diagnostic Interview (ADI). Individuals with lower autistic symptoms displayed better coherent motion processing at both long (rho = −0.543, bootstrapped 95% CIs: −0.73 to −0.12) and short (rho = −0.455, bootstrapped 95% CIs: −0.86 to −0.12) viewing durations.
This ANOVA also revealed a highly significant main effect of Coherence [F(2.629,84.115) = 279.601, P < 0.001], indicating the expected rise in performance with increasing coherence in the display (Fig. 2A). This effect was also exaggerated for individuals with ASD, as illustrated by a significant Coherence × Diagnosis interaction [F(2.629,84.115) = 4.450, P < 0.008]. Although this effect seemed slightly stronger at the longer duration [Long: F(3.05,100.637) = 3.535, P < 0.017; Short: F(2.90,95.56) = 1.686, P < 0.177], there was no significant three-way Coherence × Diagnosis × Duration interaction [F(4,128) = 0.488, P > 0.744].
The response time ANOVA confirmed there were no speed/accuracy trade-offs between the groups: no main effects of interactions involving Diagnosis were observed (all P > 0.332). Only the expected main effects of Duration [F(1,32) = 59.202, P < 0.001] and Coherence [F(2.086,66.748) = 36.431, P < 0.001] were observed, reflecting the decrease in participants’ response times during trials with increased Duration or Coherence.
Finally, accuracy showed a strong correlation with autistic symptoms, as measured by individuals’ total Autism Diagnostic Interview-Revised scores, at both the Long (rho = −0.543, P < 0.012, one-tailed) and Short (rho = −0.455, P < 0.038, one-tailed) durations (Fig. 3C). This result again replicates our previous findings (Robertson et al., 2012), indicating that reduced behavioural performance in coherent motion perception is related to clinical measures of autistic symptom severity. However, correlations between performance and the ADOS (another measure of clinical symptomatology) were not observed (all P > 0.418).
Figure 3.
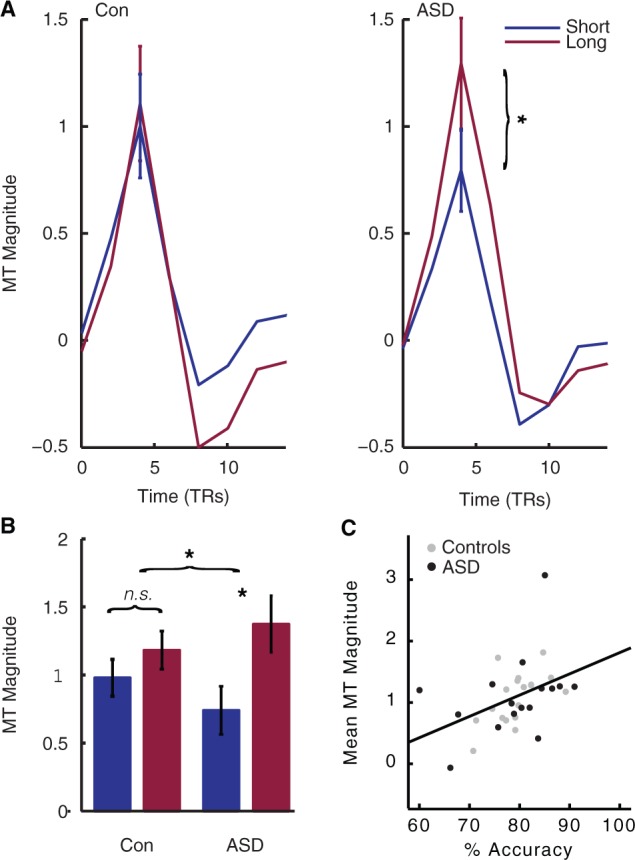
Increased effect of viewing duration on the middle temporal (MT) area response in ASD. The primary motion processing area of the brain, hMT+, evidenced a severely attenuated response at short, as compared to long, viewing durations in ASD, as compared to controls. This finding mirrors our behavioural finding of an increased effect of viewing duration on accuracy in ASD. (A) Mean tent function estimates of the time course of hMT+ response to each trial, averaged across all coherences and individuals, are plotted for illustration. (B) hMT+ magnitude was markedly affected by viewing duration in ASD, resulting in a significant interaction between Stimulus Duration and Diagnosis. Here, beta values estimated by a standard generalized linear model are plotted for each group and duration, averaged across all coherences and individuals. (C) hMT+ magnitude strongly correlates with accuracy. TRs = repetition times. In all plots, error bars represent 1 SEM. *P < 0.05, difference between the two groups.
Atypical neural circuit underlying global motion perception in autism
We next investigated the neural correlates of this exaggerated impact of stimulus duration and coherence on coherent motion perception in ASD. We first established the shape of the response to motion presentation was robust (Figs 3A, 4A and 5A). Given the robust and typical haemodynamic responses, we then deconvolved using an assumed response function to increase power. We subsequently conducted a four-way repeated-measures ANOVA, with ‘Region of interest’ (V1, hMT+ and intraparietal sulcus), ‘Coherence’, and ‘Duration’ as repeated measures factors and ‘Diagnosis’ as a between-subjects factor, on the responses of each region of interest during global motion perception judgements. We first report the effects of our manipulation on the motion circuit that were common to both groups, before turning to effects that differentiated ASD and control participants.
Figure 4.
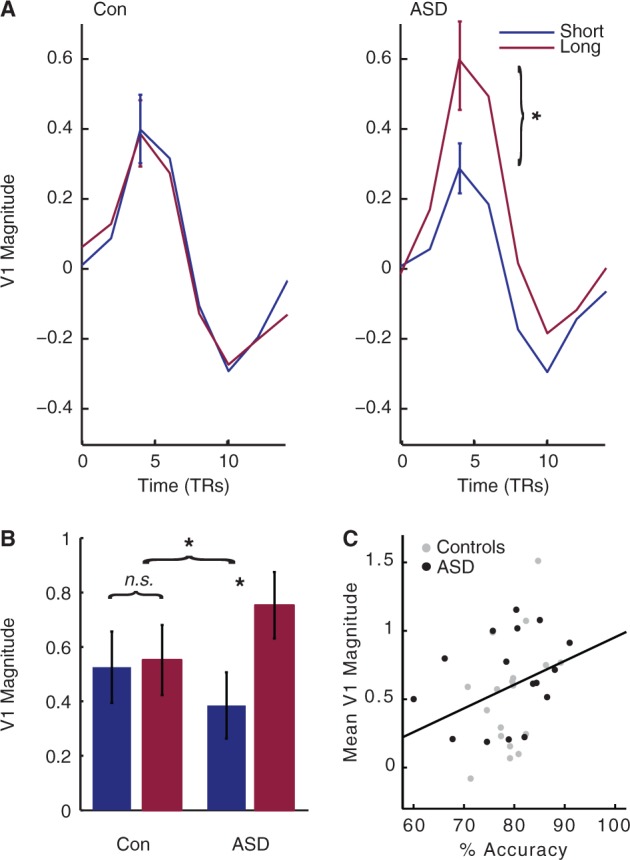
Increased effect of viewing duration on V1 response in ASD. Like the middle temporal area, the primary visual area of the brain, V1, evidenced a severely attenuated response at short, as compared to long, viewing durations in ASD, as compared to controls. This finding mirrors our behavioural finding of an increased effect of viewing duration on behavioural performance in ASD, and suggests that global motion perception deficits in autism are reflected as early as primary visual cortex. (A) Mean tent function estimates of the time course of V1 response to each trial, averaged across all coherences and individuals, are plotted for illustration. (B) V1 magnitude was markedly affected by viewing duration in ASD, resulting in a significant interaction between Stimulus Duration and Diagnosis. Here, beta values estimated by a standard generalized linear model are plotted for each group and duration, averaged across all coherences and individuals. (C) V1 magnitude strongly correlates with accuracy. TRs = repetition times. In all plots, error bars represent 1 SEM. *P < 0.05, difference between the two groups.
Figure 5.
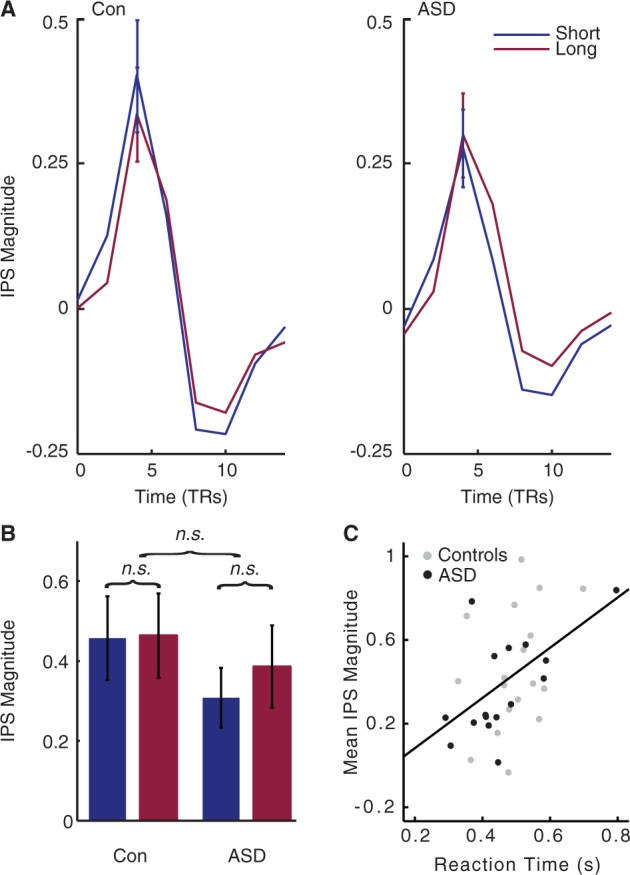
No effect of viewing duration on intraparietal sulcus (IPS) response. Unlike the middle temporal area and V1, the parietal region of the decision-making circuit evidenced comparable activity between individuals with and without ASD. (A) Mean tent function estimates of the time course of intraparietal sulcus response to each trial, averaged across all coherences and individuals, are plotted for illustration. (B) The intraparietal sulcus magnitude shows no effect of Viewing Duration or Diagnosis. Here, beta values estimated by a standard generalized linear model are plotted for each group and duration, averaged across all coherences and individuals. (C) Intraparietal sulcus magnitude strongly correlates with reaction time. TRs = repetition times.
This analysis revealed a main effect of Region of interest [F(2,48.490) = 40.093, P < 0.001], and Duration [F(1,34) = 28.916, P < 0.001]. However, these main effects were qualified by a Region of interest × Duration interaction [F(1.711,58.190) = 9.252, P < 0.001]. Post hoc analyses revealed a main effect of Duration in hMT+ [F(1,34) = 16.960, P < 0.001; Fig. 3A and B] and V1 [F(1,34) = 10.785, P < 0.005; Fig. 4A and B], driven by heightened responses to longer stimulus durations. This effect was absent in intraparietal sulcus [F(1,34) = 0.454, P > 0.505; Fig. 5A and B]. These results indicate that our Duration manipulation primarily modulated activity in early visual areas of the motion circuit.
Although a main effect of Coherence was not observed [F(2.749,93.462) = 1.393, P < 0.251], an interaction between Region of interest and Coherence was [F(5.590,190.072) = 7.694, P < 0.001]. This result was driven by a significant main effect of Coherence in hMT+ [F(2.922,99.354) = 5.299, P < 0.002], where activity rose with increasing coherence in the display. This effect is in keeping with extant literature on the middle temporal area, which is known to be strongly modulated by motion coherence (Rees et al., 2000), and was not observed in V1 [F(3.054,103.850) = 0.532, P > 0.664] or intraparietal sulcus [F(4,136) = 0.239, P > 0.076].
A main effect of Diagnosis was not observed [F(1,34) = 0.143, P < 0.707], indicating that activity in the global motion-processing circuit was not altered overall in ASD. Critically, however, we did observe interactions between Duration × Diagnosis [F(1,34) = 11.293, P < 0.002] and Region of interest × Duration × Diagnosis [F(2,68) = 3.225, P < 0.046], indicating that Duration differentially influenced the global motion processing circuit in ASD. No other interactions were observed (all P > 0.178).
To further investigate the differential contributions of each component of our neural circuit to atypical global motion processing in ASD, we next conducted separate two-way ANOVAs within each region of interest. Briefly, our results strongly implicate early visual areas of the autistic brain in atypical global motion processing in ASD.
Activity in primary motion and visual areas shows greater effect of duration in autism, and correlates with accuracy
In hMT+ there was a much stronger effect of Duration in ASD than control participants (Fig. 3A and B), as revealed by a highly significant Duration × Diagnosis interaction [F(1,34) = 6.218, P < 0.018]. This finding mirrors our behavioural findings, suggesting the middle temporal area as a source of the observed behavioural differences. No main effect of Diagnosis was observed [F(1,34) = 0.047, P < 0.830], indicating that activity in the primary motion area is not altered overall in individuals with ASD, but is specifically affected by our parametric modulation of available motion evidence.
Activity in V1 bore striking resemblance to that of hMT+. Again, shortening stimulus viewing duration had an exaggerated impact on V1 response in ASD, as illustrated by a highly significant Duration × Diagnosis interaction [F(1,34) = 8.076, P < 0.008] (Fig. 4A and B). This finding suggests that the increased effect of Duration on activity characterizes both early components of the motion circuit in ASD.
The pattern of activity in V1 and hMT+ not only qualitatively mirrored our behavioural findings, but also predicted behavioural performance within and across both groups. Mean hMT+ and V1 activity both correlated with mean accuracy (middle temporal:rho = 0.496, P < 0.003; V1: rho = 0.370, P < 0.031, two-tailed) (Figs 3C and 5C) but not response times (both P > 0.10), where higher activity in these early visual areas predicted better accuracy. Qualitatively similar results were observed when correlations were computed for each group separately. These results indicate that our individual magnitude estimates in hMT+ and V1 were related to individuals’ behavioural performance during coherent motion perception. In sum, we demonstrate that patterns of activity in V1 and hMT+ reflect the increased effect of Duration observed on the behavioural performance of participants with ASD.
Activity in the middle temporal area is differentially affected by stimulus coherence in autism
As noted above, hMT+ also showed a strong effect of Coherence [F(2.922,99.354) = 5.299, P < 0.002]. Specifically, activity rose with increasing coherence in the display, in keeping with the extant literature on a monotonic increase in hMT+ activity with increasingly coherent motion (Rees et al., 2000) and paralleling the rise in accuracy with Coherence observed in our behavioural data. Critically, although no Coherence × Diagnosis interaction was observed in hMT+ [F(4,136) = 0.196, P < 0.940], a Duration × Coherence × Diagnosis interaction was observed [F(4,136) = 2.574, P < 0.040]. Repeated measures ANOVAs at each Duration revealed a trend towards a sharper rise in hMT+ response with Coherence in the ASD group at the long Duration [F(4,136) = 2.418, P < 0.07], mirroring the sharper rise in accuracy with increasingly coherent motion in ASD.
Parietal activity shows no effect of stimulus duration, but correlates with response time
In contrast to the findings in V1 and hMT+, the intraparietal sulcus ANOVA revealed no interactions involving Diagnosis (all P > 0.548) (Fig. 5A and B). These results indicate that the response of intraparietal sulcus is not atypical in ASD. However, activity in this region did show strong correlation with individuals’ behavioural performance. Specifically, although intraparietal sulcus activity did not reflect individual variation in accuracy (rho = 0.170, P > 0.335, two-tailed), as was the case in the middle temporal area and V1, higher intraparietal sulcus activity strongly predicted slower reaction times across individuals (rho = 0.473, P < 0.005, two-tailed). A similar trend towards slower reaction times and higher intraparietal sulcus activity was also observed when each group was investigated separately. These results are consistent with our a priori selection of this region of interest as involved in task performance.
In sum, unlike V1 and hMT+, intraparietal sulcus activity did not reflect the increased effect of stimulus duration on coherent motion processing in ASD. This finding is consistent with the hypothesis that autistic global perceptual differences are best attributed to atypical responses to local motion signals in early visual areas of the brain.
Group analysis
The location of middle temporal (Huk et al., 2002) and the configuration of the calcarine sulcus (Benson et al., 2012) varies widely between individuals. Predictably therefore, our group analysis produced qualitatively similar, but less robust results than our hypothesis-driven region of interest analysis. Specifically, although effects of Duration were observed (in the area of V1 and hMT+), no effects involving Diagnosis were observed (threshold: P < 10−4). At a more liberal threshold (P < 0.001), Duration × Diagnosis interactions were observed in the area of V1 and hMT+. Future studies with more detailed mapping of visual cortex may be required to examine other visual areas beyond our hypothesized regions of interest.
Discussion
Focusing on an archetypal example of global perception, coherent motion processing, we demonstrate that autistic differences in global perception can be observed at the earliest stages of cortical visual processing. Behaviourally, performance in ASD demonstrated an exaggerated rise with the strength of local motion signals in the display (coherence) as well as the amount of time available to integrate these local motion signals into a global percept (stimulus duration), replicating our previous findings (Robertson et al., 2012). Functionally, early visual areas of the autistic brain, V1 and hMT+, also showed a greater impact of reducing stimulus duration, suggesting that atypical visual processing of local visual elements underlies this robust autistic deficit in global visual processing. Further, the activity within these early visual areas predicted individuals’ behavioural performance as well as autistic symptomatology measured at more complex levels of behaviour. These results suggest that there is no unaffected level of autistic visual processing, arguing strongly against a specific deficit in integration.
Atypical primary visual signalling underlies autistic global motion deficits
By attributing this autistic global perceptual deficit to differences in primary visual processing, these findings speak to a long-standing theoretical debate in autism research. Although global perceptual deficits have long been reported in the disorder (Shah and Frith, 1983; Plaisted et al., 1998), it is unknown whether these deficits arise from a specific perturbation of neural processes that integrate local sensory information into coherent percepts (Frith, 1989), or a general perturbation in the neural processes which detect and represent local visual information (Spencer et al., 2000; Milne et al., 2002, 2006 for a review).
In the case of coherent motion processing, these two processing stages are neuroanatomically distinct, allowing us to examine whether atypical processing is first evident in early visual areas of the brain, V1 and hMT+, which detect moment-to-moment motion signals in the environment (Mikami et al., 1986; Snowden et al., 1991), or parietal cortex, where such signals are integrated over space and time towards a decision-variable (Shadlen and Newsome, 2001). Our functional MRI results provide strong evidence for altered basic visual processing in ASD (V1 and hMT+), which limits the rate at which local motion signals can be integrated into a global percept.
Importantly, perturbations in early visual processing do not preclude differences in later integration of these motion signals into a decision-variable. Although our imaging data did not reveal any differences in the activity of intraparietal sulcus, this might be due to our use of fixed duration stimuli: blood oxygen level-dependent response in intraparietal sulcus may be more likely to reflect decision-formation when participants may respond whenever they are ready to make their decision, and potentially disengage from the stimulus thereafter (Kayser et al., 2010). We chose to employ a fixed duration task to control for the potential effects of attentional disengagement on visual responses in V1 and hMT+. Future work is needed to firmly establish how instabilities in basic visual processing affect the formation of a decision-variable in the autistic intraparietal sulcus. Further, because our results are correlative, it remains to be firmly established whether atypical engagement with global motion stimuli drives atypical neural responses in ASD, or whether atypical evoked responses to motion stimuli drive differences in autistic performance.
Potential neurobiological origins of atypical visual signalling in autism
Atypical response to motion signals in ASD in early visual areas may be indicative of a low-level perturbation in the neural circuitry of the autistic visual cortex. Two aspects of our findings might offer insight into such a perturbation. First, we observed an exaggerated impact of stimulus duration in ASD, which may reflect an atypical temporal profile of visual response. Second, we observed a sharper rise in accuracy with coherence in ASD, as well as a concomitant effect on hMT+ activity, which may reflect a perturbation of its local opponent inhibition (Born and Bradley, 2005).
One synaptic perturbation that could potentially underlie both of these alterations is an imbalance in the ratio of excitatory/inhibitory neural transmission. Decreasing GABAergic inhibitory activity has been shown to lengthen temporal receptive fields in the tadpole (Shen et al., 2011) and reduce direction selectivity in early visual areas of the mammalian brain, including the middle temporal area (Sillito, 1975; Thiele et al., 2004). The hypothesis that an excitation-dominant synaptic balance may characterize autism is supported by numerous lines of autoradiographic (Blatt et al., 2001; Fatemi et al., 2009), computational (Vattikuti and Chow, 2011), and post-mortem findings in ASD (Casanova et al., 2006). Such an imbalance might also underlie other low-level differences observed in autism, including reduced reliability in the response to repeated presentation of motion stimuli (Milne, 2011; Dinstein et al., 2012) and larger population receptive field estimates in extrastriate cortex, including hMT+ (Schwarzkopf et al., 2014). A low-level perturbation in synaptic balance also accords with the suggestion of Bertone et al. (2005) that lateral and/or feedback connectivity within and/or between low-level visual areas may be perturbed in the autistic brain. This theory follows from the behavioural finding that visual perception in autism is reduced for ‘complex’ (texture-defined) compared to ‘simple’ (luminance-defined) motion stimuli (Bertone and Faubert, 2003), the former of which may tax such lateral and long-range interactions to a greater degree than the latter (Bertone et al., 2005).
Alternatively, atypical responses to motion in V1 and hMT+ might arise from differences in attention, rather than a local synaptic perturbation in visual cortex. Our previous research has demonstrated a sharper fall-off in visual performance relative to the locus of spatial attention in ASD (Robertson et al., 2013a), and superior performance on visual search tasks has also been reported (Plaisted et al., 1998; but see Grubb et al., 2013). A narrower focus of attention would lead to limited spatial sampling of motion signals and require longer exposure durations or more coherence to form a global decision (Dakin and Frith, 2005; Ronconi et al., 2012). Such a difference could also contribute to our functional MRI result as well, potentially producing lower responses in visual cortex during short exposure durations. In sum, whether indicative of alterations in the local circuitry of the visual cortex or the distribution of visual attention, our findings demonstrate atypical responses in the earliest stages of visual processing of the autistic brain.
Our results establish that abnormalities in visual motion processing are manifest in the autistic brain as early as V1. However, most low-level measures of visual sensitivity, such as acuity (Tavassoli et al., 2011), contrast discrimination (Koh et al., 2010), and flicker detection (Bertone et al., 2005; Pellicano et al., 2005) are typical in ASD. Therefore, any synaptic perturbation characterizing the autistic cortex must not be dramatic enough to perturb all levels of visual processing. Our study did not directly compare magno- and parvo-cellular processing circuits, which are sometimes posited to be differentially affected in ASD (Sutherland and Crewther, 2010; Greenaway et al., 2013). In fact, we used high-contrast motion stimuli, which animal lesion studies suggest may recruit both processing circuits (Merigan et al., 1991). Future studies should address whether autistic deficits in motion integration can be selectively attributed to perturbations in magno- or parvo-cellular processing.
Previous coherent motion processing findings in autism
Within the behavioural literature, both strengths (Koldewyn et al., 2010) and weaknesses (Spencer et al., 2000) have been reported. One possible resolution to these mixed results is that individuals with and without ASD are sometimes compared when sensory evidence is ample, and other times when sensory evidence is weak (short stimulus durations and/or low coherence), where global motion deficits become prominent in ASD. Our previous findings lend support to this argument (Robertson et al., 2012), as do two other recent findings: autistic deficits in coherent motion perception have been reported when the speed of local motion signals was slow (1.5°/s), as opposed to fast (6°/s) (Manning et al., 2013); and diminished performance in typical individuals with high Autism Quotients have also been reported when dot lifetime was limited, as opposed to ‘infinite’ (traveling the full expanse of the screen) (Sutherland and Crewther, 2010). In keeping with this hypothesis, the two previous functional MRI investigations of autistic coherent motion perception used relatively high motion strength and reported neither behavioural differences nor significant functional differences in autistic area hMT+ (Brieber et al., 2010; Koldewyn et al., 2011). Our results (see also Robertson et al., 2012) suggest that global perception in ASD is not a simple binary strength or deficit: the ability to aggregate local motion signals towards a global percept appears intact in ASD, but exhibits an increased dependence on the strength of motion signals.
Conclusion
We have demonstrated that autistic coherent motion perception deficits are associated with atypical processing of motion signals in early visual areas of the brain, rather than intact basic processing and a specific deficit in decision-formation or high-level integration. These results suggest a low-level and perhaps systemic perturbation of autistic neural circuitry. Interestingly, autistic perceptual abnormalities often predict higher-order measures of autistic symptom severity, both across the general population (Robertson and Simmons, 2012; Robertson et al., 2013a) and within autistic populations (Atkinson, 2009; Robertson et al., 2013a, b). Future work should investigate whether a common alteration in neural circuitry might underlie both perceptual and cognitive levels of autistic symptomatology.
Funding
This work was supported by the Intramural Research Program of the National Institute of Mental Health under grant numbers 1-ZIA-MH002893-07 and 1-ZIA-MH002920-04. Ethics approval for this study was granted by the NIH Combined Neuroscience Institutional Review Board under protocol number 10-M-0027. We gratefully acknowledge the Gates-Cambridge Trust and the NIH-Cambridge Fellowship (C.E.R.). S.B-C. was supported by the MRC, the Autism Research Trust, and the Wellcome Trust during the period of this work. We declare no competing financial interests.
Acknowledgements
We thank Mike Shadlen, Roozbeh Kiani, Daniel Wolpert, Kate Plaisted-Grant, Kami Koldewyn, and Jan Freyberg for helpful discussion and comments, and Eunice Dixon, Rich Roberson, and Lauren Kenworthy for help with recruitment.
Glossary
Abbreviations
- ASD
autism spectrum disorders
- ADOS
Autism Diagnostic Observation Schedule
- hMT+
middle temporal area
- V1
primary visual cortex
References
- Atkinson AP. Impaired recognition of emotions from body movements is associated with elevated motion coherence thresholds in autism spectrum disorders. Neuropsychologia. 2009;47:3023–9. doi: 10.1016/j.neuropsychologia.2009.05.019. [DOI] [PubMed] [Google Scholar]
- Behrmann M, Avidan G, Leonard GL, Kimchi R, Luna B, Humphreys K, et al. Configural processing in autism and its relationship to face processing. Neuropsychologia. 2006;44:110–29. doi: 10.1016/j.neuropsychologia.2005.04.002. [DOI] [PubMed] [Google Scholar]
- Benson NC, Butt OH, Datta R, Radoeva PD, Brainard DH, Aguirre GK. The retinotopic organization of striate cortex is well predicted by surface topology. Curr Biol. 2012;22:2081–5. doi: 10.1016/j.cub.2012.09.014. [DOI] [PMC free article] [PubMed] [Google Scholar]
- Bertone A, Faubert J. How is complex second-order motion processed? Vision Res. 2003;43:2591–601. doi: 10.1016/s0042-6989(03)00465-6. [DOI] [PubMed] [Google Scholar]
- Bertone A, Mottron L, Jelenic P, Faubert J. Enhanced and diminished visuo-spatial information processing in autism depends on stimulus complexity. Brain. 2005;128:2430–41. doi: 10.1093/brain/awh561. [DOI] [PubMed] [Google Scholar]
- Blatt GJ, Fitzgerald CM, Guptill JT, Booker AB, Kemper TL, Bauman ML. Density and distribution of hippocampal neurotransmitter receptors in autism: an autoradiographic study. J Autism Dev Disord. 2001;31:537–43. doi: 10.1023/a:1013238809666. [DOI] [PubMed] [Google Scholar]
- Born RT, Bradley DC. Structure and function of visual area MT. Annu Rev Neurosci. 2005;28:157–89. doi: 10.1146/annurev.neuro.26.041002.131052. [DOI] [PubMed] [Google Scholar]
- Brainard DH. The psychophysics toolbox. Spat Vis. 1997;10:433–6. [PubMed] [Google Scholar]
- Brieber S, Herpertz-dahlmann B, Fink GR, Kamp-becker I, Remschmidt H, Konrad K. Coherent motion processing in autism spectrum disorder (ASD): an fMRI study. Neuropsychologia. 2010;48:1644–51. doi: 10.1016/j.neuropsychologia.2010.02.007. [DOI] [PubMed] [Google Scholar]
- Britten KH, Shadlen MN, Newsome WT, Movshon JA. The analysis of visual motion: a comparison psychophysical performance of neuronal and psychophysical performance. J Neurosci. 1992;12:4745–65. doi: 10.1523/JNEUROSCI.12-12-04745.1992. [DOI] [PMC free article] [PubMed] [Google Scholar]
- Casanova MF, van Kooten IA, Switala AE, van Engeland H, Heinsen H, Steinbusch HW, et al. Minicolumnar abnormalities in autism. Acta Neuropathol. 2006;112:287–303. doi: 10.1007/s00401-006-0085-5. [DOI] [PubMed] [Google Scholar]
- Cox RW. AFNI: software for analysis and visualization of functional magnetic resonance neuroimages. Comput Biomed Res. 1996;29:162–73. doi: 10.1006/cbmr.1996.0014. [DOI] [PubMed] [Google Scholar]
- Dakin S, Frith U. Vagaries of visual perception in autism. Neuron. 2005;48:497–507. doi: 10.1016/j.neuron.2005.10.018. [DOI] [PubMed] [Google Scholar]
- Dinstein I, Heeger DJ, Lorenzi L, Minshew NJ, Malach R, Behrmann M. Unreliable evoked responses in autism. Neuron. 2012;75:981–91. doi: 10.1016/j.neuron.2012.07.026. [DOI] [PMC free article] [PubMed] [Google Scholar]
- Fatemi SH, Reutiman TJ, Folsom TD, Thuras PD. GABAa receptor downregulation in brains of subjects with autism. J Autism Dev Disord. 2009;39:223–30. doi: 10.1007/s10803-008-0646-7. [DOI] [PMC free article] [PubMed] [Google Scholar]
- Fischl B, Sereno MI, Dale AM. Cortical surface-based analysis. II: inflation, flattening, and a surface-based coordinate system. Neuroimage. 1999;9:195–207. doi: 10.1006/nimg.1998.0396. [DOI] [PubMed] [Google Scholar]
- Freedman DJ, Assad JA. Experience-dependent representation of visual categories in parietal cortex. Nature. 2006;443:85–8. doi: 10.1038/nature05078. [DOI] [PubMed] [Google Scholar]
- Frith U. Oxford: Basil Blackwell; 1989. Autism: Explaining the enigma. Second Edition; pp. 151–68. [Google Scholar]
- Gold JI, Shadlen MN. The neural basis of decision making. Annu Rev Neurosci. 2007;30:535–74. doi: 10.1146/annurev.neuro.29.051605.113038. [DOI] [PubMed] [Google Scholar]
- Greenaway R, Davis G, Plaisted-Grant K. Marked selective impairment in autism on an index of magnocellular function. Neuropsychologia. 2013;51:592–600. doi: 10.1016/j.neuropsychologia.2013.01.005. [DOI] [PubMed] [Google Scholar]
- Grubb MA, Behrmann M, Egan R, Minshew NJ, Carrasco M, Heeger DJ, et al. Endogenous spatial attention: evidence for intact functioning in adults with autism. Autism Res. 2013;6:108–18. doi: 10.1002/aur.1269. [DOI] [PMC free article] [PubMed] [Google Scholar]
- Happé F, Frith U. The weak coherence account: detail-focused cognitive style in autism spectrum disorders. J Autism Dev Disord. 2006;36:5–25. doi: 10.1007/s10803-005-0039-0. [DOI] [PubMed] [Google Scholar]
- Heekeren HR, Marrett S, Bandettini PA, Ungerleider LG. A general mechanism for perceptual decision-making in the human brain. Nature. 2004;431:859–62. doi: 10.1038/nature02966. [DOI] [PubMed] [Google Scholar]
- Hinds OP, Rajendran N, Polimeni JR, Augustinack JC, Wiggins G, Wald LL, et al. Accurate prediction of V1 location from cortical folds in a surface coordinate system. Neuroimage. 2008;39:1585–99. doi: 10.1016/j.neuroimage.2007.10.033. [DOI] [PMC free article] [PubMed] [Google Scholar]
- Huk AC, Dougherty RF, Heeger DJ. Retinotopy and functional subdivision of human areas MT and MST. J Neurosci. 2002;22:7195–205. doi: 10.1523/JNEUROSCI.22-16-07195.2002. [DOI] [PMC free article] [PubMed] [Google Scholar]
- Kayser AS, Buchsbaum BR, Erickson DT, D’Esposito M. The functional anatomy of a perceptual decision in the human brain. J Neurophysiol. 2010;103:1179–94. doi: 10.1152/jn.00364.2009. [DOI] [PMC free article] [PubMed] [Google Scholar]
- Koh HC, Milne E, Dobkins K. Spatial contrast sensitivity in adolescents with autism spectrum disorders. J Autism Dev Disord. 2010;40:978–87. doi: 10.1007/s10803-010-0953-7. [DOI] [PubMed] [Google Scholar]
- Koldewyn K, Jiang Y V, Weigelt S, Kanwisher N. Global/local processing in autism: not a disability, but a disinclination. J Autism Dev Disord. 2013;43:2329–40. doi: 10.1007/s10803-013-1777-z. [DOI] [PMC free article] [PubMed] [Google Scholar]
- Koldewyn K, Whitney D, Rivera SM. The psychophysics of visual motion and global form processing in autism. Brain. 2010;133:599–610. doi: 10.1093/brain/awp272. [DOI] [PMC free article] [PubMed] [Google Scholar]
- Koldewyn K, Whitney D, Rivera SM. Neural correlates of coherent and biological motion perception in autism. Dev Sci. 2011;14:1075–88. doi: 10.1111/j.1467-7687.2011.01058.x. [DOI] [PMC free article] [PubMed] [Google Scholar]
- Lord C, Rutter M, Le Couteur A. Autism diagnostic interview-revised: a revised version of a diagnostic interview for caregivers of individuals with possible pervasive developmental disorders. J Autism Dev Disord. 1994;24:659–85. doi: 10.1007/BF02172145. [DOI] [PubMed] [Google Scholar]
- Lainhart JE, Bigler ED, Bocian M, Coon H, Dinh E, Dawson G, et al. Head circumference and height in autism: a study by the collaborative program of excellence in Autism. Am J Med Genet A. 2006;140:2257–74. doi: 10.1002/ajmg.a.31465. [DOI] [PMC free article] [PubMed] [Google Scholar]
- Manning C, Charman T, Pellicano E. Processing slow and fast motion in children with autism spectrum conditions. Autism Res. 2013;6:531–41. doi: 10.1002/aur.1309. [DOI] [PubMed] [Google Scholar]
- Merigan W, Byrne C, Maunsell J. Does primate motion perception depend on the magnocellular pathway? J Neurosci. 1991;11:3422–9. doi: 10.1523/JNEUROSCI.11-11-03422.1991. [DOI] [PMC free article] [PubMed] [Google Scholar]
- Mikami A, Newsome WT, Wurtz RH. Motion selectivity in macaque visual cortex. I. Mechanisms of direction and speed selectivity in extrastriate area MT. J Neurophysiol. 1986;55:1308–27. doi: 10.1152/jn.1986.55.6.1308. [DOI] [PubMed] [Google Scholar]
- Milne E, Swettenham J, Campbell R. Motion perception and autistic spectrum disorder: a review. Curr Psychol. 2006;23:3–33. [Google Scholar]
- Milne E, Swettenham J, Hansen P, Campbell R, Jeffries H, Plaisted K. High motion coherence thresholds in children with autism. J Child Psychol Psychiatry. 2002;43:255–63. doi: 10.1111/1469-7610.00018. [DOI] [PubMed] [Google Scholar]
- Milne E. Increased intra-participant variability in children with autistic spectrum disorders: evidence from single-trial analysis of evoked EEG. Front Psychol. 2011;2:51. doi: 10.3389/fpsyg.2011.00051. [DOI] [PMC free article] [PubMed] [Google Scholar]
- Palmer J, Huk AC, Shadlen MN. The effect of stimulus strength on the speed and accuracy of a perceptual decision. J Vis. 2005:376–404. doi: 10.1167/5.5.1. [DOI] [PubMed] [Google Scholar]
- Pellicano E, Gibson L, Maybery M, Durkin K, Badcock DR. Abnormal global processing along the dorsal visual pathway in autism: a possible mechanism for weak visuospatial coherence? Neuropsychologia. 2005;43:1044–53. doi: 10.1016/j.neuropsychologia.2004.10.003. [DOI] [PubMed] [Google Scholar]
- Plaisted K, O’Riordan M, Baron-Cohen S. Enhanced visual search for a conjunctive target in autism: a research note. J Child Psychol Psychiatry. 1998;39:777–83. [PubMed] [Google Scholar]
- Rees G, Friston K, Koch C. A direct quantitative relationship between the functional properties of human and macaque V5. Nat Neurosci. 2000;3:716–23. doi: 10.1038/76673. [DOI] [PubMed] [Google Scholar]
- Rinehart NJ, Bradshaw JL, Moss SA, Brereton A V, Tonge BJ. Atypical interference of local detail on global processing in high-functioning autism and Asperger’s disorder. J Child Psychol Psychiatry. 2000;41:769–78. [PubMed] [Google Scholar]
- Robertson AE, Simmons DR. The Relationship between sensory sensitivity and autistic traits in the general population. J Autism Dev Disord. 2012;43:775–84. doi: 10.1007/s10803-012-1608-7. [DOI] [PubMed] [Google Scholar]
- Robertson CE, Kravitz DJ, Freyberg J, Baron-Cohen S, Baker CI. Tunnel vision: sharper gradient of spatial attention in autism. J Neurosci. 2013a;33:6776–81. doi: 10.1523/JNEUROSCI.5120-12.2013. [DOI] [PMC free article] [PubMed] [Google Scholar]
- Robertson CE, Kravitz DJ, Freyberg J, Baron-Cohen S, Baker CI. Slower rate of binocular rivalry in autism. J Neurosci. 2013b;33:16983–91. doi: 10.1523/JNEUROSCI.0448-13.2013. [DOI] [PMC free article] [PubMed] [Google Scholar]
- Robertson CE, Martin A, Baker CI, Baron-Cohen S. Atypical integration of motion signals in autism spectrum conditions. PLoS One. 2012;7:e48173. doi: 10.1371/journal.pone.0048173. [DOI] [PMC free article] [PubMed] [Google Scholar]
- Roitman JD, Shadlen MN. Response of neurons in the lateral intraparietal area during a combined visual discrimination reaction time task. J Neurosci. 2002;22:9475–89. doi: 10.1523/JNEUROSCI.22-21-09475.2002. [DOI] [PMC free article] [PubMed] [Google Scholar]
- Ronconi L, Gori S, Ruffino M, Franceschini S, Urbani B, Molteni M, et al. Decreased coherent motion discrimination in autism spectrum disorder: the role of attentional zoom-out deficit. PLoS One. 2012;7:e49019. doi: 10.1371/journal.pone.0049019. [DOI] [PMC free article] [PubMed] [Google Scholar]
- Schwarzkopf DS, Anderson EJ, De Haas B, White SJ, Rees G. Larger extrastriate population receptive fields in autism spectrum disorders. J Neurosci. 2014;34:2713–24. doi: 10.1523/JNEUROSCI.4416-13.2014. [DOI] [PMC free article] [PubMed] [Google Scholar]
- Schwarzkopf DS, De Haas B, Rees G. Better ways to improve standards in brain-behavior correlation analysis. Front Hum Neurosci. 2012;6:200. doi: 10.3389/fnhum.2012.00200. [DOI] [PMC free article] [PubMed] [Google Scholar]
- Shadlen MN, Newsome WT. Neural basis of a perceptual decision in the parietal cortex (area LIP) of the rhesus monkey. J Neurophysiol. 2001;86:1916–36. doi: 10.1152/jn.2001.86.4.1916. [DOI] [PubMed] [Google Scholar]
- Shah A, Frith U. An islet of ability in autistic children: a research note. J Child Psychol Psychiatry. 1983;24:613–20. doi: 10.1111/j.1469-7610.1983.tb00137.x. [DOI] [PubMed] [Google Scholar]
- Shen W, McKeown CR, Demas JA, Cline HT. Inhibition to excitation ratio regulates visual system responses and behavior in vivo. J Neurophysiol. 2011;106:2285–302. doi: 10.1152/jn.00641.2011. [DOI] [PMC free article] [PubMed] [Google Scholar]
- Sillito AM. The effectiveness of bicuculline as an antagonist of GABA and visually evoked inhibition in the cat’s striate cortex. J Physiol. 1975;250:287–304. doi: 10.1113/jphysiol.1975.sp011055. [DOI] [PMC free article] [PubMed] [Google Scholar]
- Snowden RJ, Treue S, Erickson RG, Andersen R. The response of area MT and V1 neurons to transparent motion. J Neurosci. 1991;11:2768–85. doi: 10.1523/JNEUROSCI.11-09-02768.1991. [DOI] [PMC free article] [PubMed] [Google Scholar]
- Spencer J, O’Brien J, Riggs K, Braddick O, Atkinson J, Wattam-Bell J. Motion processing in autism: evidence for a dorsal stream deficiency. Neuroreport. 2000;11:2765–7. doi: 10.1097/00001756-200008210-00031. [DOI] [PubMed] [Google Scholar]
- Sutherland A, Crewther DP. Magnocellular visual evoked potential delay with high autism spectrum quotient yields a neural mechanism for altered perception. Brain. 2010;133:2089–97. doi: 10.1093/brain/awq122. [DOI] [PubMed] [Google Scholar]
- Tavassoli T, Latham K, Bach M, Dakin SC, Baron-Cohen S. Psychophysical measures of visual acuity in autism spectrum conditions. Vision Res. 2011;51:1778–80. doi: 10.1016/j.visres.2011.06.004. [DOI] [PMC free article] [PubMed] [Google Scholar]
- Thiele A, Distler C, Korbmacher H, Hoffmann K-P. Contribution of inhibitory mechanisms to direction selectivity and response normalization in macaque middle temporal area. Proc Natl Acad Sci USA. 2004;101:9810–5. doi: 10.1073/pnas.0307754101. [DOI] [PMC free article] [PubMed] [Google Scholar]
- Vattikuti S, Chow CC. A computational model for cerebral cortical dysfunction in autism spectrum disorders. Biol Psychiatry. 2011;20:1464–9. doi: 10.1016/j.biopsych.2009.09.008. [DOI] [PMC free article] [PubMed] [Google Scholar]