


Abstract
Transcriptional Regulatory Networks (TRNs) coordinate multiple transcription factors (TFs) in concert to maintain tissue homeostasis and cellular function. The re-establishment of target cell TRNs has been previously implicated in direct trans-differentiation studies where the newly introduced TFs switch on a set of key regulatory factors to induce de novo expression and function. However, the extent to which TRNs in starting cell types, such as dermal fibroblasts, protect cells from undergoing cellular reprogramming remains largely unexplored. In order to identify TFs specific to maintaining the fibroblast state, we performed systematic knockdown of 18 fibroblast-enriched TFs and analyzed differential mRNA expression against the same 18 genes, building a Matrix-RNAi. The resulting expression matrix revealed seven highly interconnected TFs. Interestingly, suppressing four out of seven TFs generated lipid droplets and induced PPARG and CEBPA expression in the presence of adipocyte-inducing medium only, while negative control knockdown cells maintained fibroblastic character in the same induction regime. Global gene expression analyses further revealed that the knockdown-induced adipocytes expressed genes associated with lipid metabolism and significantly suppressed fibroblast genes. Overall, this study reveals the critical role of the TRN in protecting cells against aberrant reprogramming, and demonstrates the vulnerability of donor cell's TRNs, offering a novel strategy to induce transgene-free trans-differentiations.
INTRODUCTION
In any given cell, a set of transcription factors (TFs) is expressed and works in concert to govern cellular homeostasis and function (1). The Transcriptional Regulatory Networks (TRNs) in somatic cells are believed to be robust and act to prevent cells from aberrant plasticity (2). However, recent works have revealed that somatic cells in mammals are more plastic than previously thought (3). Particularly, Takahashi and Yamanaka demonstrated this notion by generating embryonic stem-like cells (or iPSC) from dermal fibroblasts after ectopic expression of Oct4, Sox2, Klf4 and cMyc (4,5). Additionally, increasing numbers of direct cell reprogramming, or trans-differentiations, toward neurons, hepatocytes and cardiomyocytes have also been reported (6–9).
Efficient trans-differentiations are believed to reset the TRN of the original cell type and re-establish the target TRN with a defined set of TFs (10–12). Although numerous examples have shown successful induction of target cell-specific functions and expression, most have largely ignored the involvement of the starting cell type, generally dermal fibroblasts. Several recent examples of (direct) cell reprogramming reported that a large number of fibroblast-specific genes and epigenetic marks remained intact even after inducing cell reprogramming (10–13). These reports suggest that the fibroblast TRN is highly robust and it may act to safeguard the cells from undergoing cell conversions. Therefore, how much the fibroblast-specific network plays a role in ‘inhibiting’ cell reprogramming remains to be elucidated.
To this aim, we first identified 18 fibroblast-enriched TFs based on the compendium of 988 human primary cells and tissues (FANTOM5) (14) and inferred a fibroblast TRN based on the Matrix-RNAi method (15–17). The analysis revealed inter-TF relationships including transcriptional activation/repression, directionality and combinatorial regulation of defined TFs and showed that 7 out of the 18 TFs were highly interconnected and influenced the majority of the fibroblast network. We further demonstrate that by targeting four out of seven major TFs, we could induce adipocyte-like cells in the presence of adipocyte medium without any ectopic expression of TFs. The global expression analysis revealed significant upregulation of adipocyte-specific marker genes and suppression of fibroblast-enriched genes. This study demonstrates the important inhibitory role of fibroblast-specific TFs in maintaining the fibroblast state and that the disruption of the underlying TRN can greatly enhance direct trans-differentiations. This work is part of the FANTOM5 project. Data downloads, genomic tools and co-published manuscripts are summarized at http://fantom.gsc.riken.jp/5/.
MATERIALS AND METHODS
Fibroblast-enriched TFs selection
Out of 988 CAGE human sample dataset (FANTOM5), 41 libraries are classified as fibroblasts from various tissues. To select fibroblast-enriched TFs from FANTOM5 dataset, the mean expression ratio of fibroblast was compared to the mean expression value of all non-fibroblast TFs in the dataset. All promoters with zero tag counts were set to 0.1. TFs for which expression ratio (fold-change) was above 1.5 were selected as candidates for fibroblast-enriched TFs. The human Illumina microarray dataset contained 14 human cell types: NB1RGB fibroblast, mammary epithelial cells (HMEC), keratinocytes (KER), renal epithelial cell (HRE), normal articular chondrocytes derived from the healthy knee joint (NHAC), prostate epithelial cells (PREC), osteocytes (OST), mesenchymal stem cell (MSC), skeletal muscle cells (SMC), MSC-ADP (MSC-derived adipocytes), CD14+ primary monocytes (MON), small airway epithelial cells (SAEC) and induced pluripotent stem (iPS) cells derived from NB1RGB. To select fibroblast-enriched TFs, NB1RGB fibroblast expression data were compared with the data of other 13 cell types one by one to calculate the expression ratio. TFs for which the average expression ratio in fibroblast was >1.5 were selected as candidates of fibroblast-enriched TFs. The intersect of TFs from the FANTOM5 data and Illumina microarray data was chosen as fibroblast-enriched TFs.
Cell culture
NB1RGB, normal human neonatal skin fibroblast cells, and NHDF-Adult, normal human adult skin fibroblasts, were obtained from RIKEN Bioresource Center (Tsukuba, Japan) and Lonza (#CC-2511, Lonza, USA), respectively, and cultured in Minimum Essential Medium alpha (Wako, Japan) supplemented with 10% fetal bovine serum and penicillin/streptomycin (100 U/ml and 100 μg/ml; Invitrogen, USA) at 37°C in a 5% CO2. MSCs (#PT-2501, Lonza, USA) and pre-adipocytes (#PT-5020, Lonza, USA) were cultured and differentiated in accordance with manufacturer's instructions. See section ‘Adipogenic induction’ for details.
siRNA transfection and RNA extraction
Fibroblast cells were seeded in 12-well cell culture plate (Nunc) at a density of 2 × 10⁴ cells/well one day before forward transfection was performed with 50 nM (final concentration) of each stealth small interfering RNA (siRNA), 2.5 μl of Lipofectamine RNAiMAX (Invitrogen, USA) and Opti-MEM (Invitrogen, USA) according to the manufacturer's instructions. Two or more stealth siRNAs (Invitrogen, Carlsbad, CA, USA) were tested for each target gene, and the one giving the highest level of knockdown was used for the Matrix-RNAi analysis. siRNA sequences are listed in Supplementary Table S4. Stealth RNAi negative universal control MED (Invitrogen) was used to calibrate siRNA transfection.
RNAs were extracted with RNeasy mini kit (QIAGEN, Germany) according to the manufacturer's instructions. RNA was quantified with NanoDrop (NanoDrop Technologies, USA). All siRNA transfection experiments were performed in biological quadruplicate.
Quantitative real-time RT-PCR and Matrix-RNAi Analysis
Reverse transcription reaction was performed with PrimeScript RT-PCR Kit (Perfect Real Time, TAKARA BIO) and GeneAmp PCR System 9700 (Applied Biosystems, USA) according to the manufacturer's instructions. Quantitative real-time RT-PCR (qRT-PCR) was performed in 10 μl reaction mixture with SYBR Premix Ex Taq™ (Perfect Real Time, TAKARA BIO) on an ABI 7900 Fast Real-Time PCR System (Applied Biosystems, USA). PCR parameters consisted of heating at 95°C for 10 s, followed by 40 cycles at 95°C for 5 s and at 60°C for 30 s. The relative amount (expression ratio) of the target gene mRNA was normalized to the endogenous GAPDH mRNA using the 2−ΔΔCT methods. Standard deviation (SD) and P-value of ΔΔCT in a total of four biological replicates were calculated using a threshold to select significant transcriptional regulation edges. The cutoff threshold value was arbitrarily defined as 3 SD above the mean and P-value < 0.05. Only significant perturbations that passed the threshold value were used as reliable transcriptional regulation edges for depicting the Matrix-RNAi network. The networks were drawn using Cytoscape. The primer information is summarized in Supplementary Table S4.
Adipogenic induction
Two days post siRNA transfection, culture medium was replaced with supplemented MEM alpha. One day later, transfected cells and MSCs were treated with adipogenic induction medium for three days (IBMX, indomethacin, dexamethasone, insulin; Lonza, PT-3102B/PT-4135) followed by maintenance medium for 4 days (insulin; Lonza, PT-3102A). The adipocyte induction regime was repeated for one more cycle (total two cycles).
Lipid staining and quantification
Knockdown-induced adipocytes (KD-iADP) were generated in 12-well or 24-well plates. Two weeks post adipogenic induction, cells were rinsed with phosphate buffered saline (PBS) and fixed with 4% paraformaldehyde (Merck) in PBS. Lipid droplets and nucleus were stained with LipidTox (Invitrogen) and Hoechst 33342 (Invitrogen), respectively. Stained lipid droplets and nucleus were quantified using the Cellomics ArrayScan Reader XTi (Thermo Scientific). The experiment was repeated three times to assess reproducibility.
Microarray analysis
First- and second-strand cDNA and cRNAs from 500 ng of total RNA were prepared using the Illumina TotalPrep RNA Amplification Kit (Ambion, USA). The concentration of cRNA was measured with NanoDrop (NanoDrop Technologies, USA) and the size distribution of cRNA was evaluated using the Agilent 2100 Bioanalyzer (Agilent Technologies, USA). For gene expression profiling, 500 ng of cRNA was employed for labeling and hybridization using HumanWG-6 v3 Expression BeadChip kit or HumanHT-12 v4 Expression BeadChip Kit according to the manufacturer's instructions. All microarray analysis was performed in biological triplicate. The Illumina microarray dataset was registered at Gene Expression Omnibus (http://www.ncbi.nlm.nih.gov/geo/) at NCBI as accession number GSE44439.
RESULTS
Selection of fibroblast-enriched TFs
Transcription Regulatory Networks (TRNs) are composed of constitutive and cell-specific sub-networks to coordinate biological functions and maintain cellular phenotype (1). In order to infer gene regulatory interactions in fibroblast cells we first identified fibroblast-enriched TFs based on the gene expression data produced by the FANTOM5 consortium (Functional Annotation Of the Mammalian Genome 5), in which 41 out of 988 samples were classified as fibroblasts from various tissues (14,18). The enrichment score for each TF was calculated based on the mean expression of a TF across 41 types of fibroblasts divided by the mean expression across 947 non-fibroblast samples. Fifty TFs showing a fold-change >1.5 and a P-value less than 0.05 were identified as the first set of fibroblast-enriched TFs (Supplementary Table S1). Since NB1RGB, a primary fibroblast cell line previously used for cell reprogramming (10–12), was missing from the FANTOM5 data, we used a similar strategy to select 44 fibroblast-enriched TFs that exhibited an enrichment score >1.5 (P-value < 0.05) between NB1RGB and 13 non-fibroblastic primary cell types based on our microarray expression (Supplementary Table S2). Eighteen TFs, which overlapped between the FANTOM5 selection and the microarray selection, were chosen for further analyses (Table 1).
Table 1. List of 18 fibroblast-enriched transcription factors based on FANTOM5 and microarray gene expression profiles.
| No. | Gene ID | Gene name | Symbol | Enrichment score (FANTOM 5) | Enrichment score (Microarray) |
|---|---|---|---|---|---|
| 1 | 13345 | Twist basic helix-loop-helix transcription factor 2 | TWIST2 | 3.60 | 3.78 |
| 2 | 56956 | LIM homeobox 9 | LHX9 | 3.57 | 1.87 |
| 3 | 283078 | Mohawk homeobox | MKX | 3.23 | 2.79 |
| 4 | 5396 | Paired related homeobox 1 | PRRX1 | 3.00 | 3.08 |
| 5 | 51450 | Paired related homeobox 2 | PRRX2 | 2.67 | 3.66 |
| 6 | 4487 | Msh homeobox 1 | MSX1 | 2.52 | 2.62 |
| 7 | 7291 | Twist basic helix-loop-helix transcription factor 1 | TWIST1 | 2.51 | 1.98 |
| 8 | 130497 | Odd-skipped related 1 (Drosophila) | OSR1 | 2.34 | 1.56 |
| 9 | 10370 | Cbp/p300-interacting transactivator, with Glu/Asp-rich carboxy-terminal domain, 2 | CITED2 | 2.30 | 2.90 |
| 10 | 862 | Runt-related transcription factor 1; translocated to 1 (cyclin D-related) | RUNX1T1 | 2.23 | 2.00 |
| 11 | 297 | Forkhead box D1 | FOXD1 | 1.95 | 3.62 |
| 12 | 6926 | T-box 3 | TBX3 | 1.93 | 1.71 |
| 13 | 4784 | Nuclear factor I/X (CCAAT-binding transcription factor) | NFIX | 1.87 | 1.89 |
| 14 | 3215 | Homeobox B5 | HOXB5 | 1.64 | 2.39 |
| 15 | 3224 | Homeobox C8 | HOXC8 | 1.64 | 4.21 |
| 16 | 4212 | Meis homeobox 2 | MEIS2 | 1.63 | 2.26 |
| 17 | 3223 | Homeobox C6 | HOXC6 | 1.51 | 3.49 |
| 18 | 3221 | Homeobox C4 | HOXC4 | 1.51 | 2.20 |
Building a fibroblastic TRN model by Matrix-RNAi
In order to investigate the gene regulatory relationships among the 18 fibroblast-enriched TFs, we carried out the Matrix-RNAi perturbation analysis where each selected TF was systematically perturbed using siRNA. Subsequently, differential gene expressions of all 18 TFs were measured by means of quantitative RT-PCR (15,16), resulting in an 18-by-18 expression matrix (Supplementary Table S3). Based on the expression analysis, 72 regulatory edges were considered significant (P-value < 0.05 using Student's t-test). Fifty-three edges were activating and 19 were inhibiting (Figure 1A). The ratio of activating-to-inhibiting edges was similar to that of previously reported Matrix-RNAi in human hepatoma cell line, HepG2, and human monoblastic cell line, THP-1 (15,16).
Figure 1.

Establishment of fibroblastic transcriptional regulatory network (TRN) by means of Matrix-RNAi. (A) To reconstruct the fibroblastic TRN, edges with differential expression greater or less than 1.5 log-2 ratio (P-value < 0.05) were selected. Seven nodes with the highest regulatory edges were identified as influential TFs (blue nodes) and the remaining TFs were considered minor nodes (orange). Blue and red edges represent activating and inhibiting regulations, respectively. The thickness of the edges represents the strength of regulation based on the differential gene expression. (B) Scatter plot revealing the numbers of downstream (output) and upstream (input) target genes (four or less target genes in red; five or six target genes in orange; seven or more target genes in purple). (C) A selection of the seven major TFs demonstrating the dense interconnectivities. (D) The first neighboring nodes for the two TFs with the highest number of target genes, PRRX1 and OSR1, covering 11 out of 18 TFs. The sizes of the nodes indicate the number of edges per node.
TRNs are known to have hierarchical topology in discrete layers (19,20). In order to identify TFs with the most regulatory influence in the fibroblast network, the numbers of upstream and downstream target genes were quantified for each of the 18 TFs (Figure 1B). An influential-set, which consists of PRRX1, OSR1, FOXD1, HOXC4, LHX9, TBX3 and TWIST2, targeted five or more TFs in the fibroblast TRN. This influential-set explained 62.5% of the total number of regulatory edges and they collectively targeted 15 out of 18 TFs represented in the network. Upon a closer examination of the fibroblastic network, the interactions among OSR1–PRRX1–TWIST2 were notably coordinated, regulating one another in both directions, possibly working in concert to modulate downstream genes in fibroblasts (Figure 1C). Furthermore, the top two TFs with the highest number of target genes, PRRX1 and OSR1, collectively targeted all TFs in the influential-set, and covered 13 out of 18 TFs in the fibroblast network (Figure 1D). Retrospectively, six out of seven influential TFs were ranked among top 20 in the FANTOM5 list, while the seven TFs were evenly distributed in the microarray list (Supplementary Tables S1 and S2). This seems to suggest that the rich coverage of multiple cell types in the FANTOM5 dataset leads to a more informative set of TFs relevant to the maintenance of fibroblast network.
Combinatorial TF-knockdown destabilizes fibroblast network and assists trans-differentiation toward adipocyte
Because multiple TFs mutually coordinate their activity to implement biological function and to maintain homeostasis (1), we reasoned that the combinatorial knockdown of a defined set of TFs might efficiently disrupt the fibroblastic TRN and broadly downregulate fibroblast genes. Such combinatorial knockdown would further decrease the stability of the fibroblast network where a chemical cocktail may provoke trans-differentiation into neighboring cell types. Since the protocols for adipogenic differentiation from MSCs and pre-adipocytes have been well established (21–23), we investigated the fibroblast-to-adipocyte transition after suppressing the fibroblastic network followed by repeated inductions of IBMX, dexamethasone, indomethacin and insulin, hereby referred to as adipogenic-induction medium (Figure 2A).
Figure 2.
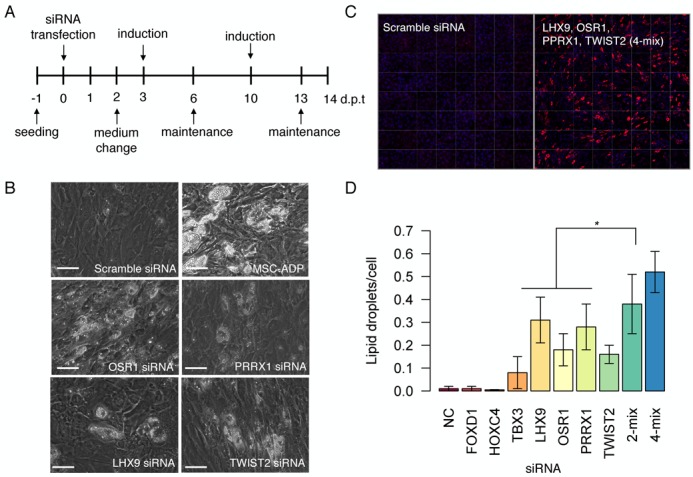
TF-knockdown promotes trans-differentiation from fibroblast to adipocyte. (A) Experimental workflow to generate adipocyte-like cells from fibroblasts by means of siRNA transfection followed by two cycles of adipogenic ‘induction’ medium and ‘maintenance’ medium. (B) Fibroblast cells transfected with scramble siRNA failed to generate lipid droplets while mesenchymal stem cells (MSCs) generated lipid droplets in the presence of adipogenic-induction medium. Knockdown of OSR1, PRRX1, LHX9 and TWIST2 induced adipocyte-like cells characterized by lipid accumulation. (C) For the quantification of lipids, cells were stained with LipidTox (red) and Hoescht (nucleus; blue). (D) The quantification of fluorescently labeled lipid droplets for single TF and combinatorial knockdown using the Cellomics ArrayScan image analysis software. 2-mix (OSR1 and PRRX1); 4-mix (LHX9, OSR1, PRRX1 and TWIST2). * denotes that 4-mix knockdown was statistically significant compared to individual TF transfections (Student's t-test P-value < 0.05). Scale bars = 50 μm.
Adipogenesis is accompanied by a clear change in morphology along with the formation of lipid droplets, which can be observed under the standard phase-contrast microscope without additional preparation. In case of MSCs, a progenitor of adipocytes, the cells can efficiently differentiate into adipocytes possessing lipid droplets after 10 days of adipogenic induction medium (MSC-ADP; Figure 2B). In case of scramble siRNA transfected fibroblasts, no lipid formation was observed even when the cells were continuously stimulated with the same adipogenic medium (Figure 2B). Thereafter, we sought to test whether suppression of fibroblast network by means of siRNA knockdown can promote adipogenesis. All aforementioned 18 TFs were individually knocked down using siRNA followed by adipogenic-induction medium. After one week, we readily observed lipid droplet accumulations only when OSR1, PRRX1, LHX9 or TWIST2 was depleted (Figure 2B) but very few or no adipocytes were observed for the other 14 TFs (Supplementary Figure S1). Because TFs often work in concert to maintain TRN, we combined PRRX1 and OSR1 (2-mix) and PRRX1, OSR1, LHX9 and TWIST2 (4-mix) and transfected fibroblasts followed by adipogenic-induction medium. Remarkably, when we quantified the number of accumulated lipids based on fluorescent labeling (Figure 2C), we observed a significant increase in the number of lipid droplets in the 4-mix combination when compared to individual knockdowns (Figure 2D). Furthermore, when the 2-mix and 4-mix combinations were ectopically expressed in MSCs, the formation of adipocytes was significantly reduced when compared to the vector control (Supplementary Figure S2). These loss-of-function and gain-of-function analyses strongly suggest that the fibroblastic network plays an important role in ‘locking’ the cells in their native state, protecting the cells from aberrant transformations. To avoid any batch effects, we could also induce lipid droplet accumulation in dermal fibroblasts derived from a different individual (normal human dermal fibroblasts—adult; Supplementary Figure S3).
Gene expression profile of adipocyte-like cells
To further characterize the 4-mix KD-iADP, we performed genome-wide transcription profiling to explore the global gene expression patterns of TF-suppressed fibroblasts with/without adipogenic-induced medium. The number of differentially regulated genes was significantly larger in KD-iADP cells when compared to cells with the suppressed fibroblast network without adipogenic induction (KD-FIB) and control fibroblast cells treated only with adipogenic-induction medium (NC-iADP) (adjusted P-value < 0.05; Figure 3A). Furthermore, several key adipocyte genes, such as PPARG, LEPR and FABP4, were significantly upregulated only in KD-iADP after 2 weeks of cultivation (Figure 3B). Gene ontology analysis further revealed that the combination of network suppression and adipogenic induction enhanced genes involved in lipid, fatty acid, coenzyme, and steroid metabolic processes, while the other conditions led to few or none of adipocyte-related genes (Figure 3C). Interestingly, KD-iADP cells also downregulated a large proportion of fibroblast genes such as TGFB2, COL5A1, FAP and MMP10 where the genes associated with developmental processes and muscle organ development were significantly suppressed (Supplementary Figure S4).
Figure 3.

Genome-wide transcriptome expression analysis of knockdown-induced adipocytes. (A) Differentially expressed Illumina microarray probes after TRN knockdown (KD-FIB) and adipogenic induction in fibroblasts (NC-iADP) and both TRN knockdown and adipogenic induction (KD-iADP; Benjamin–Hochberg multiple testing P-value < 0.05). (B) Induction of adipocyte-specific marker genes in KD-FIB, NC-iADP and KD-iADP. Each gene was independently validated by qRT-PCR. (C) Gene ontology analysis reveals increase in gene expression involved in adipocyte functions such as lipid, fatty acid and steroid metabolic processes in KD-iADP 2 weeks post transfection.
Genome-wide expression comparison of knockdown-induced adipocytes to bona fide adipocytes
In order to further understand the transition of KD-iADP cells relative to other sources of adipocytes, we additionally performed genome-wide transcriptional profiling including pre-adipocytes and MSCs. The principal component analysis (PCA) revealed that KD-iADP positioned in line with the pre-adipocyte differentiation pathway rather than the MSC differentiation pathway after 2 weeks (Figure 4A). These results suggest that KD-iADP may be an intermediate of pre- and mature adipocytes, indicating that a prolonged cultivation of these cells may induce a more mature form of adipocytes. In order to further assess the degree of trans-differentiation, we analyzed the number of differentially regulated genes for network-suppressed cells (KD-FIB), adipogenic-induced cells (NC-iADP), and both network-suppressed and adipogenic-induced (KD-iADP) cells, and compared them to genes which were highly expressed in either pre-adipocytes, mature adipocytes, or MSC and MSC-derived adipocytes when compared to fibroblasts (Figure 4B). Notably, KD-iADP cells induced more than 55% of genes expressed in mature adipocytes as well as in MSC-derived adipocytes, while a smaller portion of the induced genes overlapped with the pre-adipocytes and MSCs. It is important to note that the knockdown and the induction medium alone failed to prompt adipocyte-associated genes in fibroblasts, and that no significant MSC genes were induced, suggesting that the transition is a direct process. However, adipogenic-induction medium alone could lead to a significant downregulation of fibroblast genes when compared to pre-adipocytes, where the combined knockdown and the induction medium led to a slightly more downregulation of fibroblast genes (Figure 4C).
Figure 4.

Comparison of KD-iADP cells with adipocytes. (A) Principal component analysis (PCA) of MSC-differentiation time course (orange), pre-adipocytes to mature adipocytes differentiation (dark red) and perturbed fibroblasts (blue) reveal that KD-iADP align with the pre-adipocyte differentiation pathway. Each circle represents a single microarray experiment and each condition is profiled in triplicates. (B) Quantification of upregulated genes in KD-iADP reveals significant induction of genes that are highly specific in mature adipocytes. (C) Conversely, large numbers of fibroblast genes were downregulated in NC-iADP and KD-iADP. The combination of knockdown and induction leads to a greater suppression of fibroblast genes.
DISCUSSION
In this study, we identified 18 fibroblast-enriched TFs based on the large collection of human gene expression database (FANTOM5) and inferred the TRN of human dermal fibroblasts using the Matrix-RNAi approach. We identified PPRX1, OSR1, TWIST2 and LHX9 to be highly interconnected in the fibroblastic TRN and showed that disrupting the fibroblast TRN by means of siRNA transfection allowed for the induction of adipocyte-like cells in the presence of an adipogenic medium. The KD-iADP expressed major adipocyte regulatory factors such as PPARG2 and CEBPA endogenously, while key fibroblast-specific genes were broadly downregulated after prolonged cultivation. Such a transient disruption of fibroblast TRN may be a suitable strategy for future reprogramming approaches.
Several approaches to enhance trans-differentiations have been published where the authors overexpressed four iPSC factors to partially reprogram fibroblasts into a ‘plastic’ state and induced trans-differentiation by stimulating the cells with a cocktail of small molecule compounds designed for various target cells (24). However, these models rely largely on the ectopic expression of virus-mediated transgenes, which can integrate into the genome (25–27). In contrary, we demonstrated that trans-differentiation could be achieved without the need of ectopic expression of transgenes. The chemical/cytokine cocktail of IBMX, indomethacin, dexamethasone and insulin was sufficient to drive adipocyte trans-differentiation only after the disruption of the fibroblast network.
The siRNA transfection is an ideal strategy for cell reprogramming due to their transient properties in the host cell (28,29). Interestingly, our data suggest that a prolonged cultivation of siRNA transfection (3 weeks) can maintain adipocyte-specific expression and phenotype. This suggests that the temporary suppression of the fibroblast TRN was sufficient to allow fibroblasts to overcome the cellular barrier and transit into a new state. However, because adipocytes and fibroblasts share the same mesenchymal lineage, a more stable suppression of the fibroblast TRN may promote efficient trans-differentiation into non-mesenchymal lineages.
Interestingly, we observed that the adipogenic-induction cocktail alone failed to induce PPARG2 expression, thus no lipid accumulation in putative fibroblast cells. PPARG2 plays a pivotal role in adipocyte differentiation and trans-differentiation (30). Ectopic expression of PPARG2 in conjunction with CEBPA was reported to induce a significant transformation into adipocyte-like cells in mouse embryonic fibroblasts (31–33). More recently, we observed that PPARG2 overexpression in human dermal fibroblasts induced far less adipocytes than in MSCs (11). Moreover, stable expression of fibroblastic TRN led to an inhibition of adipogenesis (Supplementary Figure S2). Collectively, this study demonstrates that the fibroblast TRN is more robust (i.e. resistant to change) than the MSC TRN, suggesting the existence of safeguard mechanisms in fully differentiated somatic cells to prevent aberrant trans-differentiations. Strikingly, the combination of both disruption of the fibroblast TRN and the chemical-based adipogenic induction led to endogenous activations of several key drivers of adipocyte network, namely PPARG2 and CEBPA (Figure 3B). It is possible that disrupting the fibroblastic TRN may broadly modify the epigenetic landscape of fibroblast cells, exposing the promoter regions of key adipocyte promoters, such as PPARG, for transcriptional activation (34), and only in combination with induction medium where compounds such as dexamethasone can induce wide range of epigenetic modifications and activate gene expression and differentiation (35). Thus, a synergistic role of the network disruption and the addition of chemical agents may be essential to induce transgene-free cell reprogramming.
We present the fibroblast-enriched TF set from the largest expression dataset (FANTOM5) and present the fibroblastic TRN model built by Matrix-RNAi. Moreover, we showed the first evidence that specifically targeting the TRN of fibroblasts promotes adipogenic trans-differentiation in the presence of a defined chemical cocktail without the need of ectopic expression. Therefore, targeting the gene regulatory network provides a novel strategy to induce or enhance cellular reprogramming pathways.
Supplementary Data
Supplementary Data are available at NAR Online.
Acknowledgments
We thank Christophe Simon for his comments and critical reading of the manuscript, and Mami Kishima and Noriko Ninomiya for experimental support.
Authors' contributions: Y.T. designed and carried out experiments, and analyzed and wrote the paper. R.H. and J.W.S. carried out experiments, supported statistical analysis and wrote the paper. T. Suzuki, T.S. and A.K. carried out validation of KD+iADP cells. M.S. carried out editing of the manuscript. H.K., A.F. and Y.H. provided and analyzed the FANTOM5 dataset. J.W.S. and H.S. wrote the paper and coordinated the project.
FUNDING
Ministry of Education, Culture, Sports, Science and Technology of the Japanese Government (MEXT) [Grant-in-Aid for Young Scientists, 22710201 to Y.T.]; MEXT [Grant for RIKEN Center for Life Science Technologies]; MEXT [Grant for RIKEN Omics Science Center to Y.H.]
RIKEN Omics Science Center ceased to exist as of 1 April 2013 due to RIKEN reorganization.
Conflict of interest statement. None declared.
REFERENCES
- 1.Suzuki H., Forrest A.R., van Nimwegen E., Daub C.O., Balwierz P.J., Irvine K.M., Lassmann T., Ravasi T., Hasegawa Y., de Hoon M.J., et al. The transcriptional network that controls growth arrest and differentiation in a human myeloid leukemia cell line. Nat. Genet. 2009;41:553–562. doi: 10.1038/ng.375. [DOI] [PMC free article] [PubMed] [Google Scholar]
- 2.Macneil L.T., Walhout A.J. Gene regulatory networks and the role of robustness and stochasticity in the control of gene expression. Genome Res. 2011;21:999. doi: 10.1101/gr.097378.109. [DOI] [PMC free article] [PubMed] [Google Scholar]
- 3.Jopling C., Boue S., Izpisua Belmonte J.C. Dedifferentiation, transdifferentiation and reprogramming: three routes to regeneration. Nat. Rev. Mol. Cell Biol. 2011;12:79–89. doi: 10.1038/nrm3043. [DOI] [PubMed] [Google Scholar]
- 4.Takahashi K., Yamanaka S. Induction of pluripotent stem cells from mouse embryonic and adult fibroblast cultures by defined factors. Cell. 2006;126:663–676. doi: 10.1016/j.cell.2006.07.024. [DOI] [PubMed] [Google Scholar]
- 5.Takahashi K., Tanabe K., Ohnuki M., Narita M., Ichisaka T., Tomoda K., Yamanaka S. Induction of pluripotent stem cells from adult human fibroblasts by defined factors. Cell. 2007;131:861–872. doi: 10.1016/j.cell.2007.11.019. [DOI] [PubMed] [Google Scholar]
- 6.Caiazzo M., Dell'Anno M.T., Dvoretskova E., Lazarevic D., Taverna S., Leo D., Sotnikova T.D., Menegon A., Roncaglia P., Colciago G., et al. Direct generation of functional dopaminergic neurons from mouse and human fibroblasts. Nature. 2011;476:224–227. doi: 10.1038/nature10284. [DOI] [PubMed] [Google Scholar]
- 7.Marro S., Pang Z.P., Yang N., Tsai M.C., Qu K., Chang H.Y., Sudhof T.C., Wernig M. Direct lineage conversion of terminally differentiated hepatocytes to functional neurons. Cell Stem Cell. 2011;9:374–382. doi: 10.1016/j.stem.2011.09.002. [DOI] [PMC free article] [PubMed] [Google Scholar]
- 8.Sekiya S., Suzuki A. Direct conversion of mouse fibroblasts to hepatocyte-like cells by defined factors. Nature. 2011;475:390–393. doi: 10.1038/nature10263. [DOI] [PubMed] [Google Scholar]
- 9.Ieda M., Fu J.D., Delgado-Olguin P., Vedantham V., Hayashi Y., Bruneau B.G., Srivastava D. Direct reprogramming of fibroblasts into functional cardiomyocytes by defined factors. Cell. 2010;142:375–386. doi: 10.1016/j.cell.2010.07.002. [DOI] [PMC free article] [PubMed] [Google Scholar]
- 10.Suzuki T., Nakano-Ikegaya M., Yabukami-Okuda H., de Hoon M., Severin J., Saga-Hatano S., Shin J.W., Kubosaki A., Simon C., Hasegawa Y., et al. Reconstruction of monocyte transcriptional regulatory network accompanies monocytic functions in human fibroblasts. PloS One. 2012;7:e33474. doi: 10.1371/journal.pone.0033474. [DOI] [PMC free article] [PubMed] [Google Scholar]
- 11.Hasegawa R., Tomaru Y., de Hoon M., Suzuki H., Hayashizaki Y., Shin J.W. Identification of ZNF395 as a novel modulator of adipogenesis. Exp. Cell Res. 2013;319:68–76. doi: 10.1016/j.yexcr.2012.11.003. [DOI] [PubMed] [Google Scholar]
- 12.Shin J.W., Suzuki T., Ninomiya N., Kishima M., Hasegawa Y., Kubosaki A., Yabukami H., Hayashizaki Y., Suzuki H. Establishment of single-cell screening system for the rapid identification of transcriptional modulators involved in direct cell reprogramming. Nucleic Acids Res. 2012;40:e165. doi: 10.1093/nar/gks732. [DOI] [PMC free article] [PubMed] [Google Scholar]
- 13.Ohi Y., Qin H., Hong C., Blouin L., Polo J.M., Guo T., Qi Z., Downey S.L., Manos P.D., Rossi D.J., et al. Incomplete DNA methylation underlies a transcriptional memory of somatic cells in human iPS cells. Nat. Cell Biol. 2011;13:541–549. doi: 10.1038/ncb2239. [DOI] [PMC free article] [PubMed] [Google Scholar]
- 14.Fantom Consortium and the RIKEN PMI and CLST The. A promoter-level mammalian expression atlas. Nature. 2014;507:462–470. doi: 10.1038/nature13182. [DOI] [PMC free article] [PubMed] [Google Scholar]
- 15.Tomaru Y., Simon C., Forrest A.R., Miura H., Kubosaki A., Hayashizaki Y., Suzuki M. Regulatory interdependence of myeloid transcription factors revealed by Matrix RNAi analysis. Genome Biol. 2009;10:R121. doi: 10.1186/gb-2009-10-11-r121. [DOI] [PMC free article] [PubMed] [Google Scholar]
- 16.Tomaru Y., Nakanishi M., Miura H., Kimura Y., Ohkawa H., Ohta Y., Hayashizaki Y., Suzuki M. Identification of an inter-transcription factor regulatory network in human hepatoma cells by Matrix RNAi. Nucleic Acids Res. 2009;37:1049–1060. doi: 10.1093/nar/gkn1028. [DOI] [PMC free article] [PubMed] [Google Scholar]
- 17.Blais A., Dynlacht B.D. Constructing transcriptional regulatory networks. Genes Dev. 2005;19:1499–1511. doi: 10.1101/gad.1325605. [DOI] [PubMed] [Google Scholar]
- 18.Severin J., Lizio M., Harshbarger J., Kawaji H., Daub C.O., Hayashizaki Y., Consortium F., Bertin N., Forrest A.R. Interactive visualization and analysis of large-scale sequencing datasets using ZENBU. Nat. Biotechnol. 2014;32:217–219. doi: 10.1038/nbt.2840. [DOI] [PubMed] [Google Scholar]
- 19.Yu H., Gerstein M. Genomic analysis of the hierarchical structure of regulatory networks. Proc. Natl. Acad Sci. U.S.A. 2006;103:14724–14731. doi: 10.1073/pnas.0508637103. [DOI] [PMC free article] [PubMed] [Google Scholar]
- 20.Kouno T., de Hoon M., Mar J.C., Tomaru Y., Kawano M., Carninci P., Suzuki H., Hayashizaki Y., Shin J.W. Temporal dynamics and transcriptional control using single-cell gene expression analysis. Genome Biol. 2013;14:R118. doi: 10.1186/gb-2013-14-10-r118. [DOI] [PMC free article] [PubMed] [Google Scholar]
- 21.Kim M., Kim I., Kim S.H., Jung M., Han S., Lee J., Nam J.S., Lee S.K., Bang S. Cryopreserved human adipogenic-differentiated pre-adipocytes: a potential new source for adipose tissue regeneration. Cytotherapy. 2007;9:468–476. doi: 10.1080/14653240701358452. [DOI] [PubMed] [Google Scholar]
- 22.Rosen E.D., MacDougald O.A. Adipocyte differentiation from the inside out. Nat. Rev. Mol. Cell Biol. 2006;7:885–896. doi: 10.1038/nrm2066. [DOI] [PubMed] [Google Scholar]
- 23.Janderova L., McNeil M., Murrell A.N., Mynatt R.L., Smith S.R. Human mesenchymal stem cells as an in vitro model for human adipogenesis. Obes. Res. 2003;11:65–74. doi: 10.1038/oby.2003.11. [DOI] [PubMed] [Google Scholar]
- 24.Li J., Huang N.F., Zou J., Laurent T.J., Lee J.C., Okogbaa J., Cooke J.P., Ding S. Conversion of human fibroblasts to functional endothelial cells by defined factors. Arterioscler. Thromb. Vasc. Biol. 2013;33:1366–1375. doi: 10.1161/ATVBAHA.112.301167. [DOI] [PMC free article] [PubMed] [Google Scholar]
- 25.Sun N., Longaker M.T., Wu J.C. Human iPS cell-based therapy: considerations before clinical applications. Cell Cycle. 2010;9:880–885. doi: 10.4161/cc.9.5.10827. [DOI] [PMC free article] [PubMed] [Google Scholar]
- 26.Okita K., Nakagawa M., Hyenjong H., Ichisaka T., Yamanaka S. Generation of mouse induced pluripotent stem cells without viral vectors. Science. 2008;322:949–953. doi: 10.1126/science.1164270. [DOI] [PubMed] [Google Scholar]
- 27.Montini E., Cesana D., Schmidt M., Sanvito F., Ponzoni M., Bartholomae C., Sergi Sergi L., Benedicenti F., Ambrosi A., Di Serio C., et al. Hematopoietic stem cell gene transfer in a tumor-prone mouse model uncovers low genotoxicity of lentiviral vector integration. Nat. Biotechnol. 2006;24:687–696. doi: 10.1038/nbt1216. [DOI] [PubMed] [Google Scholar]
- 28.Tanaka T., Tomaru Y., Nomura Y., Miura H., Suzuki M., Hayashizaki Y. Comprehensive search for HNF-1beta-regulated genes in mouse hepatoma cells perturbed by transcription regulatory factor-targeted RNAi. Nucleic Acids Res. 2004;32:2740–2750. doi: 10.1093/nar/gkh597. [DOI] [PMC free article] [PubMed] [Google Scholar]
- 29.Musacchio T., Torchilin V.P. siRNA delivery: from basics to therapeutic applications. Front. Biosci. 2013;18:58–79. doi: 10.2741/4087. [DOI] [PubMed] [Google Scholar]
- 30.Zuo Y., Qiang L., Farmer S.R. Activation of CCAAT/enhancer-binding protein (C/EBP) alpha expression by C/EBP beta during adipogenesis requires a peroxisome proliferator-activated receptor-gamma-associated repression of HDAC1 at the C/ebp alpha gene promoter. J. Biol. Chem. 2006;281:7960–7967. doi: 10.1074/jbc.M510682200. [DOI] [PubMed] [Google Scholar]
- 31.Yamanouchi K., Ban A., Shibata S., Hosoyama T., Murakami Y., Nishihara M. Both PPARgamma and C/EBPalpha are sufficient to induce transdifferentiation of goat fetal myoblasts into adipocytes. J. Reprod. Dev. 2007;53:563–572. doi: 10.1262/jrd.18169. [DOI] [PubMed] [Google Scholar]
- 32.Tontonoz P., Hu E., Spiegelman B.M. Stimulation of adipogenesis in fibroblasts by PPAR gamma 2, a lipid-activated transcription factor. Cell. 1994;79:1147–1156. doi: 10.1016/0092-8674(94)90006-x. [DOI] [PubMed] [Google Scholar]
- 33.Fajas L., Fruchart J.C., Auwerx J. Transcriptional control of adipogenesis. Curr. Opin. Cell Biol. 1998;10:165–173. doi: 10.1016/s0955-0674(98)80138-5. [DOI] [PubMed] [Google Scholar]
- 34.Sugii S., Evans R.M. Epigenetic codes of PPARgamma in metabolic disease. FEBS Lett. 2011;585:2121–2128. doi: 10.1016/j.febslet.2011.05.007. [DOI] [PMC free article] [PubMed] [Google Scholar]
- 35.Fan Q., Tang T., Zhang X., Dai K. The role of CCAAT/enhancer binding protein (C/EBP)-alpha in osteogenesis of C3H10T1/2 cells induced by BMP-2. J. Cell. Mol. Med. 2009;13:2489–2505. doi: 10.1111/j.1582-4934.2008.00606.x. [DOI] [PMC free article] [PubMed] [Google Scholar]
Associated Data
This section collects any data citations, data availability statements, or supplementary materials included in this article.