

Background: DHX9 is a DEXH box helicase that participates in many biological processes.
Results: Loss of DHX9 in primary human fibroblasts results in premature senescence. This is accompanied by activation of the p53 pathway and a reduction in DNA replication.
Conclusion: DHX9 plays an essential role in normal cell growth and cell cycle progression.
Significance: These results demonstrate a novel role of DHX9 in DNA replication and offer insight into the biology of helicases.
Keywords: Cell Cycle, Cell Growth, DNA Replication, p53, Senescence, Helicase
Abstract
DHX9 is an ATP-dependent DEXH box helicase with a multitude of cellular functions. Its ability to unwind both DNA and RNA, as well as aberrant, noncanonical polynucleotide structures, has implicated it in transcriptional and translational regulation, DNA replication and repair, and maintenance of genome stability. We report that loss of DHX9 in primary human fibroblasts results in premature senescence, a state of irreversible growth arrest. This is accompanied by morphological defects, elevation of senescence-associated β-galactosidase levels, and changes in gene expression closely resembling those encountered during replicative (telomere-dependent) senescence. Activation of the p53 signaling pathway was found to be essential to this process. ChIP analysis and investigation of nascent DNA levels revealed that DHX9 is associated with origins of replication and that its suppression leads to a reduction of DNA replication. Our results demonstrate an essential role of DHX9 in DNA replication and normal cell cycle progression.
Introduction
One of the earliest observations made with respect to the culturing of normal somatic cells derived from human tissue is the fact that they do not propagate indefinitely but invariably enter a state of irreversible growth arrest after a limited number of cell divisions (1). Hayflick and Moorhead (1) reported that primary human fibroblasts undergo a period of relatively rapid proliferation following establishment in culture, but cell division slowed with increasing time and eventually ceased altogether after an average of ∼50 cumulative population doublings. This phenomenon, termed “cellular senescence,” was subsequently attributed to the attrition of telomeres. With each round of DNA replication and cell division, the telomeres capping the ends of chromosomes become shortened due to the inability of DNA polymerase to fully synthesize the 3′ ends of DNA (2, 3). When the telomeres reach a critical length, a DNA damage response is triggered, leading to cell cycle arrest and inhibition of further replication (4).
In addition to telomere-dependent senescence, termed “replicative senescence,” various stimuli have been shown to cause primary cells to senesce long before they reach the end of their replicative life span. This “premature senescence” can be induced by DNA-damaging agents (5, 6), oxidative stress (7), persistent replication stress (8), overexpression of oncogenes (9–12), and inactivation of certain tumor suppressors (13, 14). Loss or mutation of genes involved in the maintenance of genomic stability, such as the WRN and BLM helicases, can also lead to early senescence (15–18). Premature senescence is of particular interest both in studies of the aging process and aging-related disorders and in cancer research as a potential chemotherapeutic strategy. Indeed, induction of senescence has been shown to be an important mechanism in eliciting an anti-tumor response (19–22).
Senescent cells exhibit several characteristics that can be used as identifiers of this biological phenomenon. The most prominent is a permanent, irreversible cell cycle arrest in the G1 phase (23). Senescent cells adopt a flattened, expanded, and irregular morphology, are often multinucleated, and may contain increased vacuolar structures (12, 24, 25). A distinctive biomarker, one that can be used to distinguish senescent cells from quiescent or terminally differentiated cells, is the expression of senescence-associated β-galactosidase (SA β-gal) activity (26). In addition, senescence is accompanied by changes in the gene expression profile (27); in particular, activation of the p53 and p16-RB1 signaling pathways and changes in expression of cell cycle proteins have been observed (12, 28).
DHX9 (also known as nuclear DNA helicase II and RNA helicase A) is a DEXH box helicase that exhibits both RNA and DNA helicase activity (29), as well as triple helical DNA unwinding activity (30). It was originally isolated from bovine tissue (31) and consists of two RNA-binding domains at the N terminus, a core helicase region consisting of seven conserved helicase motifs, and a DNA-binding domain and nuclear localization signal at the C terminus (32). DHX9 is a multifunctional protein that has been implicated in several biological processes, including regulation of transcription (33–35), translation (36, 37), RNA transport (38), miRNA processing (39), and genome maintenance processes (30, 40, 41). Its interacting partners include the transcriptional coactivator cAMP-response element-binding protein-binding protein, EGF receptor, the tumor suppressor BRCA1, and RNA polymerase II (33–35). It has also been found to be associated with the Ku protein complex, a component of DNA-PK that plays a role in nonhomologous end-joining-mediated DNA repair (42).
We previously conducted an shRNA screen in search of modifiers of sensitivity to ABT-737 (an inhibitor of BCL-2 family pro-survival factors) in Arf−/−Eμ-Myc/Bcl-2 lymphoma cells, and we found that DHX9 suppression was synthetic lethal with ABT-737 (43). Subsequent experiments showed that ABT-737 sensitization caused by DHX9 suppression was due to the activation of a p53-dependent apoptotic program (43). To further characterize DHX9, we investigated its role in primary human diploid fibroblast cell lines and find that its suppression leads to pronounced p53-dependent growth arrest and premature senescence. Chromatin immunoprecipitation (ChIP) assays and analysis of nascent DNA production revealed that DHX9 is located at origins of replication and that DNA replication is inhibited upon DHX9 knockdown. Our results are consistent with a role of DHX9 in DNA replication and suggest that its suppression leads to senescence in primary human diploid fibroblast cells brought on by an inhibition of replication.
MATERIALS AND METHODS
Cell Lines, Cell Culture, and Plasmids
All cell lines used in this study were maintained in DMEM supplemented with 10% fetal bovine serum (Multicell). HEK293T/17 cells were obtained from ATCC. MRC-5 fibroblast cells were kindly provided by Dr. Nahum Sonenberg (McGill University, Canada). The MRC-5 cells were used between 10 and 30 population doubling levels and were routinely subcultured 1:4 every 3 days; each passage was considered two population doubling levels.
Two shRNAs targeting human DHX9 (DHX9.860 and DHX9.267) and a control shRNA targeting firefly luciferase (FLuc.1309) were transduced into cells using pPrime-PGK-Puro (Addgene), a 2nd generation lentiviral vector. An shRNA targeting human p53, pLVUH-shp53, was obtained from Addgene and has been described previously (44). The shRNA to human retinoblastoma (RB1), MLP-shRB1, was obtained from Dr. Scott Lowe (Memorial Sloan-Kettering Cancer Center, New York) (45), and subcloned into pPrime-GFP. The retroviral vector pBabepuro-hRas V12, used to express a constitutively active form of hRas, was obtained from Addgene. Lentiviral transduction was performed following published procedures (46). Briefly, 15 μg of pPrime-PGK-Puro-shRNA, 7.5 μg of packaging plasmid pSPAX2, and 3.75 μg of envelope-encoding vector, CMV-VSVG, were mixed and transfected into HEK293T/17 cells in a 10-cm dish by calcium phosphate-mediated delivery. The media were changed 12 h later, and 48 h post-transfection, lentiviral supernatant was collected every 8 h up to 72 h and added to target cells. Forty eight hours after the final transduction, stable integrants were selected using 2 μg/ml puromycin for at least 3 days. For transduction of retroviral vectors (e.g. pBabepuro-hRas V12) into human cells, the same procedure as lentiviral transduction was followed, except that the packaging plasmid pUMVC was used instead of pSPAX2.
shRNA Sequences
The FLuc.1309, DHX9.860, and DHX9.267 shRNAs were cloned into the miR30 backbone of pPrime-PGK-Puro via unique XhoI and EcoRI restriction sites (47). The guide strand sequences of the shRNAs used in this study are as follows: FLuc.1309, 5′TTAATCAGAGACTTCAGGCGGT3′; DHX9.267, 5′CCAGGCAGAAATTCATGTGTG3′; DHX9.860, 5′ACACGAGAACATGGATCAAAT3′, RB1.698, 5′CGCAGTTCGATATCTACTGAA3′; and hp53.908, 5′AGTAGATTACCACTGGAGTCTT3′.
Growth Curves
Five days following lentiviral transduction of shRNAs, cells were plated into 18 T25 flasks at an initial concentration of 100,000 cells per flask. Each subsequent day, cells from three individual T25 flasks were trypsinized, resuspended in Isoton, and counted using a Coulter Counter (Beckman). This procedure was performed for 6 consecutive days at which point cells began to approach confluency.
Cell Cycle Analysis
Cell cycle analysis was performed using ethanol fixation, acid denaturation, and propidium iodide staining (48) at days 6 and 14 after transduction with the shRNAs. Cells were seeded onto 6-cm plates and harvested at 75% confluency. The cells were trypsinized and washed twice with PBS containing 1% BSA and 5 mm EDTA, resuspended in 300 μl of PBS on ice, fixed with 1 ml of 70% ethanol, and stored at −20 °C until further processing. The fixed cells were then treated with 0.5% Triton X-100, 2 n HCl for 30 min with end-over-end incubation at room temperature to denature genomic DNA. Cells were neutralized with 0.1 m sodium borate (pH 8.5), washed with PBS containing 1% BSA and 0.5% Triton X-100, and resuspended in 500 μl of PBS containing 5 μg/ml propidium (Sigma). The cell cycle profile of the cells was then assessed using a GUAVA EasyCyte HT flow cytometer (Millipore).
Senescence-associated β-Galactosidase Assay
Senescence-associated β-galactosidase (SA-β-gal)3 activity was detected as described previously (26), with slight modifications. Following lentiviral transduction, cells were plated onto 6-well plates, and the assay was performed 6 and 14 days post-transduction. Cells were fixed with 0.5% glutaraldehyde in PBS for 15 min at room temperature, washed with PBS, and then washed twice with PBS supplemented with 1 mm MgCl2. The cells were stained with X-Gal solution (1 mg/ml X-Gal, 5 mm K3Fe(CN)6, 5 mm K4Fe(CN)6·H2O in PBS) for 8 h at 37 °C, washed three times in PBS, and fixed with 100% methanol for 5 min at room temperature. Bright field color images were taken with a Zeiss AxioImager Z2 microscope and an AxiocamMRc camera. Experiments were performed three times, counting 1000 cells from at least five independent fields. Phase images were taken with a Zeiss Observer A1 microscope and an AxiocamMRm camera.
Immunoblot Analysis
Protein extracts were prepared in RIPA lysis buffer (20 mm Tris-HCl (pH 7.5), 150 mm NaCl, 0.1% SDS, 1% Nonidet P-40, 0.5% sodium deoxycholate, 1 mm β-glycerophosphate, 1 mm PMSF, 1 μg/ml leupeptin, 10 μg/ml aprotinin, and 2.5 μm pepstatin A) at 4 and 8 days post-transduction. PVDF membranes were probed with the indicated primary antibodies and HRP-conjugated secondary antibodies (rabbit (711-035-152) or mouse (115-035-146) (Jackson ImmunoResearch)) and visualized using enhanced chemiluminescence (ECL) (PerkinElmer Life Sciences). The following primary antibodies were used in this study: DHX9 (M99; SC Biotech); eEF2 (2332; Cell Signaling); RB1 (554136; Pharmingen); human p53 (DO-1; SC Biotech); p21 (556430; Pharmingen); p16 (DCS-50; SC Biotech); α-actin (clone AC-15; Sigma); phospho-ATR p-S428 (2853; Cell Signaling); ATR (N-19; Santa Cruz Biotechnology); phospho-CHK1 pS345 (2341; Cell Signaling); CHK1 (DCS-310; SC Biotech); p53 pS15 (9284; Cell Signaling); Myc tag (9E10, McGill Hybridoma Core Facility); γH2A.X (clone JWB301; Millipore); ORC2 (3G6, SC Biotech); Ku86 (H-300, SC Biotech), and NFκB (c-20, SC Biotech). Quantification of Western blot band intensities was carried out using the ImageJ software (National Institutes of Health).
DHX9 cDNA Rescue
Murine stem cell virus (MSCV)-based expression of the wild-type and mutant human DHX9 cDNAs (49) was performed by subcloning the DHX9 cDNA preceded by an N-terminal Myc tag into the BglII/EcoRI sites of MSCV/PuroR, generating MSCV-Myc-hDHX9-PuroR (43). To allow expression in human cells without being targeted by the human DHX9 shRNAs, the wobble positions of seven amino acid codons within the shDHX.267 target site were mutated [5′AACAGGCAGAAATTCATGTGTGAG3′ changed to 5′AATAGACAAAAGTTTATGTGCGAA3′]. To enable efficient transduction of the retroviral constructs in human cells, MRC-5 cells were first infected with a lentiviral plasmid expressing the ecotropic retroviral receptor, HAGE-EcoR (kindly provided by Dr. Scott Lowe (Memorial Sloan-Kettering Cancer Center, New York), using the lentiviral transduction procedure described above and selected using puromycin. The EcoR-expressing MRC-5 cells were then transduced with the DHX9-expressing constructs using the Phoenix Ecotropic packaging cell line via calcium phosphate-mediated delivery, and expression was determined by Western blot. To assay for the ability of the DHX9 cDNAs to rescue the senescent phenotype caused by DHX9 knockdown, the DHX9.267 shRNA was first subcloned into a neomycin-expressing variant of the pPrime vector (pPrime-CMV-Neo, Addgene), infected into cDNA-expressing MRC-5 cells, and selected using G418 (Bioshop, Ontario, CA). Cells were assayed for SA-β-gal expression 14 days after infection of the DHX9.267 (or the control FLuc.1309) shRNAs, as described above.
Microarray Analysis and Validation
Total RNA from MRC-5 cells was extracted using TRIzol as per the manufacturer's instructions (Invitrogen) 5 days after infection with shRNAs targeting DHX9 (DHX9.860 and DHX9.267) or FLuc.1309. Extracts from three biological replicates were submitted to the McGill University and Génome Québec Innovation Center's microarray facility. RNA quality was assessed using an Agilent 2100 Bioanalyzer (Agilent Technologies), and the cDNA was generated and hybridized onto the Affymetrix Human Gene 2.0 ST Array. Custom chip definition file definitions were used for data extraction (50) because of their superior performance compared with standard chip definition files (51), and data were normalized using robust multichip averaging in R using the “rma” function from the “affy” package with default settings (R <3.0). Identifiers that showed no variance were removed. We identified differentially expressed genes using a two-tailed t test that incorporates variance shrinkage (52) and adjusted the resulting p values using the Benjamini-Hochberg false discovery rate method (53). Genes were designated as differentially expressed if they showed an FDR of <0.05 and an absolute fold-change of >1.5. For heatmaps (generated by the heatmap.2 function in the “gplots” bioconductor package) of genes, a per gene normalization was performed. A set of p53 target genes was collected as described previously (43), and their fold-changes (for each shRNA separately) were compared with those of all genes (after excluding the p53 set) using the “density” function in R with a fixed common “bw” parameter. Enrichment of biological processes (as defined by the Gene Ontology Consortium) at the extreme ends of gene lists ordered by signed (up + or down −) −log10 (p values) derived from the comparison of each DHX9 shRNA to control separately was performed using GAGE (54). The esset.grp function was used to remove redundant biological processes (e.g. those that are enriched by a common set of genes), and those with an FDR of <0.001 were considered significant. For the comparison with data sets of replicative senescence (27), normalized data were downloaded from the Stanford Microarray Database. Only nonflagged genes were considered. For each cell type (BJ, WI38, or WS1) the mean log2 fold-change (senescent versus early passage) was calculated. Mean fold-changes for genes that were differentially expressed by either of the DHX9 shRNAs and were represented in the data for each of the cell lines (separately) were collected and plotted. Fisher's exact test (in R) was used to assess if there were more genes showing concordant regulation than expected by chance.
The following qRT-PCR primers (all against human targets) were used for validation: p53 FWD, 5′CAGCACATGACGGAGGTTGT3′; p53 REV, 5′TCATCCAAATACTCCACACGC3′; p21 FWD, 5′CGATGGAACTTCGACTTTGTCA3′; p21 REV, 5′GCACAAGGGTACAAGACAGTG3′; DHX9 FWD, 5′CAGGAGAGAGAGTTACTGCCT3′; DHX9 REV, 5′CTCTGCTGCTCGGTCATTCTG3′; GAPDH FWD, 5′GAAGGTGAAGGTCGGAGTC3′; and GAPDH REV, 5′GAAGATGGTGATGGGATTC3′ (where FWD is forward and REV is reverse).
Genomic and Nascent DNA Isolation and Quantitation
Genomic DNA was isolated using the GenElute mammalian genomic DNA miniprep kit (Sigma), as per the manufacturer's instructions. Nascent DNA was prepared 6 days after transduction with the FLuc.1309 or DHX9 shRNAs, using the λ-exonuclease method, as described previously (55), with the following modifications. The λ-exonuclease-digested samples were heated at 100 °C for 3 min and then immediately subjected to electrophoresis on a 2% agarose gel. DNA was visualized by staining with 0.02% (w/v) methylene blue (Sigma), and the origin-containing nascent DNA, ranging between 350 and 1000 bp in size, was excised from the gel, purified using the Sephaglas BandPrep kit (GE Healthcare), as per the manufacturer's instructions, and resuspended in TE. Real time PCR quantification analysis was performed using the Bio-Rad CFX96 instrument, as described previously (43). The sequences and amplification conditions for all primer sets are shown in Table 1. Genomic DNA from MRC-5 cells was used to generate the standard curves needed for quantification of all the PCR products. A negative control without template DNA was included with each set of reactions. PCR products were also resolved on 2% agarose gels, visualized with ethidium bromide, and photographed with an Eagle Eye apparatus (Speed Light/BT Sciencetech-LT1000).
TABLE 1.
Sequences and amplification conditions of primers used for real time qPCR
| Primer namea | Sequence (5′ → 3′) | Size of amplicon | qPCR (annealing temperature) |
|---|---|---|---|
| bp | °C | ||
| LB2P-F | GGCTGGCATGGACTTTCATTTCAG | 232 | 66 |
| LB2P-R | GTGGAGGGATCTTTCTTAGACATC | ||
| LB2C-F | GTTAACAGTCAGGCGCATGGGCC | 240 | 66 |
| LB2C-R | CCATCAGGGTCACCTCTGGTTCC | ||
| Myc11-F | TATCTACACTAACATCCCACGCTCTG | 221 | 66 |
| Myc11-R | CATCCTTGTCCTGTGAGTATAAATCATCG | ||
| Myc1-F | TTCTCAACCTCAGCACTGGTGACA | 249 | 66 |
| Myc1-R | GACTTTGCTGTTTGCTGTCAGGCT | ||
| hOrs8P-F | TTGCACTTCACAGAGCAGTCAT | 320 | 66 |
| hOrs8P-R | GACCCACAAAGGCAAAAGTACC | ||
| hOrs8C-F | CCCTGAGGCAGGAGTGTTTGCC | 520 | 66 |
| hOrs8C-R | GTATGCTCAATCTGCCCAACGG |
a F indicates forward primers; R indicates reverse primers. LB2P (peak region) and LB2C1 (control region ∼4 kb away) are at the region of the lamin B2 locus; Myc11 (peak region) and Myc1 (control region ∼6 kb away) are at the region of the c-Myc locus; hORS8P (peak region) and hORS8C (control region ∼2 kb away) are at the region of the human ORS8 locus.
Chromatin Immunoprecipitation (ChIP) Assays
Cells cultured in complete media were washed with pre-warmed PBS and treated with 1% formaldehyde for 10 min to cross-link proteins and DNA in vivo (56). They were then washed and scraped into ice-cold PBS and resuspended in lysis buffer (50 mm HEPES-KOH (pH 7.5), 140 mm NaCl, 1% Triton X-100, 2 mm EDTA) supplemented with a complete protease inhibitor tablet (Roche Applied Science). Following passage through a 21-gauge needle three times, the nuclei were harvested, resuspended in one packed nuclear volume of lysis buffer, and sonicated until DNA fragments of less than 1 kb were obtained. Chromatin size was monitored by electrophoresis. For cell counting, one untreated plate was scraped into PBS and resuspended. The cells were then counted with a hematocytometer, and this number was used to determine the total number of treated cells. The protein concentration of the extracts was determined using the Bradford protein assay (Bio-Rad). IPs were carried out, as described previously (56), with the following modifications: sheared chromatin lysates (500 μg) were pre-cleared by incubation with 50 μl of protein G-agarose (Roche Applied Science) followed by incubation for 6 h with either 20 μg of antibody against ORC2 (3G6, SC Biotech), Ku86 (H-300, SC Biotech), DHX9 (B-5, SC Biotech), NFκB (C-20, SC Biotech), or normal goat serum (NGS) at 4 °C with constant rotation. Protein G-agarose (50 μl) was added and incubated overnight at 4 °C. The pelleted beads were washed successively twice with 1 ml of lysis buffer for 15 min each at 4 °C, followed by 1 ml of WB1 (50 mm Tris-HCl (pH 7.5), 500 mm NaCl, 0.1% Nonidet P-40, 0.05% sodium deoxycholate, complete protease inhibitor tablet), 1 ml of WB2 (50 mm Tris-HCl (pH 7.5), 0.1% Nonidet P-40, 0.05% sodium deoxycholate, complete protease inhibitor tablet), and 1 ml of sterile TE. The beads were resuspended in 200 μl of TE, 1% SDS, incubated at room temperature for 15 min, and centrifuged at 3000 rpm for 1 min at room temperature. Half of the supernatant was then incubated overnight at 65 °C to reverse the cross-links, followed by digestion with 100 μg of proteinase K at 55 °C for 2 h. The DNA was purified using the QIAquick PCR purification kit (Qiagen) and eluted in 100 μl of TE. The remaining half of the supernatant was boiled for 10 min in SDS-PAGE loading buffer and subjected to SDS-PAGE for Western blot analysis. For ChIP analysis of Myc-tagged DHX9 mutants, MRC-5 HAGE-EcoR cells were first transduced with an MSCVpuro-Myc construct expressing either the WT DHX9 cDNA or the K417N, D511A/E512A, or ΔRBDI+II mutants, and the same procedure as above was followed except that the Myc antibody (9E10, SC-Biotech) was used in place of the DHX9 antibody.
RESULTS
Loss of DHX9 Results in Morphological Changes, Senescence-associated β-Galactosidase Activity, and Growth Arrest in Primary Human Cells
We have previously shown that suppression of DHX9 acts in concert with elevated MYC expression to enhance ABT-737 sensitivity (43). During the course of these experiments, we noted that suppression of DHX9 in NIH3T3 cells resulted in a dramatic reduction in growth rates (see Fig. 5A in Ref. 43). To assess whether this phenomenon extended to nontransformed cells, we sought to investigate the consequences of DHX9 suppression in MRC-5 cells, a primary human diploid lung fibroblast line. Reduction in DHX9 levels via lentiviral transduction using two independent shRNAs resulted in striking morphological changes in MRC-5 cells (Fig. 1A, day 14 P.I.). Whereas control cells are small, spindle-shaped, and refractile, suppression of DHX9 leads to cells that are more flattened, enlarged, and irregularly shaped. Morphologically, they resemble cells overexpressing the mutant hRAS V12 oncogene (resulting in oncogene-induced senescence) and late passage MRC-5 cells that had been in culture for over 5 months. In addition, DHX9-suppressed cells stained positive for SA β-gal, a distinguishing marker of senescent cells (Fig. 1B, day 14 P.I.). DHX9 shRNA-expressing cells show a significantly higher percentage of SA β-gal-positive cells compared with MRC-5 controls (50–57% for DHX9 knockdown cells compared with 3% for shFLuc.1309-expressing cells) (Fig. 1D, day 14 P.I.). The morphological changes and SA-β-gal expression required time to manifest, as the differences were only apparent at day 14 post-infection but not at day 6 post-infection (Fig. 1, A, B, and D). These results were not restricted to MRC-5 cells and extended to IMR-90, another primary human diploid fibroblast cell line (Fig. 1E). Measurements of the growth rates of DHX9-depleted MRC-5 cells indicated these to be at least 2-fold lower than control cells and similar to hRAS V12-expressing cells (Fig. 2A). Cell cycle analyses showed an increase in the percentage of cells in the G0/G1 phase and a decrease in the percentage of cells in the S and G2 phases 14 days after infection of DHX9 shRNAs (Fig. 2B). Taken together, these results demonstrate that suppression of DHX9 causes premature senescence in MRC-5 cells.
FIGURE 5.

Gene expression signature induced by DHX9 suppression resembles that of replicative senescence. A and B, gene expression signatures in cells transduced with shDHX9.267 or shDHX9.860 overlap. Shown is a Venn diagram highlighting the number of common and distinct differentially expressed genes from cells transduced with either of the two DHX9 shRNAs (A) and a heatmap showing a reproducible and concordant expression pattern (B). C, reduced expression of DHX9 induces a p53 gene expression program. Densities of fold-changes (DHX9 shRNAs versus FLuc.1309 shRNA) for all genes and a subset of p53 target genes are shown. D, heatmap of the p53 target genes identified in C. E, highly significant enrichment of biological processes among genes that are differentially expressed upon reduced DHX9 expression. A heatmap indicating the significances of enrichments (FDRs for cells transduced with each DHX9 shRNA separately) for nonredundant biological processes defined by the Gene Ontology Consortium is presented. F, comparison between genes differentially expressed by reduced expression of DHX9 compared with previously described signatures of replicative senescence in fibroblasts. Shown is a scatterplot of fold-changes for specific genes. The number of genes in each quadrant is indicated. The p values for the comparison between the number of genes showing concordant regulation (i.e. elevated or repressed in both comparisons) to what is expected by chance (i.e. equal distribution of the genes in all quadrants) are: BJ, p value = 2.46e-29; WI38, p value = 8.14e-25; WS1, p value = 5.24e-22.
FIGURE 1.

DHX9 knockdown results in morphological changes and increased senescence-associated β-galactosidase staining in primary human cells. A, phase images, and B, β-galactosidase staining of MRC-5 cells transduced with lentivirus expressing the indicated shRNAs or hRAS V12 cDNA, harvested 6 and 14 days P.I. Late passage MRC-5 cells and senescent cells induced by hRAS V12 transduction are shown for comparison. Bars represents 100 μm for the phase images and 200 μm for the β-galactosidase-stained images. C, Western blot showing knockdown efficiencies of DHX9 shRNAs in MRC-5 cells following transduction with lentiviral vectors. Extracts were prepared from cells 8 days following infection, fractionated by SDS-PAGE, transferred to PVDF membrane, and probed with antibodies to the indicated proteins. D, quantitation of β-galactosidase staining from B. Cells from at least five independent fields/experiment were quantitated. Error bars represent S.E., n = 3. *, p < 0.01; **, p < 0.001. E, quantitation of β-galactosidase staining from IMR-90 cells transduced with the indicated shRNAs. Cells from at least five independent fields/experiment were quantitated. Error bars represent S.E., n = 3. *, p < 0.01.
FIGURE 2.
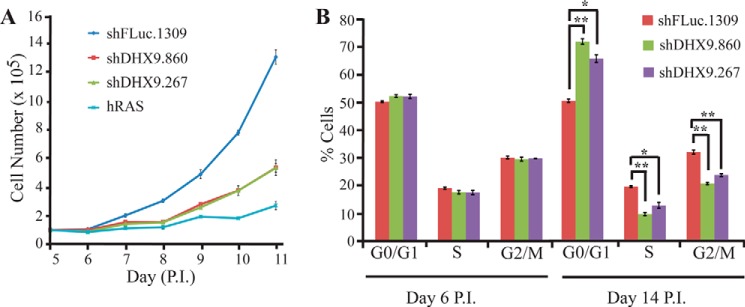
DHX9 knockdown results in a pronounced growth arrest in MRC-5 cells. A, growth curves for MRC-5 cells transduced with hRAS V12 cDNA, shFLuc.1309, or DHX9 shRNAs. Cells were counted between days 5 and 11 P.I. Error bars represent S.E., n = 3. B, cell cycle analysis of MRC-5 cells transduced with control or DHX9 shRNAs at 6 and 14 days P.I. Error bars represent S.E., n = 3. *, p < 0.01; **, p < 0.001.
DHX9 Suppression Leads to Changes in Cell Cycle and DNA Damage Response Proteins
To gain insight into the possible mechanisms through which loss of DHX9 induces premature senescence, we examined the expression of various cell cycle and DNA damage response proteins (Fig. 3). Hyperphosphorylated RB1 levels were markedly decreased, indicating RB1 activation (Fig. 3, A and C). Hypophosphorylated RB1 levels were slightly increased, although the increase did not appear to compensate for the levels of the decreased hyperphosphorylated form; this may be due to increased RB1 degradation or due to the fact that the RB1 antibody may not bind to phosphorylated and nonphosphorylated RB1 with equal efficiency. Elevated levels of p53 and p21 are a common feature of cellular senescence, and we observed a moderate increase in p53 levels and a substantial increase in p21 in shDHX9-transduced cells compared with control cells, both at 4 and 8 days post-infection (Fig. 3, B and C). Activation of p53, p21, and RB1 is consistent with previous data showing that these proteins are up-regulated during senescence induced by Ras expression or etoposide treatment (12, 57). However, contrary to what is observed with etoposide and Ras-induced senescence, p16 levels are not elevated upon DHX9 knockdown (12, 58). In addition, we examined markers of DNA damage and replicative stress, phospho-H2A.X (Ser-139), 53BP1, and phospho-CHK1 (Ser-345), respectively. Although these markers show an increase in the case of etoposide-induced senescence, no change was detected in their levels upon loss of DHX9 (Fig. 3 and data not shown). ATR, another marker of DNA damage and replicative stress, is activated in many forms of senescence (59), but no activation was observed under our tested conditions. Our results indicate that the p53 and RB1 pathways are involved in DHX9-induced senescence; however, the precise mechanism of action differs from that of etoposide and Ras-induced senescence, and it appears not to involve an increase in DNA damage.
FIGURE 3.

Effect of DHX9 suppression on cell cycle regulatory and DNA-damage response proteins. Western blot analysis of extracts from MRC-5 cells transduced with control (shFLuc.1309) or DHX9 shRNAs, 4 and 8 days P.I. pBabe-hRAS-infected and etoposide-treated cells were used as controls. Extracts were fractionated on 6% (A) or 15% (B) polyacrylamide gels. Blots were probed with antibodies to the proteins indicated at right. eEF2 and actin are used as loading controls. C, quantitation of the relative optical densities of Western blot bands from extracts prepared 4 and 8 days post-infection. Shown are extracts from MRC-5 cells transduced with shRNA against FLuc.1309, DHX9.860, or DHX9.267, probed with various antibodies. Error bars represent S.E., n = 3–6. The optical densities of the shDHX9.860 and shDHX9.267 bands are normalized to that of the shFLuc.1309 bands. *, p < 0.05; **, p < 0.01; and §, p < 0.001.
p53 Is Essential for DHX9-induced Senescence
Based on our observation that the p53 and RB1 pathways are activated upon DHX9-induced senescence, we sought to determine whether induction of p53 and/or RB1 was essential to this process. To accomplish this, we first transduced MRC-5 cells with shRNAs targeting p53 or RB1 and then examined the effect of DHX9 suppression in these cells. Loss of RB1 had no effect on the increase in SA-β-gal staining or growth inhibition exhibited upon DHX9 suppression, compared with the vector control (Fig. 4, A and B). In contrast, loss of p53 completely abolished the SA-β-gal staining and rescued the growth defect in DHX9 knockdown cells (Fig. 4, A and B). In addition, loss of p53 eradicates the p21 and RB1 responses in the DHX9 knockdown cells, compared with the vector control (Fig. 4C). This demonstrates that p53 is essential for DHX9-induced senescence and that RB1, although not essential for the senescence, acts downstream of the p53 signaling pathway, along with p21.
FIGURE 4.

DHX9-induced senescence is p53-dependent. A, β-galactosidase staining of MRC-5 cells transduced with virus expressing the indicated shRNAs, 14 days post-transduction. Bars represent 200 μm. B, growth curves of MRC-5 cells transduced with virus expressing the indicated shRNAs. Cells were counted between days 5 and 11 post-transduction. C, Western blot analysis of p53, p21, RB1, and DHX9 from MRC-5 cells transduced with virus expressing the indicated shRNAs.
DHX9 Suppression Is Associated with a Senescence Signature
To further characterize the cellular response to reduced DHX9 expression, we quantified genome-wide steady state mRNA levels. To this end, DHX9 was suppressed using shDHX9.860 and shDHX9.267, and triplicate samples were analyzed for global gene expression changes. A comparison of the data between cells transduced with virus expressing either of the DHX9 shRNAs identified 1535 genes as differentially expressed (compared with shFLuc.1309 control cells) under at least one condition (fold-change of >1.5 and FDR of <0.05; supplemental Table S1). The two DHX9 shRNAs affected expression of an overlapping set of genes (Fig. 5A), and only one differentially expressed gene showed disconcordant regulation (as judged by fold-change) between shDHX9.860- and shDHX9.267-transduced cells (LOC100996637 (mucin-19-like)) (Fig. 5B). This is consistent with the vast majority of observed changes in gene expression being related to DHX9 suppression and not off-target effects (Fig. 5A). To examine whether reduced DHX9 expression resulted in activation of a p53 transcriptional program at a genome-wide level, we collected a set of p53 target genes and studied their expression following reduced DHX9 expression. Consistent with activation of a p53 transcriptional program, p53 targets were induced as compared with all genes in the cell (Fig. 5C). This response was broad and included most selected genes with the exception of PLK1, whose expression was reduced (Fig. 5D). To further characterize the genes that are affected by DHX9 expression, we searched for enrichment of genes annotated to shared biological processes among genes that were up- or down-regulated following transduction with DHX9 shRNAs. The analysis identified 46 nonredundant biological processes (FDR of <0.001), the majority enriched among genes that were down-regulated (Fig. 5E). Such processes included several related to DNA replication and cell cycle progression (supplemental Table S1) consistent with the observed senescent phenotype.
To directly test whether the observed expression pattern overlaps with that of senescent cells, we compared the DHX9 expression signature to those obtained previously from fibroblasts undergoing replicative senescence (27). Indeed, there was a strong overlap between the signatures as judged by the number of genes showing concordant regulation across the comparisons, compared with what would be expected by chance (Fig. 5F; all Fisher test p values <e-20). Thus, expression profiling supports the notion that reduced DHX9 expression induces a premature cellular senescence program that closely resembles replicative senescence.
In contrast to the observed activation of a p53 gene expression program (Fig. 5, C and D), the microarray data indicated that p53 transcript levels were not elevated, despite the fact that we observed a moderate increase in p53 protein levels in DHX9 knockdown cells (Figs. 3, A and C, and 6A). Indeed, qRT-PCR analysis indicated no significant difference in p53 levels, although p21 levels were induced 3–5-fold upon DHX9 suppression (Fig. 6B). These results suggest that the increase in p53 protein observed upon DHX9 suppression in MRC cells is a post-transcriptional response that in turn activates the senescence program (see under “Discussion”).
FIGURE 6.
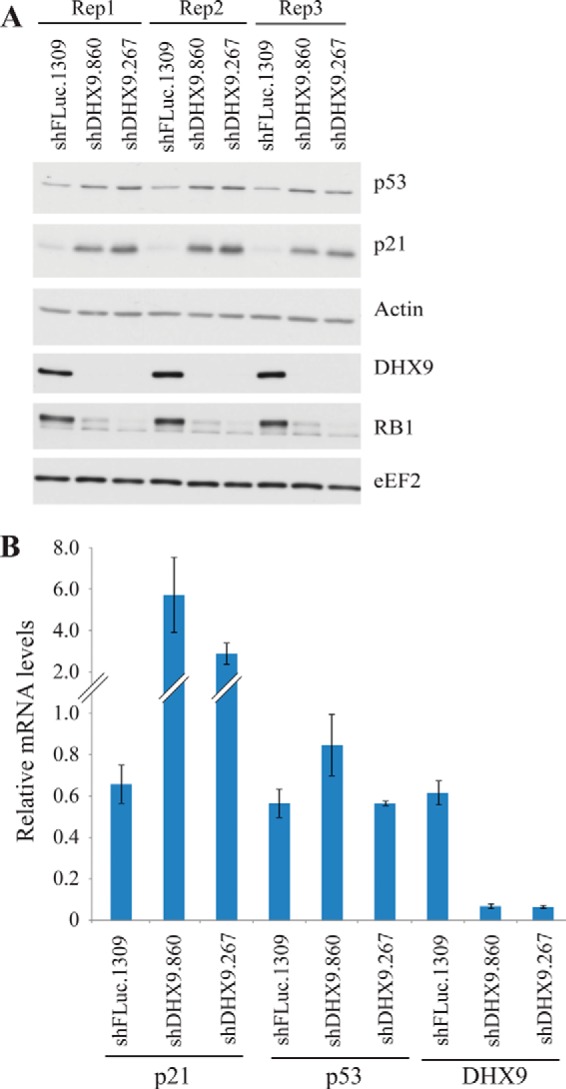
A, Western blot analysis of MRC-5 cells transduced with a control (shFLuc. 1309) or DHX9 shRNAs, corresponding to the samples used for microarray analysis presented in Fig. 5. B, quantitative RT-PCR analysis of selected genes regulated by DHX9 suppression. Error bars indicate S.E., n = 3.
Structure/Function Analysis of DHX9 in the Senescence Response
As DHX9 is a multidomain, multifunctional protein, we wished to elucidate which function of DHX9 might be involved in its role in senescence. To this end, we used a series of DHX9 mutants in which various activities were targeted. Three of these, K417N, D511A/E512A, and S543L, are point mutants in the core helicase region targeting domains I, II, and III, respectively (Fig. 7A). We also used mutants with deletions in the RNA-binding domain I (ΔRBDI) or in both RNA-binding domains (ΔRBDI+II) (Fig. 7A). To ensure that the cDNA constructs were not targeted by the DHX9 shRNAs, the wobble amino acid positions in the region targeted by the DHX9.267 shRNA were altered (see “Materials and Methods”). The DHX9 cDNAs were expressed in MRC-5 cells to similar levels, with the exception of the ΔRBDI mutant, which consistently showed significantly high expression levels (Fig. 7B). Whereas 63% of cells transduced with the empty vector control, MSCV cells, in combination with the DHX9.267 shRNA-exhibited β-galactosidase staining, transduced with the WT DHX9 cDNA effectively rescued the senescent phenotype, reducing the staining to 20% (Fig. 7, C and D). However, none of the mutants were able to rescue the senescent phenotype, suggesting that helicase and the two RNA-binding domains are essential to DHX9's role in premature senescence (Fig. 7, C and D).
FIGURE 7.

Functional analysis of DHX9 using various mutant cDNA constructs. A, schematic diagram of DHX9 cDNA and mutants used in this study. B, Western blot analysis of WT DHX9 and mutants expressed in MRC-5 cells. The empty vector, MSCV, is used as a control. * denotes position of migration of recombinant protein. C, β-galactosidase staining of MRC-5 cells transduced with lentivirus expressing the indicated shRNAs in combination with various DHX9 cDNAs. D, quantitation of β-galactosidase staining from C. Cells from at least five independent fields/experiment were quantitated. Error bars represent S.E., n = 3. *, p < 0.01.
Loss of DHX9 Induces Senescence through Inhibition of DNA Replication
Our expression profile analysis uncovered that many genes involved in DNA replication are down-regulated upon loss of DHX9. We wished to further investigate whether DHX9 might play a role in DNA replication. We examined whether DHX9 suppression affected the synthesis of new (“nascent”) DNA at specific origins of replication. Nascent DNA abundance was quantitated at three known origins in MRC-5 cells as follows: LB2P (located at the Lamin B2 locus), Myc11 (c-Myc locus), and hORS8P (hORS8 locus). Within the vicinity of these loci, there are also negative control regions that do not contain an origin (e.g. LB2C1, Myc1, and hORS8C) (60). Because we were interested in newly synthesized DNA levels, we first verified that total genomic DNA levels were unchanged upon DHX9 knockdown at the origins of replication (Fig. 8A). Loss of DHX9 resulted in a 3–6-fold decrease in the abundance of nascent DNA at all three origins, compared with the shFLuc.1309 controls (Fig. 8B). The regions containing no origins (LB2C1, Myc1, and hORS8C) showed background levels of nascent DNA. To determine whether DHX9 was present at the aforementioned origins of replication, chromatin IP (ChIP) was performed in MRC-5 cells using a DHX9 antibody, and the associated DNA abundance was determined by quantitative PCR using primers directed against each origin region. As controls, the ChIP was performed using antibodies against ORC2 and Ku86 (known to associate with origins) (60) and NFκB (previously shown not to associate with origins) (Fig. 8, C and D) (61). Our results show that the positive controls, ORC2 and Ku86, pulled down significant levels of LB2P, Myc11, and hORS8P DNA, whereas the same regions were not significantly enriched from NGS-treated samples. DNA from non-origin-containing sites (LB2C1, Myc1, and hORS8C) was also not enriched in DHX9 IPs. The DHX9 ChIP showed a DNA abundance that was intermediate between that of the positive and negative controls for all three origins of replication (Fig. 8D), indicating that DHX9 is associated with the origins of replication, but possibly that the association may not be as stable as it is for ORC2 or Ku86. Taken together, our results illustrate that loss of DHX9 is accompanied by a pronounced reduction in DNA replication, suggesting that DHX9 plays a role in this process.
FIGURE 8.

Loss of DHX9 inhibits DNA replication. A, copy number per haploid genome at the indicated chromosomal loci in MRC-5 cells transduced with a control (shFLuc.1309) or DHX9 shRNAs and harvested 6 days post-infection. Results are normalized to the shFLuc.1309 sample. Error bars represent S.D.; n = 3. B, quantification by qPCR of nascent DNA abundance (nanograms) at the indicated loci in MRC-5 cells transduced with a control (shFLuc.1309) or DHX9 shRNAs, 6 days post-transduction. The location and sequence information of the primers used for the amplification of the origin-containing regions (LB2P, Myc11, and hOrs8P; orange bars) and the non-origin-containing control regions (LB2C, Myc1, and hOrs8C; green bars) are as described in Table 1. Error bars represent S.D.; n = 3. C, Western blot analysis of the ChIP performed with the indicated proteins. Following ChIP, an aliquot of the IP was fractionated by SDS-PAGE, transferred to Immobilon-P, and probed with antibodies to the indicated proteins. D, quantification by qPCR of immunoprecipitated DNA abundance (nanograms) at the indicated chromosomal loci in MRC-5 cells transduced with a control (shFLuc.1309) or DHX9 shRNAs. Chromatin IP was performed with antibodies directed against ORC2 (red bars), Ku86 (light green bars), DHX9 (dark green bars), and NFκB (blue bars); NGS (purple bars) was used as a negative control. Error bars represent S.D.; n = 3.
Although the above results implicate a role for DHX9 in DNA replication, it is important to note that senescent cells may exhibit reduced levels of nascent DNA synthesis irrespective of the agent causing the senescence. To establish that DHX9 plays a direct role in DNA replication, we chose to assess levels of nascent DNA synthesis in MRC-5 cells transduced with a p53 shRNA in combination with a control (FLuc.1309) or DHX9 shRNAs. In these cells, the senescent phenotype is completely rescued by knockdown of p53 (Fig. 4); therefore, any effect on DNA replication would be independent of the senescence phenotype. We observed that loss of DHX9 results in a 2–4-fold decrease in the abundance of nascent DNA at the LB2P, Myc11, and hORS8P origins (Fig. 9B). This demonstrates that the inhibition of DNA replication occurs even in the absence of senescence and must therefore occur before the growth arrest and senescence phenotype.
FIGURE 9.

Inhibition of DNA replication occurs before DHX9-induced senescence. A, copy number per haploid genome at the indicated chromosomal loci in MRC-5 cells transduced with a p53 shRNA in combination with a control (shFLuc.1309) or DHX9 shRNAs. Results are normalized to the shFLuc.1309 sample. Error bars represent S.D.; n = 3. B, quantification by qPCR of nascent DNA abundance (nanograms) at the indicated loci in MRC-5 cells transduced with a p53 shRNA and either a control (FLuc.1309) or DHX9 shRNAs, 6 days post-transduction. The location and sequence information of the primers used for the amplification of the origin-containing regions (LB2P, Myc11, and hOrs8P; orange bars) and the non-origin-containing control regions (LB2C, Myc1, and hOrs8C; green bars) are as described in Table 1. Error bars represent S.D.; n = 3.
Given that the helicase and RNA-binding domains of DHX9 appeared to be essential for its role in inducing senescence, we examined whether these mutations had any effect on the ability of DHX9 to bind to origins. ChIP was performed in MRC-5 cells expressing the WT DHX9 cDNA or the K417N, D511A/E512A, and ΔRBDI+II mutants. PCR analysis of the abundance of LB2P, Myc11, and hORS8P DNA showed that none of the mutants affected the binding of DHX9 to any of these origins (Fig. 10, B–D), suggesting that these domains are not involved in binding to origins of replication.
FIGURE 10.

Binding of DHX9 to origins is not dependent on its helicase or RNA-binding domains. A, Western blot analysis of the ChIP performed with the indicated proteins. MRC-5 cells were transduced with a Myc-tagged construct expressing either the WT DHX9 cDNA or the K417N, D511A/E512A, or ΔRBDI+II mutants. Following ChIP, an aliquot of the IP was fractionated by SDS-PAGE, transferred to Immobilon-P, and probed with antibodies to the indicated proteins. B–D, quantification by qPCR of immunoprecipitated DNA abundance (nanograms) at the Lamin B2 (B), c-Myc (C), or hORS8 (D) chromosomal loci in MRC-5 cells expressing either the WT DHX9 cDNA or the K417N, D511A/E512A, or ΔRBDI+II mutants. Chromatin IP was performed with antibodies directed against ORC2 (red bars), Myc (green bars), and NFκB (gray bars). NGS (purple bars) was used as a negative control. Error bars represent S.D.; n = 3.
DISCUSSION
In this study, we show that loss of DHX9 results in premature senescence in primary human fibroblasts. This is characterized by distinctive morphological changes, elevated levels of SA-β-gal, and a pronounced growth arrest and is supported by a gene expression signature comparable with that of replicative senescence. Increased p53, p21, and RB1 activity was noted with p53 being essential for DHX9-induced senescence. We found DHX9 to be associated with origins of replication and demonstrated that levels of newly replicated DNA were significantly lower at various replication origins in DHX9-suppressed cells.
The stimuli for premature senescence are many and varied; however, a common feature is activation of either the p53 and/or p16-RB1 signaling pathways. Both p53 and RB1 are tumor suppressors that respond to various cellular signals such as DNA damage or oncogenic stimuli (62). Activation of p53 or RB1 leads to inhibition of downstream proliferative genes. Here, we showed that p53 and p21 protein levels increased upon DHX9 knockdown and that RB1 was activated. However, no increase in p16 levels was detected. Knocking down p53 rescued the senescent phenotype caused by DHX9 suppression, whereas suppression of RB1 had no effect, indicating that p53, but not RB1, is essential for this process. In the p16-RB1 pathway, p16 inhibits cyclin-dependent kinases (CDKs) such as cyclin D1, CDK4, and CDK6, which in turn maintain RB1 in its phosphorylated (inactive) form. Hence, an increase in p16 levels would result in a shift from the hyper- to the hypophosphorylated (active) form of RB1. Because of cross-talk between the p53 and RB1 pathways, RB1 can also be activated by increased levels of p21, which also inhibit CDKs independently of p16 (63). Our data suggest that the latter situation is occurring in DHX9-induced senescence; activated p53 transcriptionally activates p21, which inhibits CDKs, leading to activation of RB1. This is supported by the fact that knocking down p53 abolishes RB1 activation. Loss of RB1 does not prevent senescence because p21 alone is sufficient to lead to cell arrest independently of RB1.
Our microarray analysis identified many genes involved in mitosis, cell cycle progression, and DNA replication, which were down-regulated upon loss of DHX9, as well as activation of a p53 transcriptional program. This is consistent with our data showing growth arrest and p53/p21 activation (Figs. 1–3). Previously, our laboratory had performed expression profiling in Arf−/−Eμ-Myc lymphoma cells, where activation of p53 transcriptional targets upon DHX9 suppression was likewise observed (43). However, it should be noted that there is otherwise very little overlap between the expression profiles obtained upon suppression of DHX9 in MRC-5 cells compared with the Arf−/−Eμ-Myc lymphomas. For instance, down-regulation of genes involved in replication, mitosis, and cell cycle progression were not observed in the lymphoma setting. This is not surprising, given that loss of DHX9 elicits an apoptotic response in Arf−/−Eμ-Myc lymphomas, which could be attributed to elevated levels of Myc (a strong promoter of both apoptosis and DNA replication) in these cells (43). Indeed, overexpression of Myc in NIH3T3 fibroblasts can overcome the growth arrest, which suppressing DHX9 would otherwise cause (43). This indicates that induction of senescence is highly dependent on the particular biological wiring of the cell type in question, a notion supported by previous studies (64).
Based on our observation that many factors involved in DNA replication were found to be down-regulated in the microarray expression data, we explored this avenue as a potential mechanism through which loss of DHX9 may be inducing senescence. We found DHX9 to be present at origins of replication and that production of nascent DNA is inhibited at various well characterized replication origins upon DHX9 knockdown (Fig. 8). The ChIP results demonstrate that DHX9 is not as strongly associated with the origins of replication as Ku86 or ORC2, suggesting that DHX9 may not be directly associated with the origins or may be bound to the origins only a fraction of the time. This is perhaps consistent with its function as a helicase where DHX9 might be transiently present at a given location. Indeed, the structure-function analysis of DHX9 shows that both its helicase activity and RNA-binding functions are essential in this process (Fig. 7).
Although the above data suggest a role for DHX9 in DNA replication, the question remained as to whether the observed replication inhibition is a direct or indirect consequence of DHX9 suppression, because growth-arrested and senescent cells in general will exhibit reduced rates of DNA replication. We believed that DHX9 suppression was directly responsible for the inhibition of replication based on the fact that both the microarray and nascent DNA quantification experiments were performed at a time point where the shDHX9-transduced cells were pre-senescent (5–6 days post-transduction). Here, the DHX9 knockdown cells did not exhibit significant differences in morphology and SA-β-gal staining compared with the control cells (Fig. 1, A, B, and D, day 6 P.I.). Furthermore, the cell cycle distribution of DHX9-suppressed cells at this time point is similar to that of the shFLuc.1309 control, indicating that the cells are not yet growth-arrested (Fig. 2B, day 6 P.I.). To confirm that DHX9 knockdown directly affects DNA replication, we examined nascent DNA synthesis at various well characterized origins in a cell line that is resistant to DHX9-induced senescence. MRC-5 cells expressing the p53 shRNA showed a significant decrease in nascent DNA production upon DHX9 knockdown, despite exhibiting no significant growth defects or markers of senescence (Figs. 9 and 4). This implies that the blockage in replication occurs upstream of the p53 pathway and is likely a cause of the growth arrest and senescent phenotype when p53 is present. We have also previously observed inhibition of DNA replication in the absence of senescence in NIH3T3 cells overexpressing Myc (Figs. 5A and 6F) (43). In both the p53-knockdown and Myc-overexpression scenarios, cell cycle progression is allowed to occur in the presence of replication stress either due to the absence of a checkpoint control (p53) or the presence of a strong promoter of proliferation (Myc). Taken together, our results indicate that the observed down-regulation in genes associated with DNA replication and cell cycle progression, and the reduction in nascent DNA synthesis, is an effect of DHX9 suppression rather than an indirect consequence of the senescence itself.
To gain additional mechanistic insight into the role of DHX9 in DNA replication, we assessed the ability of some DHX9 mutants to bind to origins of replication. Despite being essential to the role of DHX9 in senescence, the helicase and RNA-binding mutants had no effect on the binding of DHX9 to the three origins tested. This suggests that these domains are not involved in the binding of DHX9 to the DNA but may have other functions at the origins. Further experiments would need to be performed to determine the specific role of DHX9 in DNA replication. It may be required to aid in the opening of the origins, to resolve tertiary structures at the origins, or to clear transcripts from the origins (because the ones studied herein occur near promoter regions).
Because p53 signaling is activated by a myriad of signals, we also investigated other possible mechanisms through which DHX9 may be inducing senescence. One possibility would be through infliction of DNA damage. We examined markers of DNA damage, phospho-H2A.X (Ser-139), and 53BP1, and we failed to detect an increase in levels of these proteins upon DHX9 suppression (Fig. 3B and data not shown). In addition, no increase was detected in markers of replicative stress, such as ATR and phospho-Chk1 (Ser-345) (Fig. 3). Thus, it is likely that DHX9-mediated senescence is caused by a blockage in replication rather than DNA damage.
The link between replication inhibition, p53 activation, and cell cycle arrest has been previously documented. In a study by Taylor et al. (65), inhibition of DNA synthesis using hydroxyurea or aphidicolin led to increased levels of p53 and p21 and resulted in inhibition of entry into mitosis. Machida et al. (66) demonstrated that low levels of replication initiator proteins caused cells to arrest in the G1 phase. Furthermore, p21 has been found to associate with proliferating cell nuclear antigen, a DNA replication factor (67). Based on our data, we propose the following model: under normal cellular conditions, DHX9, in concert with other origin-interacting proteins such as origin recognition complexes and replication factors, facilitates proper assembly of the pre-replicative complex at origins of replication, leading to DNA replication (Fig. 11). In the absence of DHX9, DNA replication is inhibited, possibly due to the inability of the pre-replicative complex to form. This activates a p53-dependent stress response, leading to transcriptional activation of p21, which inhibits CDKs (Fig. 11). Because CDKs normally inactivate RB1, the result is a shift from the inactive to active form of RB1, which suppresses the E2F family of transcription factors and prevents transcription of genes involved in cell proliferation. In addition, p21 may also lead to cell cycle arrest and senescence independently of RB1. This may involve direct suppression of DNA replication factors or inhibition of E2F-independent cell cycle progression or mitotic proteins.
FIGURE 11.
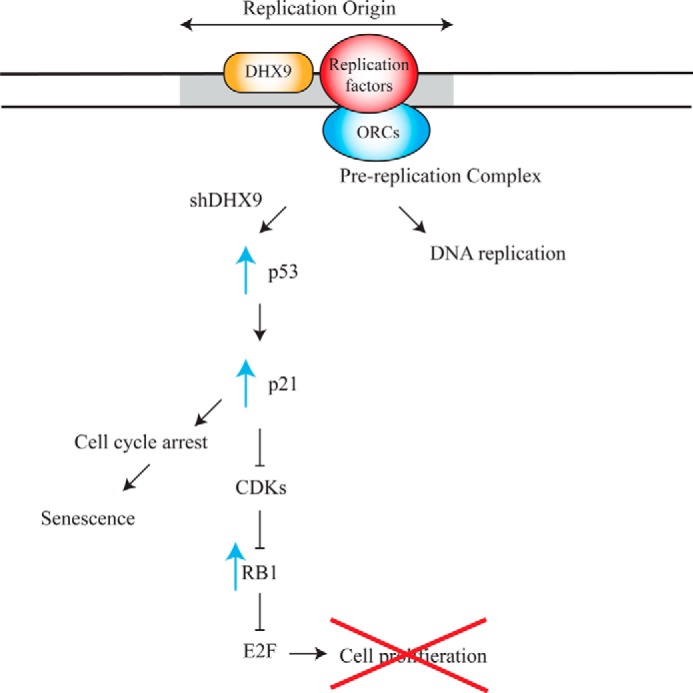
Model highlighting the mechanism by which DHX9 suppression leads to senescence. Under normal cellular conditions, DHX9 facilitates DNA replication at origins of replication. Loss of DHX9 leads to inhibition of DNA replication at origins of replication. This results in a defect in downstream recruitment of factors onto chromatin, which activates a p53 stress response leading to transcriptional activation of p21. Activation of p21 inhibits downstream CDKs and prevents RB1 phosphorylation, which inhibits E2F and blocks transcription of genes required for proliferation. Additionally, p21 may affect cell cycle arrest independent of RB1. Genes involved in DNA replication, cell cycle progression, and mitosis are down-regulated upon DHX9 knockdown, contributing to the growth arrest (see “Discussion” for details).
Inhibition of cell cycle progression upon low levels of replication is an important mechanism in protecting cells from aberrant DNA replication and genomic instability. Our findings support previous data implicating DHX9 in DNA replication and maintenance of genomic stability. DHX9 has been found to be associated with components of the DNA replication machinery (e.g. BRCA1, proliferating cell nuclear antigen, and TOP2A) (68). It stimulates the unwinding of Okazaki fragment-like DNA:RNA hybrids in vitro by WRN, a RecQ helicase that, when mutated, results in genomic instability (69) and may be implicated in a role involving lagging strand synthesis. DHX9 is able to unwind noncanonical DNA structures such as triple helices, aberrant structures that induce double-stranded breaks and promote genomic rearrangements (30, 40). By resolving these structures, DHX9 aids in maintaining genomic stability. DHX9 has been shown to interact with Ku86, an essential protein in NHEJ-mediated DNA repair that has more recently been implicated in promoting nascent DNA synthesis at origins of replication (60). It is quite possible that DHX9 and Ku86 may act in concert at the origins of replication. In addition, because DHX9 is a multifunctional protein, some of its other functions may contribute to the senescence phenotype. In particular, transcription-related activities of DHX9 could play a role in up-regulating genes involved in cell cycle arrest or down-regulating genes involved in growth and cell cycle progression. DHX9's involvement in miRNA and translational regulation may also contribute. For example, DHX9 has been found to associate with both the insulin-like growth factor 2 (IGF2) mRNA and miR-483-5p, an miRNA that enhances transcription of IGF2; DHX9 promotes the miR-483-5p-mediated induction of IGF2 mRNA (70). IGF2, which plays an essential role in growth and development, has been shown to be involved in senescence, along with other proteins in the IGF signaling pathway (71, 72).
Our results present DHX9 as a somewhat unique agent whose suppression leads to premature senescence. In most cases where the p53 pathway is activated, senescence is accompanied by the presence of DNA damage and involves activation of the DNA damage response (73). This is obviously the case for premature senescence caused by DNA-damaging agents such as etoposide or IR. It has also been shown that oncogene-induced senescence is a consequence of a DNA damage response triggered by DNA hyper-replication. Di Micco et al. (74) demonstrated that Ras-induced senescence resulted in accumulation of DNA breaks and activation of an ATR-dependent DNA damage response. Replicative senescence occurs when erosion of telomeres activates the DNA damage response (4, 59, 75). DHX9-induced senescence, however, appears to occur in the absence of DNA damage. Instead, this particular type of premature senescence is brought on by a defect in replication, which triggers a stress-response program. It has previously been demonstrated that inhibition of replication upon suppression of the DHX9 interaction partner Ku86 results in growth arrest in the absence of markers of DNA damage (60). Hence, it is conceivable that inhibition of DNA replication in general may represent a DNA damage-independent mechanism of causing growth arrest and premature senescence. In conclusion, our data have uncovered a novel role for DHX9 in replication and senescence and contributes to an increased understanding of the biological function of this multifaceted helicase.
Supplementary Material
Acknowledgment
Bright field images were taken at the McGill Advanced BioImaging Facility.
This work was supported, in whole or in part, by National Institutes of Health Grant CA163291 (to J. P.). This work was also supported by Canadian Institutes of Health Research Grant MOP-115126, the Swedish Research Council and Swedish Cancer Society grants (to O. L.), and the Strategic Training Initiative in Chemical Biology and the Systems Biology training program fellowships from the Canadian Institutes of Health Research (to T. L.).

This article contains supplemental Table S1.
- SA-β-gal
- senescence-associated β-galactosidase
- NGS
- normal goat serum
- CDK
- cyclin-dependent kinase
- FDR
- false discovery rate
- MSCV
- murine stem cell virus
- ATR
- ATM and Rad3-related protein
- IP
- immunoprecipitation
- P.I.
- post-infection
- qRT
- quantitative RT
- qPCR
- quantitative PCR.
REFERENCES
- 1. Hayflick L., Moorhead P. S. (1961) The serial cultivation of human diploid cell strains. Exp. Cell Res. 25, 585–621 [DOI] [PubMed] [Google Scholar]
- 2. Olovnikov A. M. (1971) Principle of marginotomy in template synthesis of polynucleotides. Dokl. Akad. Nauk SSSR 201, 1496–1499 [PubMed] [Google Scholar]
- 3. Watson J. D. (1972) Origin of concatemeric T7 DNA. Nat. New Biol. 239, 197–201 [DOI] [PubMed] [Google Scholar]
- 4. Herbig U., Jobling W. A., Chen B. P., Chen D. J., Sedivy J. M. (2004) Telomere shortening triggers senescence of human cells through a pathway involving ATM, p53, and p21(CIP1), but not p16(INK4a). Mol. Cell 14, 501–513 [DOI] [PubMed] [Google Scholar]
- 5. Robles S. J., Buehler P. W., Negrusz A., Adami G. R. (1999) Permanent cell cycle arrest in asynchronously proliferating normal human fibroblasts treated with doxorubicin or etoposide but not camptothecin. Biochem. Pharmacol. 58, 675–685 [DOI] [PubMed] [Google Scholar]
- 6. Di Leonardo A., Linke S. P., Clarkin K., Wahl G. M. (1994) DNA damage triggers a prolonged p53-dependent G1 arrest and long-term induction of Cip1 in normal human fibroblasts. Genes Dev. 8, 2540–2551 [DOI] [PubMed] [Google Scholar]
- 7. Chen Q. M., Prowse K. R., Tu V. C., Purdom S., Linskens M. H. (2001) Uncoupling the senescent phenotype from telomere shortening in hydrogen peroxide-treated fibroblasts. Exp. Cell Res. 265, 294–303 [DOI] [PubMed] [Google Scholar]
- 8. Monasor A., Murga M., Lopez-Contreras A. J., Navas C., Gomez G., Pisano D. G., Fernandez-Capetillo O. (2013) INK4a/ARF limits the expansion of cells suffering from replication stress. Cell Cycle 12, 1948–1954 [DOI] [PMC free article] [PubMed] [Google Scholar]
- 9. Michaloglou C., Vredeveld L. C., Soengas M. S., Denoyelle C., Kuilman T., van der Horst C. M., Majoor D. M., Shay J. W., Mooi W. J., Peeper D. S. (2005) BRAFE600-associated senescence-like cell cycle arrest of human naevi. Nature 436, 720–724 [DOI] [PubMed] [Google Scholar]
- 10. Lin A. W., Barradas M., Stone J. C., van Aelst L., Serrano M., Lowe S. W. (1998) Premature senescence involving p53 and p16 is activated in response to constitutive MEK/MAPK mitogenic signaling. Genes Dev. 12, 3008–3019 [DOI] [PMC free article] [PubMed] [Google Scholar]
- 11. Zhu J., Woods D., McMahon M., Bishop J. M. (1998) Senescence of human fibroblasts induced by oncogenic Raf. Genes Dev. 12, 2997–3007 [DOI] [PMC free article] [PubMed] [Google Scholar]
- 12. Serrano M., Lin A. W., McCurrach M. E., Beach D., Lowe S. W. (1997) Oncogenic ras provokes premature cell senescence associated with accumulation of p53 and p16INK4a. Cell 88, 593–602 [DOI] [PubMed] [Google Scholar]
- 13. Courtois-Cox S., Genther Williams S. M., Reczek E. E., Johnson B. W., McGillicuddy L. T., Johannessen C. M., Hollstein P. E., MacCollin M., Cichowski K. (2006) A negative feedback signaling network underlies oncogene-induced senescence. Cancer Cell 10, 459–472 [DOI] [PMC free article] [PubMed] [Google Scholar]
- 14. Chen Z., Trotman L. C., Shaffer D., Lin H. K., Dotan Z. A., Niki M., Koutcher J. A., Scher H. I., Ludwig T., Gerald W., Cordon-Cardo C., Pandolfi P. P. (2005) Crucial role of p53-dependent cellular senescence in suppression of Pten-deficient tumorigenesis. Nature 436, 725–730 [DOI] [PMC free article] [PubMed] [Google Scholar]
- 15. Gray M. D., Shen J. C., Kamath-Loeb A. S., Blank A., Sopher B. L., Martin G. M., Oshima J., Loeb L. A. (1997) The Werner syndrome protein is a DNA helicase. Nat. Genet. 17, 100–103 [DOI] [PubMed] [Google Scholar]
- 16. Pichierri P., Ammazzalorso F., Bignami M., Franchitto A. (2011) The Werner syndrome protein: linking the replication checkpoint response to genome stability. Aging 3, 311–318 [DOI] [PMC free article] [PubMed] [Google Scholar]
- 17. Cheok C. F., Bachrati C. Z., Chan K. L., Ralf C., Wu L., Hickson I. D. (2005) Roles of the Bloom's syndrome helicase in the maintenance of genome stability. Biochem. Soc. Trans. 33, 1456–1459 [DOI] [PubMed] [Google Scholar]
- 18. Langlois R. G., Bigbee W. L., Jensen R. H., German J. (1989) Evidence for increased in vivo mutation and somatic recombination in Bloom's syndrome. Proc. Natl. Acad. Sci. U.S.A. 86, 670–674 [DOI] [PMC free article] [PubMed] [Google Scholar]
- 19. Jee H. J., Kim H. J., Kim A. J., Song N., Kim M., Lee H. J., Yun J. (2013) The inhibition of Nek6 function sensitizes human cancer cells to premature senescence upon serum reduction or anticancer drug treatment. Cancer Lett. 335, 175–182 [DOI] [PubMed] [Google Scholar]
- 20. Chang B. D., Swift M. E., Shen M., Fang J., Broude E. V., Roninson I. B. (2002) Molecular determinants of terminal growth arrest induced in tumor cells by a chemotherapeutic agent. Proc. Natl. Acad. Sci. U.S.A. 99, 389–394 [DOI] [PMC free article] [PubMed] [Google Scholar]
- 21. Luo H., Wang L., Schulte B. A., Yang A., Tang S., Wang G. Y. (2013) Resveratrol enhances ionizing radiation-induced premature senescence in lung cancer cells. Int. J. Oncol. 43, 1999–2006 [DOI] [PMC free article] [PubMed] [Google Scholar]
- 22. Braig M., Lee S., Loddenkemper C., Rudolph C., Peters A. H., Schlegelberger B., Stein H., Dörken B., Jenuwein T., Schmitt C. A. (2005) Oncogene-induced senescence as an initial barrier in lymphoma development. Nature 436, 660–665 [DOI] [PubMed] [Google Scholar]
- 23. Sherwood S. W., Rush D., Ellsworth J. L., Schimke R. T. (1988) Defining cellular senescence in IMR-90 cells: a flow cytometric analysis. Proc. Natl. Acad. Sci. U.S.A. 85, 9086–9090 [DOI] [PMC free article] [PubMed] [Google Scholar]
- 24. Denoyelle C., Abou-Rjaily G., Bezrookove V., Verhaegen M., Johnson T. M., Fullen D. R., Pointer J. N., Gruber S. B., Su L. D., Nikiforov M. A., Kaufman R. J., Bastian B. C., Soengas M. S. (2006) Anti-oncogenic role of the endoplasmic reticulum differentially activated by mutations in the MAPK pathway. Nat. Cell Biol. 8, 1053–1063 [DOI] [PubMed] [Google Scholar]
- 25. Bayreuther K., Rodemann H. P., Hommel R., Dittmann K., Albiez M., Francz P. I. (1988) Human skin fibroblasts in vitro differentiate along a terminal cell lineage. Proc. Natl. Acad. Sci. U.S.A. 85, 5112–5116 [DOI] [PMC free article] [PubMed] [Google Scholar]
- 26. Dimri G. P., Lee X., Basile G., Acosta M., Scott G., Roskelley C., Medrano E. E., Linskens M., Rubelj I., Pereira-Smith O. (1995) A biomarker that identifies senescent human cells in culture and in aging skin in vivo. Proc. Natl. Acad. Sci. U.S.A. 92, 9363–9367 [DOI] [PMC free article] [PubMed] [Google Scholar]
- 27. Zhang H., Pan K. H., Cohen S. N. (2003) Senescence-specific gene expression fingerprints reveal cell-type-dependent physical clustering of up-regulated chromosomal loci. Proc. Natl. Acad. Sci. U.S.A. 100, 3251–3256 [DOI] [PMC free article] [PubMed] [Google Scholar]
- 28. Alcorta D. A., Xiong Y., Phelps D., Hannon G., Beach D., Barrett J. C. (1996) Involvement of the cyclin-dependent kinase inhibitor p16 (INK4a) in replicative senescence of normal human fibroblasts. Proc. Natl. Acad. Sci. U.S.A. 93, 13742–13747 [DOI] [PMC free article] [PubMed] [Google Scholar]
- 29. Zhang S., Grosse F. (1994) Nuclear DNA helicase II unwinds both DNA and RNA. Biochemistry 33, 3906–3912 [DOI] [PubMed] [Google Scholar]
- 30. Jain A., Bacolla A., Chakraborty P., Grosse F., Vasquez K. M. (2010) Human DHX9 helicase unwinds triple-helical DNA structures. Biochemistry 49, 6992–6999 [DOI] [PMC free article] [PubMed] [Google Scholar]
- 31. Zhang S. S., Grosse F. (1991) Purification and characterization of two DNA helicases from calf thymus nuclei. J. Biol. Chem. 266, 20483–20490 [PubMed] [Google Scholar]
- 32. Zhang S., Grosse F. (1997) Domain structure of human nuclear DNA helicase II (RNA helicase A). J. Biol. Chem. 272, 11487–11494 [DOI] [PubMed] [Google Scholar]
- 33. Huo L., Wang Y. N., Xia W., Hsu S. C., Lai C. C., Li L. Y., Chang W. C., Wang Y., Hsu M. C., Yu Y. L., Huang T. H., Ding Q., Chen C. H., Tsai C. H., Hung M. C. (2010) RNA helicase A is a DNA-binding partner for EGFR-mediated transcriptional activation in the nucleus. Proc. Natl. Acad. Sci. U.S.A. 107, 16125–16130 [DOI] [PMC free article] [PubMed] [Google Scholar]
- 34. Nakajima T., Uchida C., Anderson S. F., Lee C. G., Hurwitz J., Parvin J. D., Montminy M. (1997) RNA helicase A mediates association of CBP with RNA polymerase II. Cell 90, 1107–1112 [DOI] [PubMed] [Google Scholar]
- 35. Anderson S. F., Schlegel B. P., Nakajima T., Wolpin E. S., Parvin J. D. (1998) BRCA1 protein is linked to the RNA polymerase II holoenzyme complex via RNA helicase A. Nat. Genet. 19, 254–256 [DOI] [PubMed] [Google Scholar]
- 36. Hartman T. R., Qian S., Bolinger C., Fernandez S., Schoenberg D. R., Boris-Lawrie K. (2006) RNA helicase A is necessary for translation of selected messenger RNAs. Nat. Struct. Mol. Biol. 13, 509–516 [DOI] [PubMed] [Google Scholar]
- 37. Manojlovic Z., Stefanovic B. (2012) A novel role of RNA helicase A in regulation of translation of type I collagen mRNAs. RNA 18, 321–334 [DOI] [PMC free article] [PubMed] [Google Scholar]
- 38. Tang H., Gaietta G. M., Fischer W. H., Ellisman M. H., Wong-Staal F. (1997) A cellular cofactor for the constitutive transport element of type D retrovirus. Science 276, 1412–1415 [DOI] [PubMed] [Google Scholar]
- 39. Robb G. B., Rana T. M. (2007) RNA helicase A interacts with RISC in human cells and functions in RISC loading. Mol. Cell 26, 523–537 [DOI] [PubMed] [Google Scholar]
- 40. Jain A., Bacolla A., Del Mundo I. M., Zhao J., Wang G., Vasquez K. M. (2013) DHX9 helicase is involved in preventing genomic instability induced by alternatively structured DNA in human cells. Nucleic Acids Res. 41, 10345–10357 [DOI] [PMC free article] [PubMed] [Google Scholar]
- 41. Chakraborty P., Grosse F. (2011) Human DHX9 helicase preferentially unwinds RNA-containing displacement loops (R-loops) and G-quadruplexes. DNA Repair 10, 654–665 [DOI] [PubMed] [Google Scholar]
- 42. Zhang S., Schlott B., Görlach M., Grosse F. (2004) DNA-dependent protein kinase (DNA-PK) phosphorylates nuclear DNA helicase II/RNA helicase A and hnRNP proteins in an RNA-dependent manner. Nucleic Acids Res. 32, 1–10 [DOI] [PMC free article] [PubMed] [Google Scholar]
- 43. Mills J. R., Malina A., Lee T., Di Paola D., Larsson O., Miething C., Grosse F., Tang H., Zannis-Hadjopoulos M., Lowe S. W., Pelletier J. (2013) RNAi screening uncovers Dhx9 as a modifier of ABT-737 resistance in an Emu-myc/Bcl-2 mouse model. Blood 121, 3402–3412 [DOI] [PMC free article] [PubMed] [Google Scholar]
- 44. Szulc J., Wiznerowicz M., Sauvain M. O., Trono D., Aebischer P. (2006) A versatile tool for conditional gene expression and knockdown. Nat. Methods 3, 109–116 [DOI] [PubMed] [Google Scholar]
- 45. Chicas A., Wang X., Zhang C., McCurrach M., Zhao Z., Mert O., Dickins R. A., Narita M., Zhang M., Lowe S. W. (2010) Dissecting the unique role of the retinoblastoma tumor suppressor during cellular senescence. Cancer Cell 17, 376–387 [DOI] [PMC free article] [PubMed] [Google Scholar]
- 46. Barde I., Salmon P., Trono D. (2010) Production and titration of lentiviral vectors. Curr. Protoc. Neurosci. 10.1002/0471142301.ns0421s53 [DOI] [PubMed] [Google Scholar]
- 47. Stegmeier F., Hu G., Rickles R. J., Hannon G. J., Elledge S. J. (2005) A lentiviral microRNA-based system for single-copy polymerase II-regulated RNA interference in mammalian cells. Proc. Natl. Acad. Sci. U.S.A. 102, 13212–13217 [DOI] [PMC free article] [PubMed] [Google Scholar]
- 48. Darzynkiewicz Z., Juan G. (2001) Analysis of DNA content and BrdU incorporation. Curr. Protocol. Cytom. 2, 7.7.1–7.7.9 [DOI] [PubMed] [Google Scholar]
- 49. Liu Z., Kenworthy R., Green C., Tang H. (2007) Molecular determinants of nucleolar translocation of RNA helicase A. Exp. Cell Res. 313, 3743–3754 [DOI] [PubMed] [Google Scholar]
- 50. Dai C., Whitesell L., Rogers A. B., Lindquist S. (2007) Heat shock factor 1 is a powerful multifaceted modifier of carcinogenesis. Cell 130, 1005–1018 [DOI] [PMC free article] [PubMed] [Google Scholar]
- 51. Sandberg R., Larsson O. (2007) Improved precision and accuracy for microarrays using updated probe set definitions. BMC Bioinformatics 8, 48. [DOI] [PMC free article] [PubMed] [Google Scholar]
- 52. Wright G. W., Simon R. M. (2003) A random variance model for detection of differential gene expression in small microarray experiments. Bioinformatics 19, 2448–2455 [DOI] [PubMed] [Google Scholar]
- 53. Benjamini Y., Hochberg Y. (1995) Controlling the false discovery rate: a practical and powerful approach to multiple testing. J. Roy. Stat. Soc. B Met. 57, 289–300 [Google Scholar]
- 54. Luo W., Friedman M. S., Shedden K., Hankenson K. D., Woolf P. J. (2009) GAGE: generally applicable gene set enrichment for pathway analysis. BMC Bioinformatics 10, 161. [DOI] [PMC free article] [PubMed] [Google Scholar]
- 55. Di Paola D., Price G. B., Zannis-Hadjopoulos M. (2006) Differentially active origins of DNA replication in tumor versus normal cells. Cancer Res. 66, 5094–5103 [DOI] [PubMed] [Google Scholar]
- 56. Di Paola D., Zannis-Hadjopoulos M. (2012) Comparative analysis of pre-replication complex proteins in transformed and normal cells. J. Cell. Biochem. 113, 1333–1347 [DOI] [PubMed] [Google Scholar]
- 57. Leontieva O. V., Natarajan V., Demidenko Z. N., Burdelya L. G., Gudkov A. V., Blagosklonny M. V. (2012) Hypoxia suppresses conversion from proliferative arrest to cellular senescence. Proc. Natl. Acad. Sci. U.S.A. 109, 13314–13318 [DOI] [PMC free article] [PubMed] [Google Scholar]
- 58. Kosar M., Bartkova J., Hubackova S., Hodny Z., Lukas J., Bartek J. (2011) Senescence-associated heterochromatin foci are dispensable for cellular senescence, occur in a cell type- and insult-dependent manner and follow expression of p16(ink4a). Cell Cycle 10, 457–468 [DOI] [PubMed] [Google Scholar]
- 59. d'Adda di Fagagna F., Reaper P. M., Clay-Farrace L., Fiegler H., Carr P., Von Zglinicki T., Saretzki G., Carter N. P., Jackson S. P. (2003) A DNA damage checkpoint response in telomere-initiated senescence. Nature 426, 194–198 [DOI] [PubMed] [Google Scholar]
- 60. Rampakakis E., Di Paola D., Zannis-Hadjopoulos M. (2008) Ku is involved in cell growth, DNA replication and G1-S transition. J. Cell Sci. 121, 590–600 [DOI] [PubMed] [Google Scholar]
- 61. Meyer R., Hatada E. N., Hohmann H. P., Haiker M., Bartsch C., Röthlisberger U., Lahm H. W., Schlaeger E. J., van Loon A. P., Scheidereit C. (1991) Cloning of the DNA-binding subunit of human nuclear factor κB: the level of its mRNA is strongly regulated by phorbol ester or tumor necrosis factor α. Proc. Natl. Acad. Sci. U.S.A. 88, 966–970 [DOI] [PMC free article] [PubMed] [Google Scholar]
- 62. Kohn R. R. (1975) Aging and cell division. Science 188, 203–204 [DOI] [PubMed] [Google Scholar]
- 63. Campisi J., d'Adda di Fagagna F. (2007) Cellular senescence: when bad things happen to good cells. Nat. Rev. Mol. Cell Biol. 8, 729–740 [DOI] [PubMed] [Google Scholar]
- 64. Ventura A., Kirsch D. G., McLaughlin M. E., Tuveson D. A., Grimm J., Lintault L., Newman J., Reczek E. E., Weissleder R., Jacks T. (2007) Restoration of p53 function leads to tumour regression in vivo. Nature 445, 661–665 [DOI] [PubMed] [Google Scholar]
- 65. Taylor W. R., Agarwal M. L., Agarwal A., Stacey D. W., Stark G. R. (1999) p53 inhibits entry into mitosis when DNA synthesis is blocked. Oncogene 18, 283–295 [DOI] [PubMed] [Google Scholar]
- 66. Machida Y. J., Teer J. K., Dutta A. (2005) Acute reduction of an origin recognition complex (ORC) subunit in human cells reveals a requirement of ORC for Cdk2 activation. J. Biol. Chem. 280, 27624–27630 [DOI] [PubMed] [Google Scholar]
- 67. Zhang H., Xiong Y., Beach D. (1993) Proliferating cell nuclear antigen and p21 are components of multiple cell cycle kinase complexes. Mol. Biol. Cell 4, 897–906 [DOI] [PMC free article] [PubMed] [Google Scholar]
- 68. Schlegel B. P., Starita L. M., Parvin J. D. (2003) Overexpression of a protein fragment of RNA helicase A causes inhibition of endogenous BRCA1 function and defects in ploidy and cytokinesis in mammary epithelial cells. Oncogene 22, 983–991 [DOI] [PubMed] [Google Scholar]
- 69. Chakraborty P., Grosse F. (2010) WRN helicase unwinds Okazaki fragment-like hybrids in a reaction stimulated by the human DHX9 helicase. Nucleic Acids Res. 38, 4722–4730 [DOI] [PMC free article] [PubMed] [Google Scholar]
- 70. Liu M., Roth A., Yu M., Morris R., Bersani F., Rivera M. N., Lu J., Shioda T., Vasudevan S., Ramaswamy S., Maheswaran S., Diederichs S., Haber D. A. (2013) The IGF2 intronic miR-483 selectively enhances transcription from IGF2 fetal promoters and enhances tumorigenesis. Genes Dev. 27, 2543–2548 [DOI] [PMC free article] [PubMed] [Google Scholar]
- 71. Kim K. S., Seu Y. B., Baek S. H., Kim M. J., Kim K. J., Kim J. H., Kim J. R. (2007) Induction of cellular senescence by insulin-like growth factor binding protein-5 through a p53-dependent mechanism. Mol. Biol. Cell 18, 4543–4552 [DOI] [PMC free article] [PubMed] [Google Scholar]
- 72. Fu V. X., Schwarze S. R., Kenowski M. L., Leblanc S., Svaren J., Jarrard D. F. (2004) A loss of insulin-like growth factor-2 imprinting is modulated by CCCTC-binding factor down-regulation at senescence in human epithelial cells. J. Biol. Chem. 279, 52218–52226 [DOI] [PubMed] [Google Scholar]
- 73. d'Adda di Fagagna F. (2008) Living on a break: cellular senescence as a DNA-damage response. Nat. Rev. Cancer 8, 512–522 [DOI] [PubMed] [Google Scholar]
- 74. Di Micco R., Fumagalli M., Cicalese A., Piccinin S., Gasparini P., Luise C., Schurra C., Garre' M., Nuciforo P. G., Bensimon A., Maestro R., Pelicci P. G., d'Adda di Fagagna F. (2006) Oncogene-induced senescence is a DNA damage response triggered by DNA hyper-replication. Nature 444, 638–642 [DOI] [PubMed] [Google Scholar]
- 75. Takai H., Smogorzewska A., de Lange T. (2003) DNA damage foci at dysfunctional telomeres. Curr. Biol. 13, 1549–1556 [DOI] [PubMed] [Google Scholar]
Associated Data
This section collects any data citations, data availability statements, or supplementary materials included in this article.