

Abstract
The epidermal growth factor receptor (EGFR) is aberrantly activated in various cancer cells and an important target for cancer treatment. Deep understanding of EGFR conformational changes between the active and inactive states is of pharmaceutical interest. Here we present a strategy combining multiply targeted molecular dynamics simulations, unbiased molecular dynamics simulations, and Bayesian clustering to investigate transition pathways during the activation/inactivation process of EGFR kinase domain. Two distinct pathways between the active and inactive forms are designed, explored, and compared. Based on Bayesian clustering and rough two-dimensional free energy surfaces, the energy-favorable pathway is recognized, though DFG-flip happens in both pathways. In addition, another pathway with different intermediate states appears in our simulations. Comparison of distinct pathways also indicates that disruption of the Lys745-Glu762 interaction is critically important in DFG-flip while movement of the A-loop significantly facilitates the conformational change. Our simulations yield new insights into EGFR conformational transitions. Moreover, our results verify that this approach is valid and efficient in sampling of protein conformational changes and comparison of distinct pathways.
1. Introduction
Protein is intrinsically dynamical, and conformational changes are essential to its functions. Large-scale conformational rearrangements are involved in signaling transduction, enzyme catalysis, and protein folding.1 Molecular dynamics (MD) simulations are a powerful tool to model such motions and deepen our understanding of the relationship between protein structure and function.2 Studies of protein conformational changes and the intermediates that are formed along the transition pathway provide valuable insights into the process by which the protein is activated or inactivated. However, characterization of the transition pathway and intermediates as well as establishing their role in conformational rearrangements remains a major challenge.
To tackle this problem, a plethora of methods have been developed to enhance sampling of the conformational change, which is a rare event. A straightforward approach is to run ultralong unbiased MD simulations.3 It is, however, still difficult to obtain adequate sampling of conformational changes which usually occur on microsecond to millisecond time scales or beyond, especially for a large biomolecular system. To overcome this limitation, a variety of biased methods have been proposed. One approach aims to speed up conformational transitions by use of elevated temperatures or a biasing potential such as parallel tempering or replica exchange MD (REMD),4,5 umbrella sampling,6 metadynamics,7,8 accelerated MD,9,10 temperature-accelerated MD,11 adaptive biasing force,12 and so on. REMD and its variants are popular in sampling rare events while its efficiency has been discussed in detail.13−17 For a bias potential, a finite number of collective variables (order parameters) needs to be defined for description of transitions. Selection of collective variables is not trivial and has been discussed in depth.18 The other class of rare events method, path-based sampling, is of greatest relevance to the present work. These path-building techniques have been developed to construct a path between two end points, including milestoning,19 the string method,20 path metadynamics,21 transition path sampling,22,23 weighted ensemble,24,25 fast marching method,26 nudged elastic band,27,28 targeted MD (TMD),29 steered MD,30,31 and so on. These approaches have been applied for exploration of large-scale conformational changes of biomolecules. One or a few transition pathways can be reconstructed with any method. However, fundamental questions still remain to be answered. How can these pathways be compared? Which one is the most likely transition pathway?
Here we present a strategy combining multiply targeted MD (MTMD), unbiased MD simulations, and Bayesian clustering to address these questions. This approach is helpful not only for exploration of transition pathways and metastable states along them but also for comparison of distinct pathways. In our method, the phase space is first partitioned by a series of seeding structures, which are generated by MTMD. Then, a long unbiased MD simulation (200 ns) is initiated on each seeding structure to achieve local equilibration and explore the subspace. The ensemble of MD trajectories is analyzed by a clustering method based on the Bayesian model to determine metastable states and transitions between them. The strategy of running multiple MD trajectories for sampling rare events has been investigated previously.19,25,32,33 The improvements in our approach are that, (i) with MTMD, we can define transition pathways from an initial state to a final state via different intermediate states; (ii) the seeding structures are not necessary to be in equilibrium; (iii) long unbiased MD simulations are performed to explore likely transitions between neighboring seeding structures; (iv) specification of collective variables is not needed; and (v) Bayesian clustering is carried out to reconstruct conformational transitions from the ensemble of MD trajectories. With these features, it is likely to design different transition pathways between two end points and compare them. The initial structure, final structure, and intermediate structures can be obtained from previous crystallographic studies or MD simulations.
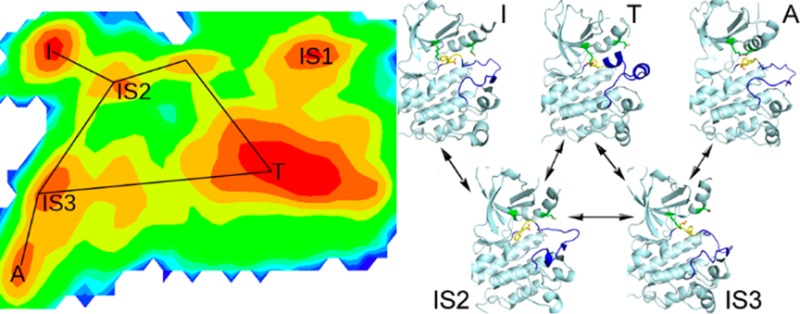
To test this approach, we apply it to the activation/inactivation process of the kinase domain of the epidermal growth factor receptor (EGFR). EGFR, a receptor tyrosine kinase, has emerged as a target of choice for treatment of various cancers.34 Crystallographic studies have revealed different conformational states of EGFR kinase domain (Supporting Information (SI) Figure S1): the DFG-in active state (A), the Src-like inactive state (T), and the DFG-out inactive state (I). For simplicity, we will use A, T, and I in the following to represent these three forms, respectively. The major structural changes among them are movement of the activation loop (A-loop), DFG-flip (conversion between DFG-in and DFG-out), and displacement of αC helix. In form A, it adopts DFG-in conformation; the A-loop is in the extended state; Glu762 located in αC helix forms a salt bridge with Lys745, which is highly conserved and important for kinase activity.35 Form I adopts DFG-out conformation, and the A-loop is also extended while Lys745 and Glu762 (the ion pair) are separated because of outward rotation of the αC helix. Form T adopts the DFG-in conformation, and the ion pair are apart from each other while the A-loop is in the compact mode. The mechanism that controls the transition from inactive forms of kinases to active ones as well as intermediate states has attracted much interest.33,36−43 Based on analysis of Abl crystal structures and molecular simulations, it was proposed that the Src-like inactive form (T) functioned as an intermediate in the activation pathway to facilitate DFG-flip.44 This assumption was supported by computer simulations of EGFR and other kinases.37,41,42 However, it is still not clear if DFG-flip can happen without passing form T. If it is likely, is any intermediate state involved which has not been determined experimentally? In addition, the roles of A-loop and αC helix in this process need to be elucidated. Deep understanding of the activation/inactivation pathways and intermediate states of kinases will be helpful for development of high specific anticancer drugs.
In this work, we design and compare two distinct transition pathways of EGFR kinase domain to investigate under what condition DFG-flip can happen. One is the conformational change between A and I via T, which will be called ATI pathway in the following. The other one is direct transition between A and I without any intermediate, which will be called AI pathway. First, the two pathways are reconstructed using the strategy mentioned above. Then, in comparison with crystal structures, several intermediate states are recognized based on clustering results. Finally, rough two-dimensional (2D) free energy surfaces are plotted to illustrate transitions between different conformations. Comparison of two predefined pathways yields new insights into the conformational transition of EGFR kinase domain. Moreover, our results verify that this approach is valid and efficient in sampling of large-scale conformational changes and determination of the energy-favorable pathway from available ones.
2. Methods
2.1. Preparation of EGFR Sructures
Three EGFR structures were taken from the Protein Data Bank (PDB). The DFG-in active conformation was obtained from PDB entry 2ITW.45 The Src-like inactive conformation was obtained from PDB entry 3W32.46 The DFG-out inactive conformation was obtained from PDB entry 4I20.47 Two mutations in the structure of 4I20 (L858R and V948R) were changed back to the wild type within Maestro v9.3. Other atoms except the protein were removed. Some residues at the terminus were deleted so that the three structures had the same 284 residues.
2.2. TMD and MTMD
The targeted molecular dynamics (TMD) and multiply targeted molecular dynamics (MTMD) implemented in the Amber 11 program suite48 were employed to construct the transition pathways between EGFR active and inactive states.
TMD adds an additional term to the energy function. It has the following form:
TGTMDFRC is the force constant for targeted MD. NATTGTRMS is the number of atoms specified for root mean square deviation (RMSD) calculation. RMSD is the current RSMD for the selected atoms. TGTRMSD is the value of the target RMSD. In contrast, the force constant in MTMD is changing with step number by a single factor R:
INCREMENTS is the number of times the target value changes.
The protein was modeled using Amber ff03 force field.49 All three structures were subjected to energy minimization first using the steepest descent algorithm in 1000 steps and then the conjugate gradient algorithm in 10000 steps. For TMD simulations, the starting structure is 2ITW (A) and the target structure is 3W32 (T). Three TMD simulations ran for 0.5 ns with different force constants (1, 0.1, and 0.01 kcal/(mol·Å2)). For MTMD, each simulation ran for 1 ns. For the I-T-A transition, form I (4I20) was used as the starting structure; form T (3W32) was first set as the target structure. The force constant was applied to all heavy atoms and varied from 0.0001 to 2.0 kcal/(mol·Å2) in 0.5 ns as the simulation steps increased to drive the conformational changes to form T. Then, form A (2ITW) was set as the target structure. The force constant was reset to 0.0001 kcal/(mol·Å2) and increased to 2.0 kcal/(mol·Å2) in continuous 0.5 ns to drive the further transition to form A (2ITW). The same setting was also applied in the simulations of A-T-I and I-A-I. The TMD and MTMD simulations were performed in the implicit solvent model of generalized Born50 using the SANDER module. Snapshot structures were extracted from produced trajectories at a time interval of 1 ps.
2.3. K-Means Clustering
To generate an ensemble of representative structures from each MTMD trajectory, clustering was performed on backbone RMSDs of protein and the activation loop. Form A (2ITW) was used as the reference structure. Snapshot structures from each MTMD trajectory were superposed onto the reference structure using backbone atoms to remove overall rotation and translation. Then RMSD values were calculated with respect to the reference structure as the distance metrics. Three MTMD trajectories were divided into six transition trajectories each lasting for 0.5 ns. For each transition, 500 snapshot structures were extracted and classified with the K-means method implemented in the statistical software R v3.0. For ATI pathway, four transition trajectories were included and each of them was clustered into 11 classes. For AI pathway, two transition trajectories were included and each of them was clustered into 9 classes. From each class, the structure closest to the centroid was chosen as the representative structure for following MD simulations.
2.4. Molecular Dynamics
All MD simulations were carried out with Amber 11.48 The equations of motion were solved with the leapfrog integration algorithm with a time step of 2 fs. The lengths of all bonds involving hydrogen atoms were kept constrained with the SHAKE algorithm.51 The particle mesh Ewald (PME) method was applied for treating long-range electrostatic interactions.52 Periodic boundary condition was used in all simulations. A random seed was generated based on the current date and time for every run to assign initial velocities.
The protein was modeled using the Amber ff03 force field.49 For each seeding structure, it was explicitly solvated in a rectangular box of TIP3P53 water molecules with a minimal distance of 10 Å from the protein to the box edges. Two chloride ions were added to neutralize uncompensated charges. After the whole system was set up, a series of energy minimizations and equilibrations were performed. First, the water molecules, hydrogen atoms, and ions were subjected to 3000 steps of steepest descent minimization followed by 12000 steps of conjugate gradient minimization while other heavy atoms were constrained with the harmonic force of 2 kcal·mol–1·Å–2. Next, the whole system was energy minimized with 10000 steps of L-BFGS algorithm without any harmonic restraint. Then, coupled to a Langevin thermostat, the system was heated from 10 K up to 300 K by increments of 100 K in 20 ps and continued to run for 40 ps at 300 K at constant volume. Finally, the system was equilibrated for 200 ps in NPT ensemble with the Langevin thermostat and isotropic position scaling, at 300 K and 1 bar. The production run for each seeding structure was carried out for 200 ns in NVT ensemble with the Langevin thermostat at 300 K using the parallel CUDA version of PMEMD on 2 GPUs.54,55 The trajectories were sampled at a time interval of 10 ps. Distribution of simulation temperatures is shown in the Supporting Information. All simulations were performed on our Linux cluster with 2 GPUs and 12 CPUs on each node. The analysis of trajectories was performed using PTRAJ.56
2.5. Clustering Based on Bayesian Model
Bayesian clustering is an unsupervised method that seeks a maximum posterior probability classification by an expectation-maximization (EM) algorithm. The advantage is that there is no need to specify the cutoff radius or the number of clusters in advance. The optimal solution is determined by calculating the maximum posterior parameter values and the most probable classification.57 It has been compared with other clustering algorithms.58 In the present work Bayesian clustering was performed with AutoClass C v3.3.659 in the dihedral angle space. The structure of the EGFR kinase domain was described by 282 pairs of backbone dihedral angles. The structures for Bayesian clustering were sampled from unbiased MD trajectories. For ATI pathway, snapshot structures were extracted at a time interval of 0.4 ns from each trajectory and a total of 23500 structures was obtained. For AI pathway, snapshot structures were taken at an interval of 0.2 ns from each trajectory and a total of 20000 structures was obtained. The clustering process started with a serial of seed numbers which gave an initial guess of the number of clusters. Then a random classification was generated and refined until a local maximum was found. This process was repeated 1000 times, and the top two classifications with the highest probability were output. The 2D free energy surfaces based on these sampled structures were plotted (Supporting Information).
2.6. Free Energy Surface
The calculation of free energy is given by
where W0 is the depth of the free energy surfaces (FES), P is the probability distribution, kB is the Boltzmann constant, and T is the temperature. All sampled structures from unbiased MD simulations are employed for 2D FES calculations and 1D convergence analysis. For 2D FESs, the 2D distribution function P(r) is computed by the histogram analysis method HIST2D implemented in the package of GPLOTS with a bin area of 0.3 Å × 0.3 Å. One-dimensional free energy surfaces are presented in the Supporting Information, which are calculated over the three metrics (A-loop RMSD, DFG RMSD, and ion-pair distance) at an interval of 40 ns of simulation time. The 1D distribution function is calculated by the histogram analysis method implemented in R v3.0 with a bin width of 0.1 Å.
3. Results
3.1. Generation of Seeding Structures
Compared to other approaches,60 TMD is a valid tool for construction of a transition pathway, which does not require the specification of collective variables. In the standard TMD method there are two inefficient features. One is that a weak constraint may hold back the trajectory from reaching the target. The other one is the so-called “large-scale-first”,61 which means that large-scale motions occur before small-scale ones. Thus, the order of events in conformational transition is associated with the direction in which the simulation is performed.
To avoid these questions, we employ MTMD, a TMD variant, to generate the transition pathway for sampling of seeding structures. Compared with TMD, MTMD allows not only multiple reference structures being used but also a constraint evolving in time. The MTMD simulations were performed with the force constant varying from very weak (0.0001 kcal/(mol·Å2)) to weak (2.0 kcal/(mol·Å2)) to guarantee that the final structure would be within heavy-atom RMSD 1.0 Å of the target structure and large-scale motions would not happen at the beginning. We also ran MTMD simulations in both activation and inactivation directions to neutralize the possible bias in one-direction simulations. Three MTMD trajectories are presented in Figure 1. Two of them are for ATI pathway: one is from state I to A via T and the other one is from A to I via T. The third trajectory is for AI pathway: from state I to A and then back to I. In the MTMD simulations the starting structure is gradually changed into the target structure. And DFG-flip occurs after 0.4 ns in each transition (SI Figure S2). In contrast, three TMD trajectories with different constraints are also shown in Figure 1. In TMD simulations major conformational changes are done in a short time. This simple comparison indicates that MTMD produces a trajectory of conformational changes more smooth and consecutive than TMD does. Detailed comparison of MTMD and TMD is beyond the scope of this work and will be left for future studies.
Figure 1.
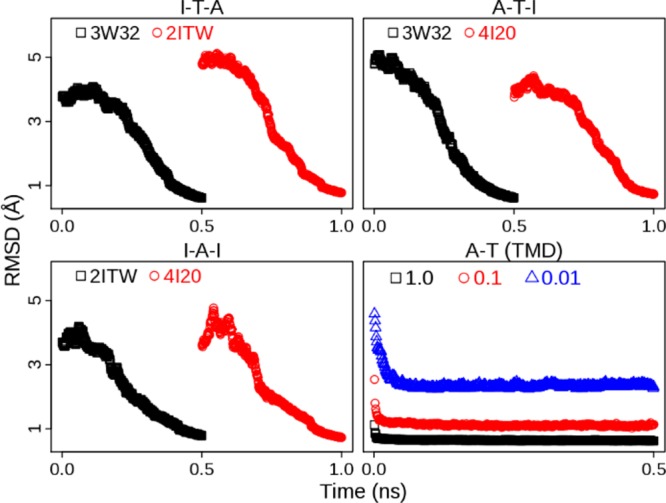
Time evolution of heavy-atom RMSD in MTMD and TMD simulations. Three MTMD simulations are the conformational transition from state I to A via T (I-T-A), the transition from state A to I via T (A-T-I), and the transition between states I and A (I-A-I), respectively. Conformational transition from state A to T is also simulated by TMD with different force constants (1.0, 0.1, and 0.01 kcal/(mol·Å2)). Three crystal structures, 2ITW, 3W32, and 4I20 are the DFG-in active form (A), Src-like inactive form (T), and DFG-out inactive form (I), respectively. The RMSD values are calculated with respect to the target structure (2ITW, 3W32, or 4I20).
The sampled structures from MTMD simulations were clustered using K-means method based on backbone RMSDs of both EGFR kinase domain and A-loop, considering that A-loop displays the highest flexibility in crystal structures. The structure closest to the centroid in one cluster was selected as the representative structure. For ATI pathway, 44 snapshot structures were chosen and 47 seeding structures (plus 3 crystal structures) were prepared for MD simulations. For AI pathway, 18 snapshot structures were selected and 20 seeding structures (plus 2 crystal structures) were prepared for MD simulations.
3.2. MD Simulations
The structural fluctuation from the ensemble of MD trajectories in two distinct pathways is characterized by four metrics: backbone RMSD of EGFR kinase domain (backbone RMSD), backbone RMSD of the A-loop (residues 854–878, A-loop RMSD), heavy-atom RMSD of the DFG motif (residues 855–857, DFG RMSD), and distance between the center of mass of Lys745 and Glu762 (the ion-pair distance). Backbone RMSD describes the overall conformational changes of the EGFR kinase domain; A-loop RMSD evaluates the movement of the A-loop between the extended state and the compact mode; DFG RMSD indicates the conformation of the DFG motif (DFG-in or DFG-out); the ion-pair distance (Lys745-Glu762) reflects displacement of αC helix. As a reference, the ion-pair distance and RMSD values of three crystal structures with respect to the crystal structure of 2ITW (form A) are listed in Table 1. Distribution of the measurements sampled from MD trajectories is displayed in Figure 2, in which the four metrics have different features of distribution in two pathways, suggesting that sampling is affected by predefined pathways. As expected, the A-loop RMSD varies more widely in ATI pathway than in AI pathway, though the overall structure (backbone RMSD) does not change much in both pathways. The DFG RMSD and ion-pair distance fluctuate in the same range with distinct characterization of distribution in two pathways, suggesting the influence of designed pathways on their movements.
Table 1. Comparison of Three EGFR Crystal Structuresa.
| RMSD (Å) |
||||
|---|---|---|---|---|
| crystal structure | backbone | A-loop | DFG | distance of ion pair (Å) |
| 2ITW (A) | 0 | 0 | 0 | 8.7 |
| 3W32 (T) | 4.4 | 10.5 | 3.7 | 14.4 |
| 4I20 (I) | 3.3 | 2.9 | 6.7 | 12.4 |
The crystal structure of 2ITW (A) is used as the reference structure for RMSD calculations.
Figure 2.
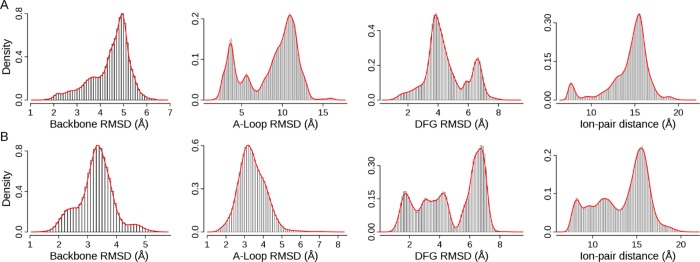
Distribution of RMSDs and ion-pair distance: (A) Data from 47 MD trajectories in ATI pathway; (B) data from 20 MD trajectories in AI pathway. The DFG-in active conformation (2ITW) is used as the reference structure. A snapshot structure is first superposed onto the reference structure using backbone atoms. Then RMSD values of backbone, A-loop, and DFG are calculated. The density is computed by the histogram analysis implemented in R v3.0 with a bin width of 0.1 Å.
3.3. Identification of Intermediate States
Bayes theorem was already used in biophysics studies.62−64 Clustering based on the Bayesian model was previously employed for analysis of MD trajectories.65 An analysis of clustering simulation data indicated that the clustering results to some extent depended on the number of available sampled structures.66 Considering their results and computation time, we extracted 23500 structures for ATI pathway (500 structures from each MD trajectory) and 20000 structures for AI pathway (1000 structures from each MD trajectory) for Bayesian clustering. The clustering was performed in the dihedral angle space. The EGFR structure was described by 282 pairs of backbone dihedral angles. For ATI pathway, 23500 structures were grouped into 94 classes (class 0–93) in the optimal classification. For AI pathway, 85 classes (class 0–84) were obtained in the optimal resolution.
The four metrics aforementioned are employed for comparison of sampled structures to the crystal structures (for the full data of the top 20 populated classes, see SI Tables S1 and S2). By them, we not only quantify the overall agreement of structures in classes with crystal structures but also identify intermediate structures classified by Bayesian clustering, which has not been reported yet. For ATI pathway, structures in classes 0, 2, and 11 have very good agreement with all structural properties of forms T, I, and A, respectively, with average RMSD values below 3.0 Å and similar ion-pair distances (for selected data, see Table 2; for full data, see SI Table S1). Except the known structures, conformations in some other classes are unique in that they do not correspond to any crystal structure. For example, structures in class 7 exhibit backbone and A-loop RMSDs as well as an ion-pair distance close to form T, but adopt the DFG-out conformation. Similar properties are also found in classes 9 and 16. For AI pathway (for selected data, see Table 2; for full data, see SI Table S2), structures in class 0 have good agreement with the structural properties of form I. Structures in class 3 exhibit properties similar to form A, typically with a good agreement to the DFG-in conformation, backbone RMSD, and ion-pair distance as well as a better correspondence to the A-loop RMSD. Similarly, some conformations distinguished from the crystal structures are available. Structures in class 1 have similar backbone RMSD and A-loop RMSD to form I while DFG RMSD and the distance of the ion pair are close to form T. Structures in class 9 adopt the DFG-out conformation, and RMSDs of the backbone and A-loop are closer to form I than to form A while the ion pair is likely to be in contact, which makes them look like the Imatinib-induced Abl structure.67 Although this structure has been solved for some kinases, it has not been observed in EGFR structures experimentally determined. The representative structures selected from mentioned classes are shown in SI Figure S3.
Table 2. Structural Properties of Representative Classes from Bayesian Clustering and Their Comparisons to the Reference Crystal Structure.
| av RMSD (Å) |
||||||
|---|---|---|---|---|---|---|
| class no. | ref structure | backbone | A-loop | DFG | av distance of ion pair (Å) | |
| ATI pathway | 0 | 3W32 (T) | 2.1 | 2.7 | 1.6 | 15.5 |
| 2 | 4I20 (I) | 2.6 | 2.1 | 1.5 | 15.0 | |
| 7 | 2ITW (A) | 5.4 | 11.2 | 6.6 | 12.9 | |
| 11 | 2ITW (A) | 2.4 | 2.8 | 1.9 | 8.5 | |
| 14 | 2ITW (A) | 4.4 | 4.0 | 3.9 | 13.6 | |
| 31 | 2ITW (A) | 4.2 | 5.6 | 6.0 | 13.9 | |
| AI pathway | 0 | 4I20 (I) | 2.6 | 2.2 | 1.5 | 16.0 |
| 1 | 2ITW (A) | 3.4 | 3.2 | 4.4 | 15.9 | |
| 3 | 2ITW (A) | 2.3 | 3.3 | 1.8 | 8.4 | |
| 7 | 2ITW (A) | 3.9 | 3.9 | 6.9 | 11.9 | |
| 9 | 2ITW (A) | 4.0 | 4.1 | 6.2 | 9.7 | |
Further examination of fluctuation of the structural properties shows that EGFR undergoes conformational transitions in some classes, though it is pretty stable in most of the classes (for the top 20 populated classes, see SI Figure S4). For example, in class 1 of ATI pathway the conformational change between DFG-out and DFG-in is clearly observable (Figure 3A). It is coupled with movement of the A-loop and alteration of the ion-pair distance. Similarly, structures in class 13 of AI pathway also exhibit conformational change of the DFG motif while the A-loop does not move far away from the extended state (Figure 3B). These kinds of changes in adopted structural properties occur more frequently in less-populated classes than in populated ones, suggesting transitions between intermediate states.
Figure 3.
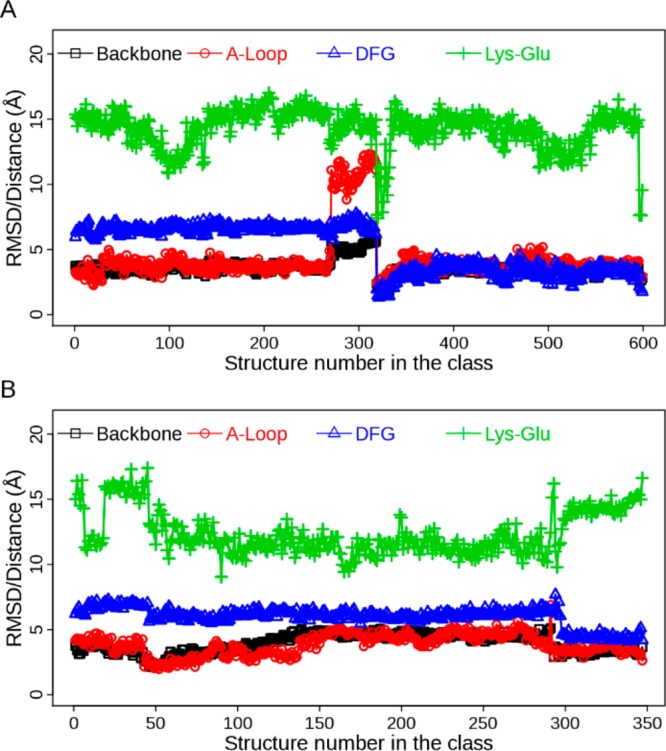
Evolution of structural properties in the class from Bayesian clustering: (A) Class 1 in ATI pathway; (B) class 13 in AI pathway. Four metrics are displayed: backbone RMSD, A-loop RMSD, DFG RMSD, and distance of the ion pair (Lys-Glu). The RMSD values are calculated with respect to the crystal structure of 2ITW (form A).
3.4. Two-Dimensional Free Energy Surfaces
To visualize the transition pathways and intermediate states, we tried to project the dihedral angles space into a two-dimensional FES. The principle component analysis was carried out, but the first two eigenvalues could only account for 13% of the variability of the data, which made them not a good choice. Then we turned to the metrics mentioned previously. Three metrics (DFG RMSD, A-loop RMSD, and distance of the ion pair) were employed for plotting of rough 2D FESs to investigate the relationship between DFG-flip and movement of the A-loop as well as displacement of the αC helix (Figure 4).
Figure 4.

2D free energy surfaces for activation/inactivation of EGFR kinase domain. FESs for ATI pathway are shown in A and B; FESs for AI pathway are shown in C and D. Three metrics are employed for FES plotting: DFG RMSD, A-loop RMSD, and distance of the ion pair. The RMSD values are calculated with the crystal structure of 2ITW (form A) as the reference. Energy basins corresponding to forms A, T, and I are denoted. Intermediate states are labeled with prefix IS.
Energy wells on FESs are compared to the classes from Bayesian clustering. For ATI pathway, three populated ensembles labeled as T, I, and A (Figure 4A,B) correspond to classes 0, 2, and 11 (Table 2 and SI Figure S3), displaying similar features with the crystal structures. IS1, IS2, and IS3 (Figure 4A) denote three intermediate states, corresponding to classes 7, 31, and 14 (Table 2), respectively. States A, T, and IS3 adopt the DFG-in conformation while I, IS1, and IS2 adopt the DFG-out conformation. For AI pathway, energy basins labeled as I and A (Figure 4C,D) correspond to classes 0 and 3, having properties similar to those of the crystal structures. IS4, IS5, and IS6 denote three different forms (Figure 4D), corresponding to classes 1, 9, and 7, respectively (Table 2). States I, IS5, and IS6 adopt the DFG-out conformation while A and IS4 adopt the DFG-in conformation.
From FESs, the transition between EGFR active and inactive forms is apparently visible. In ATI pathway, DFG-flip occurs with little energy cost (Figure 4A,B). In contrast, DFG-flip happens less frequently in AI pathway, which is clearer in Figure 4D than in Figure 4C. Our results suggest that ATI pathway is more energetically favorable than AI pathway, though DFG-flip can happen in both pathways. Previous studies suggest that displacement of the αC helix38,44 or A-loop movement41 is the major energy barrier mediating the transition. Here, we further examine the role of A-loop and αC helix in DFG-flip. In both B and D of Figure 4, DFG-flip occurs when the ion pair is broken apart. When the ion pair is in contact, no transition of the DFG motif is observed, possibly because of sterical hindrance. This suggests that DFG-flip is coupled with disruption of the ion pair. On the other hand, in Figure 4C the A-loop fluctuates around the extended state, while, in Figure 4A, the A-loop floats away from the extended state and reaches the compact mode. DFG-flip happens more frequently in Figure 4A than in Figure 4C, suggesting that the transition is strongly influenced by movement of the A-loop. Thus, our results yield a view that breaking the ion pair is critically important for DFG-flip and movement of A-loop significantly facilitates the conformational change. This may explain why ATI pathway is more energetically preferred than AI pathway.
Interestingly, except the predefined pathway (A-T-I), another transition pathway appears between form A and I (A-IS3-IS2-I in Figure 4A). In this pathway, the A-loop just moves slightly away from the extended state. We deduce that disruption of the ion pair plus a small movement of A-loop provides enough space for DFG-flip. If this is the case, considering that the A-loop displays high flexibility in kinase crystal structures and distinct A-loop conformations of EGFR have been recognized,42 it is very likely that there exist multiple transition pathways between the active and inactive forms as well as various intermediate states.
In addition, we notice that state IS5 appears in AI pathway (Figure 4D) but is not sampled in ATI pathway (Figure 4B). Examination of clustering results also shows that none of the classes in ATI pathway has structural properties similar to those of IS5. This may suggest that some conformation is not preferred for unbound EGFR. In ATI pathway, the inactive forms (T and I) and the conversion between them are energetically favorable (Figure 4B), and sampling is trapped in the energy wells. This agrees with a previous report that the isolated EGFR kinase domain in monomeric form has low catalytic activity.68 In AI pathway, however, transition of the DFG motif is impeded because of constraint of the A-loop (Figure 4D), which may make state IS5 energetically favorable. Our results are consistent with the observation that the Imatinib-induced Abl structure (corresponding to IS5 in Figure 4D and class 9 in SI Figure S3B) is rarely found in unbound kinases but appears in kinase–ligand complexes. Possibly because this form is not energetically preferred and becomes stable under certain conditions such as ligand binding or constraint of the A-loop.
Previously, conformational transitions of Src and Abl have been investigated with biased MD simulations and the free energy may be overestimated.40 Compared to their data, the free energy calculated in this work may be underestimated. Interestingly, our results are close to the free energy computed for conformational changes of wide type and mutant EGFRs recently reported.43 The difference in estimated free energy may result from distinct kinases, simulation methods or choice of order parameters. To improve performance of our approach, more seeding structures may be needed. But it is still a challenge to select appropriate order parameters.
3.5. Cracking of αC Helix
Studies have demonstrated that local protein unfolding (cracking) is common in conformational changes, and αC helix is disordered in EGFR conformations.69−72 Based on previous reports, displacement of αC helix may be caused by outward rotation or local unfolding. Outward rotation of αC helix among kinase crystal structures has been discussed in detail.35,44 Here we further examine variability of secondary structure of αC helix by calculating the time when residues of αC helix are in the helix status (SI Figure S5). In all MD trajectories three residues (residue nos. 764–766) are highly stable and keep in the helix status. In contrast, other residues to varying extent undergo the order–disorder transitions. As indicated in the previous section, disruption of the ion pair induced by displacement of the αC helix is necessary for DFG-flip. Our results suggest that partial unfolding of he αC helix may accompany the transition between EGFR active and inactive forms and facilitate DFG-flip.
4. Conclusion
We present a strategy combining MD simulations and Bayesian clustering to investigate conformational transitions between EGFR active and inactive forms. Compared to previous reports, our results verify that this approach is valid and efficient in sampling rare events. Moreover, with this approach, distinct transition pathways can be compared and the energy-favorable one can be distinguished. It is usually difficult to observe the conformational changes using constant-temperature simulations even on microsecond time scales. Running multiple MD simulations initiated on different conformational states may effectively cross the energy barrier and overcome the conformational sampling problem. With the help of a high parallel computing platform, this strategy is easily implemented. Bayesian clustering is then employed to recognize intermediate states and transitions along the pathway from the ensemble of MD trajectories. Although it is still a challenge to project the transition pathway from a high-dimensional space to a two-dimensional space, selection of appropriate order parameters is helpful for investigating the effect of local fluctuations on global conformational changes.
Since the catalytic domain is highly conserved in all kinases and the three forms of EGFR (A, T, and I) have also been found in other distantly related kinases, the conformational changes between them may be a general mechanism of kinases activation and inactivation.35 On the other hand, it is believed that each inactive conformation of kinase has some special features which distinguish it from other states. And kinase inactive forms have been the targets for development of high specific anticancer drugs in the pharmaceutical industry. Therefore, determination of unreported inactive conformations and transitions between them provides new targets for cancer treatment.
Supporting Information Available
Figures showing conformations of the EGFR kinase domain, time evolution of DFG RMSD in MTMD simulations, results from Bayesian clustering, additional information about MD simulations, convergence of free energy calculations, and the influence of the number of seeding structures on 2D free energy surfaces and tables listing comparisons of average RMSD values with EGFR crystal structures. This material is available free of charge via the Internet at http://pubs.acs.org.
Author Contributions
§ Y.L. and X.L. contributed equally to this work.
This work was supported by The Hormel Foundation and National Institutes of Health Grants CA172457, CA166011, and R37 CA081064.
The authors declare no competing financial interests.
Funding Statement
National Institutes of Health, United States
Supplementary Material
References
- Smock R. G.; Gierasch L. M. Sending Signals Dynamically. Science 2009, 324, 198–203. [DOI] [PMC free article] [PubMed] [Google Scholar]
- Grant B. J.; Gorfe A. A.; McCammon J. A. Large conformational changes in proteins: signaling and other functions. Curr. Opin. Struct. Biol. 2010, 20, 142–147. [DOI] [PMC free article] [PubMed] [Google Scholar]
- Shaw D. E.; Maragakis P.; Lindorff-Larsen K.; Piana S.; Dror R. O.; Eastwood M. P.; Bank J. A.; Jumper J. M.; Salmon J. K.; Shan Y.; Wriggers W. Atomic-Level Characterization of the Structural Dynamics of Proteins. Science 2010, 330, 341–346. [DOI] [PubMed] [Google Scholar]
- Sugita Y.; Okamoto Y. Replica-exchange molecular dynamics method for protein folding. Chem. Phys. Lett. 1999, 314, 141–151. [Google Scholar]
- Earl D. J.; Deem M. W. Parallel tempering: Theory, applications, and new perspectives. Phys. Chem. Chem. Phys. 2005, 7, 3910–3916. [DOI] [PubMed] [Google Scholar]
- Kastner J. Umbrella sampling. Wiley Interdiscip. Rev.: Comput. Mol. Sci. 2011, 1, 932–942. [Google Scholar]
- Laio A.; Parrinello M. Escaping free-energy minima. Proc. Natl. Acad. Sci. U. S. A. 2002, 99, 12562–12566. [DOI] [PMC free article] [PubMed] [Google Scholar]
- Tribello G. A.; Ceriotti M.; Parrinello M. A self-learning algorithm for biased molecular dynamics. Proc. Natl. Acad. Sci. U. S. A. 2010, 107, 17509–17514. [DOI] [PMC free article] [PubMed] [Google Scholar]
- Hamelberg D.; Mongan J.; McCammon J. A. Accelerated molecular dynamics: A promising and efficient simulation method for biomolecules. J. Chem. Phys. 2004, 120, 11919–11929. [DOI] [PubMed] [Google Scholar]
- Pierce L. C. T.; Salomon-Ferrer R.; de Oliveira C. A. F.; McCammon J. A.; Walker R. C. Routine Access to Millisecond Time Scale Events with Accelerated Molecular Dynamics. J. Chem. Theory Comput. 2012, 8, 2997–3002. [DOI] [PMC free article] [PubMed] [Google Scholar]
- Abrams C. F.; Vanden-Eijnden E. Large-scale conformational sampling of proteins using temperature-accelerated molecular dynamics. Proc. Natl. Acad. Sci. U. S. A. 2010, 107, 4961–4966. [DOI] [PMC free article] [PubMed] [Google Scholar]
- Henin J.; Fiorin G.; Chipot C.; Klein M. L. Exploring Multidimensional Free Energy Landscapes Using Time-Dependent Biases on Collective Variables. J. Chem. Theory Comput. 2010, 6, 35–47. [DOI] [PubMed] [Google Scholar]
- Zuckerman D. M.; Lyman E. A second look at canonical sampling of biomolecules using replica exchange simulation. J. Chem. Theory Comput. 2006, 2, 1200–1202. [DOI] [PubMed] [Google Scholar]
- Zheng W. H.; Andrec M.; Gallicchio E.; Levy R. M. Simulating replica exchange simulations of protein folding with a kinetic network model. Proc. Natl. Acad. Sci. U. S. A. 2007, 104, 15340–15345. [DOI] [PMC free article] [PubMed] [Google Scholar]
- Huang X. H.; Bowman G. R.; Pande V. S. Convergence of folding free energy landscapes via application of enhanced sampling methods in a distributed computing environment. J. Chem. Phys. 2008, 128, 205106. [DOI] [PMC free article] [PubMed] [Google Scholar]
- Nymeyer H. How efficient is replica exchange molecular dynamics? An analytic approach. J. Chem. Theory Comput. 2008, 4, 626–636. [DOI] [PubMed] [Google Scholar]
- Rosta E.; Hummer G. Error and efficiency of replica exchange molecular dynamics simulations. J. Chem. Phys. 2009, 131, 165102. [DOI] [PMC free article] [PubMed] [Google Scholar]
- Tribello G. A.; Ceriotti M.; Parrinello M. Using sketch-map coordinates to analyze and bias molecular dynamics simulations. Proc. Natl. Acad. Sci. U. S. A. 2012, 109, 5196–5201. [DOI] [PMC free article] [PubMed] [Google Scholar]
- Faradjian A. K.; Elber R. Computing time scales from reaction coordinates by milestoning. J. Chem. Phys. 2004, 120, 10880–10889. [DOI] [PubMed] [Google Scholar]
- Ovchinnikov V.; Karplus M.; Vanden-Eijnden E. Free energy of conformational transition paths in biomolecules: The string method and its application to myosin VI. J. Chem. Phys. 2011, 134, 085103. [DOI] [PMC free article] [PubMed] [Google Scholar]
- Branduardi D.; Gervasio F. L.; Parrinello M. From A to B in free energy space. J. Chem. Phys. 2007, 126, 054103. [DOI] [PubMed] [Google Scholar]
- Dellago C.; Bolhuis P. G.; Csajka F. S.; Chandler D. Transition path sampling and the calculation of rate constants. J. Chem. Phys. 1998, 108, 1964–1977. [Google Scholar]
- Juraszek J.; Vreede J.; Bolhuis P. G. Transition path sampling of protein conformational changes. Chem. Phys. 2012, 396, 30–44. [Google Scholar]
- Zhang B. W.; Jasnow D.; Zuckerman D. M. Efficient and verified simulation of a path ensemble for conformational change in a united-residue model of calmodulin. Proc. Natl. Acad. Sci. U. S. A. 2007, 104, 18043–18048. [DOI] [PMC free article] [PubMed] [Google Scholar]
- Bhatt D.; Zuckerman D. M. Heterogeneous Path Ensembles for Conformational Transitions in Semiatomistic Models of Adenylate Kinase. J. Chem. Theory Comput. 2010, 6, 3527–3539. [DOI] [PMC free article] [PubMed] [Google Scholar]
- Burger S. K.; Ayers P. W. Dual Grid Methods for Finding the Reaction Path on Reduced Potential Energy Surfaces. J. Chem. Theory Comput. 2010, 6, 1490–1497. [DOI] [PubMed] [Google Scholar]
- Arora K.; Brooks C. L. Large-scale allosteric conformational transitions of adenylate kinase appear to involve a population-shift mechanism. Proc. Natl. Acad. Sci. U. S. A. 2007, 104, 18496–18501. [DOI] [PMC free article] [PubMed] [Google Scholar]
- Galvan I. F.; Field M. J. Improving the efficiency of the NEB reaction path finding algorithm. J. Comput. Chem. 2008, 29, 139–143. [DOI] [PubMed] [Google Scholar]
- Schlitter J.; Engels M.; Kruger P.; Jacoby E.; Wollmer A. Targeted Molecular Dynamics Simulation of Conformational Change-Application to the T ↔ R Transition in Insulin. Mol. Simul. 1993, 10, 291–308. [Google Scholar]
- Grubmuller H.; Heymann B.; Tavan P. Ligand binding: Molecular mechanics calculation of the streptavidin biotin rupture force. Science 1996, 271, 997–999. [DOI] [PubMed] [Google Scholar]
- Isralewitz B.; Gao M.; Schulten K. Steered molecular dynamics and mechanical functions of proteins. Curr. Opin. Struct. Biol. 2001, 11, 224–230. [DOI] [PubMed] [Google Scholar]
- Huang X.; Bowman G. R.; Bacallado S.; Pande V. S. Rapid equilibrium sampling initiated from nonequilibrium data. Proc. Natl. Acad. Sci. U. S. A. 2009, 106, 19765–19769. [DOI] [PMC free article] [PubMed] [Google Scholar]
- Yang S.; Banavali N. K.; Roux B. Mapping the conformational transition in Src activation by cumulating the information from multiple molecular dynamics trajectories. Proc. Natl. Acad. Sci. U. S. A. 2009, 106, 3776–3781. [DOI] [PMC free article] [PubMed] [Google Scholar]
- Hynes N. E.; MacDonald G. ErbB receptors and signaling pathways in cancer. Curr. Opin. Cell Biol. 2009, 21, 177–184. [DOI] [PubMed] [Google Scholar]
- Jura N.; Zhang X. W.; Endres N. F.; Seeliger M. A.; Schindler T.; Kuriyan J. Catalytic Control in the EGF Receptor and Its Connection to General Kinase Regulatory Mechanisms. Mol. Cell 2011, 42, 9–22. [DOI] [PMC free article] [PubMed] [Google Scholar]
- Berteotti A.; Cavalli A.; Branduardi D.; Gervasio F. L.; Recanatini M.; Parrinello M. Protein Conformational Transitions: The Closure Mechanism of a Kinase Explored by Atomistic Simulations. J. Am. Chem. Soc. 2009, 131, 244–250. [DOI] [PubMed] [Google Scholar]
- Shan Y. B.; Seeliger M. A.; Eastwood M. P.; Frank F.; Xu H. F.; Jensen M. O.; Dror R. O.; Kuriyan J.; Shaw D. E. A conserved protonation-dependent switch controls drug binding in the Abl kinase. Proc. Natl. Acad. Sci. U. S. A. 2009, 106, 139–144. [DOI] [PMC free article] [PubMed] [Google Scholar]
- Huang H.; Zhao R. J.; Dickson B. M.; Skeel R. D.; Post C. B. αC Helix as a Switch in the Conformational Transition of Src/CDK-like Kinase Domains. J. Phys. Chem. B 2012, 116, 4465–4475. [DOI] [PMC free article] [PubMed] [Google Scholar]
- Johnson M. E.; Hummer G. Characterization of a Dynamic String Method for the Construction of Transition Pathways in Molecular Reactions. J. Phys. Chem. B 2012, 116, 8573–8583. [DOI] [PMC free article] [PubMed] [Google Scholar]
- Lovera S.; Sutto L.; Boubeva R.; Scapozza L.; Dolker N.; Gervasio F. L. The Different Flexibility of c-Src and c-Abl Kinases Regulates the Accessibility of a Druggable Inactive Conformation. J. Am. Chem. Soc. 2012, 134, 2496–2499. [DOI] [PubMed] [Google Scholar]
- Vashisth H.; Maragliano L.; Abrams C. F. ″DFG-Flip″ in the Insulin Receptor Kinase Is Facilitated by a Helical Intermediate State of the Activation Loop. Biophys. J. 2012, 102, 1979–1987. [DOI] [PMC free article] [PubMed] [Google Scholar]
- Shan Y. B.; Arkhipov A.; Kim E. T.; Pan A. C.; Shaw D. E. Transitions to catalytically inactive conformations in EGFR kinase. Proc. Natl. Acad. Sci. U. S. A. 2013, 110, 7270–7275. [DOI] [PMC free article] [PubMed] [Google Scholar]
- Sutto L.; Luigi Gervasio F. Effects of oncogenic mutations on the conformational free-energy landscape of EGFR kinase. Proc. Natl. Acad. Sci. U. S. A. 2013, 110, 10616–10621. [DOI] [PMC free article] [PubMed] [Google Scholar]
- Levinson N. M.; Kuchment O.; Shen K.; Young M. A.; Koldobskiy M.; Karplus M.; Cole P. A.; Kuriyan J. A Src-like inactive conformation in the Abl tyrosine kinase domain. PLoS Biol. 2006, 4, 753–767. [DOI] [PMC free article] [PubMed] [Google Scholar]
- Yun C. H.; Boggon T. J.; Li Y. Q.; Woo M. S.; Greulich H.; Meyerson M.; Eck M. J. Structures of lung cancer-derived EGFR mutants and inhibitor complexes: Mechanism of activation and insights into differential inhibitor sensitivity. Cancer Cell 2007, 11, 217–227. [DOI] [PMC free article] [PubMed] [Google Scholar]
- Kawakita Y.; Seto M.; Ohashi T.; Tamura T.; Yusa T.; Miki H.; Iwata H.; Kamiguchi H.; Tanaka T.; Sogabe S.; Ohta Y.; Ishikawa T. Design and synthesis of novel pyrimido 4,5-b azepine derivatives as HER2/EGFR dual inhibitors. Biorg. Med. Chem. 2013, 21, 2250–2261. [DOI] [PubMed] [Google Scholar]
- Gajiwala K. S.; Feng J. L.; Ferre R.; Ryan K.; Brodsky O.; Weinrich S.; Kath J. C.; Stewart A. Insights into the Aberrant Activity of Mutant EGFR Kinase Domain and Drug Recognition. Structure 2013, 21, 209–219. [DOI] [PubMed] [Google Scholar]
- Case D. A.; Cheatham T. E.; Darden T.; Gohlke H.; Luo R.; Merz K. M.; Onufriev A.; Simmerling C.; Wang B.; Woods R. J. The Amber biomolecular simulation programs. J. Comput. Chem. 2005, 26, 1668–1688. [DOI] [PMC free article] [PubMed] [Google Scholar]
- Duan Y.; Wu C.; Chowdhury S.; Lee M. C.; Xiong G. M.; Zhang W.; Yang R.; Cieplak P.; Luo R.; Lee T.; Caldwell J.; Wang J. M.; Kollman P. A point-charge force field for molecular mechanics simulations of proteins based on condensed-phase quantum mechanical calculations. J. Comput. Chem. 2003, 24, 1999–2012. [DOI] [PubMed] [Google Scholar]
- Onufriev A.; Bashford D.; Case D. A. Exploring protein native states and large-scale conformational changes with a modified generalized born model. Proteins: Struct., Funct., Bioinf. 2004, 55, 383–394. [DOI] [PubMed] [Google Scholar]
- Ryckaert J. P.; Ciccotti G.; Berendsen H. J. C. Numerical-integration of cartesian equations of motion of a system with constraints—Molecular-dynamics of n-alkanes. J. Comput. Phys. 1977, 23, 327–341. [Google Scholar]
- Essmann U.; Perera L.; Berkowitz M. L.; Darden T.; Lee H.; Pedersen L. G. A smooth particle mesh Ewald method. J. Chem. Phys. 1995, 103, 8577–8593. [Google Scholar]
- Jorgensen W. L.; Chandrasekhar J.; Madura J. D.; Impey R. W.; Klein M. L. Comparison of simple potential functions for simulating liquid water. J. Chem. Phys. 1983, 79, 926–935. [Google Scholar]
- Gotz A. W.; Williamson M. J.; Xu D.; Poole D.; Le Grand S.; Walker R. C. Routine Microsecond Molecular Dynamics Simulations with AMBER on GPUs. 1. Generalized Born. J. Chem. Theory Comput. 2012, 8, 1542–1555. [DOI] [PMC free article] [PubMed] [Google Scholar]
- Salomon-Ferrer R.; Götz A. W.; Poole D.; Le Grand S.; Walker R. C. Routine Microsecond Molecular Dynamics Simulations with AMBER on GPUs. 2. Explicit Solvent Particle Mesh Ewald. J. Chem. Theory Comput. 2013, 9, 3878–3888. [DOI] [PubMed] [Google Scholar]
- Roe D. R.; Cheatham T. E. PTRAJ and CPPTRAJ: Software for Processing and Analysis of Molecular Dynamics Trajectory Data. J. Chem. Theory Comput. 2013, 9, 3084–3095. [DOI] [PubMed] [Google Scholar]
- Cheeseman P.; Stutz J.. Bayesian classification (AutoClass): Theory and results. In Advances in knowledge discovery and data mining; Fayyad U. M., Piatetsky-Shapiro G., Smyth P., Uthurusamy R., Eds.; MIT Press: Cambridge, MA, USA, 1996; pp 153–180. [Google Scholar]
- Shao J. Y.; Tanner S. W.; Thompson N.; Cheatham T. E. Clustering molecular dynamics trajectories: 1. Characterizing the performance of different clustering algorithms. J. Chem. Theory Comput. 2007, 3, 2312–2334. [DOI] [PubMed] [Google Scholar]
- Cook D.; Potts J.; Taylor W. AutoClass C, version 3.3.6; http://ti.arc.nasa.gov/tech/rse/synthesis-projects-applications/autoclass/autoclass-c/ (accessed Apr. 15, 2014).
- Huang H.; Ozkirimli E.; Post C. B. Comparison of Three Perturbation Molecular Dynamics Methods for Modeling Conformational Transitions. J. Chem. Theory Comput. 2009, 5, 1304–1314. [DOI] [PMC free article] [PubMed] [Google Scholar]
- Ovchinnikov V.; Karplus M. Analysis and Elimination of a Bias in Targeted Molecular Dynamics Simulations of Conformational Transitions: Application to Calmodulin. J. Phys. Chem. B 2012, 116, 8584–8603. [DOI] [PMC free article] [PubMed] [Google Scholar]
- Krilov G.; Sim E.; Berne B. J. On the Bayesian approach to calculating time correlation functions in quantum systems; reaction dynamics and spectroscopy. Chem. Phys. 2001, 268, 21–34. [Google Scholar]
- Best R. B.; Hummer G. Reaction coordinates and rates from transition paths. Proc. Natl. Acad. Sci. U. S. A. 2005, 102, 6732–6737. [DOI] [PMC free article] [PubMed] [Google Scholar]
- Liu P.; Shi Q.; Daume H.; Voth G. A. A Bayesian statistics approach to multiscale coarse graining. J. Chem. Phys. 2008, 129, 214114. [DOI] [PubMed] [Google Scholar]
- Li Y. Bayesian model based clustering analysis: Application to a molecular dynamics trajectory of the HIV-1 integrase catalytic core. J. Chem. Inf. Model. 2006, 46, 1742–1750. [DOI] [PubMed] [Google Scholar]
- Keller B.; Daura X.; van Gunsteren W. F. Comparing geometric and kinetic cluster algorithms for molecular simulation data. J. Chem. Phys. 2010, 132, 074110. [DOI] [PubMed] [Google Scholar]
- Schindler T.; Bornmann W.; Pellicena P.; Miller W. T.; Clarkson B.; Kuriyan J. Structural mechanism for STI-571 inhibition of Abelson tyrosine kinase. Science 2000, 289, 1938–1942. [DOI] [PubMed] [Google Scholar]
- Zhang X. W.; Gureasko J.; Shen K.; Cole P. A.; Kuriyan J. An allosteric mechanism for activation of the kinase domain of epidermal growth factor receptor. Cell 2006, 125, 1137–1149. [DOI] [PubMed] [Google Scholar]
- Miyashita O.; Onuchic J. N.; Wolynes P. G. Nonlinear elasticity, proteinquakes, and the energy landscapes of functional transitions in proteins. Proc. Natl. Acad. Sci. U. S. A. 2003, 100, 12570–12575. [DOI] [PMC free article] [PubMed] [Google Scholar]
- Whitford P. C.; Miyashita O.; Levy Y.; Onuchic J. N. Conformational transitions of adenylate kinase: Switching by cracking. J. Mol. Biol. 2007, 366, 1661–1671. [DOI] [PMC free article] [PubMed] [Google Scholar]
- Hyeon C.; Jennings P. A.; Adams J. A.; Onuchic J. N. Ligand-induced global transitions in the catalytic domain of protein kinase A. Proc. Natl. Acad. Sci. U. S. A. 2009, 106, 3023–3028. [DOI] [PMC free article] [PubMed] [Google Scholar]
- Shan Y.; Eastwood M. P.; Zhang X.; Kim E. T.; Arkhipov A.; Dror R. O.; Jumper J.; Kuriyan J.; Shaw D. E. Oncogenic Mutations Counteract Intrinsic Disorder in the EGFR Kinase and Promote Receptor Dimerization. Cell 2012, 149, 860–870. [DOI] [PubMed] [Google Scholar]
Associated Data
This section collects any data citations, data availability statements, or supplementary materials included in this article.