

Abstract
Under the selective pressure of therapy, HIV-1 protease mutants resistant to inhibitors evolve to confer drug resistance. Such mutations can impact both the dynamics and structures of the bound and unbound forms of the enzyme. Flap+ is a multidrug-resistant variant of HIV-1 protease with a combination of primary and secondary resistance mutations (L10I, G48V, I54V, V82A) and a strikingly altered thermodynamic profile for darunavir (DRV) binding relative to the wild-type protease. We elucidated the impact of these mutations on protein dynamics in the DRV-bound state using molecular dynamics simulations and NMR relaxation experiments. Both methods concur in that the conformational ensemble and dynamics of protease are impacted by the drug resistance mutations in Flap+ variant. Surprisingly this change in ensemble dynamics is different from that observed in the unliganded form of the same variant (Cai, Y. et al. J. Chem. Theory Comput.2012, 8, 3452–3462). Our comparative analysis of both inhibitor-free and bound states presents a comprehensive picture of the altered dynamics in drug-resistant mutant HIV-1 protease and underlies the importance of incorporating dynamic analysis of the whole system, including the unliganded state, into revealing drug resistance mechanisms.
Introduction
Understanding the molecular mechanisms underlying drug resistance is a prerequisite for devising strategies to circumvent emergence of resistance in drug design. In HIV-1 protease, a critical drug target against HIV/AIDS, many mutations throughout the enzyme accumulate under the selective pressure of protease inhibitors (PIs) and contribute to resistance. Primary mutations at the active site can selectively weaken the physical interactions of the inhibitor with the enzyme while still allowing the recognition and processing of substrates. This major mechanism of drug resistance is effectively rationalized by the “substrate envelope” hypothesis.1 However, often the resistance mechanisms are more complicated. For example, co-occurring mutations can have interdependent effects,2 and additional secondary mutations away from the active site contribute to resistance.3 As secondary mutation sites are not in physical contact with the inhibitor, deciphering the underlying resistance mechanism is more challenging.
Alteration of protein internal dynamics may be an underlying mechanism of resistance for distal secondary mutations and interdependency of multiple mutations. Conformational dynamics is crucial for HIV-1 protease function. Ligand access to the protease active site is controlled by the highly flexible glycine-rich flaps of both monomers, which close as an antiparallel β-sheet upon the bound substrate or inhibitor. MD simulations suggested that the flap motions are coupled to the overall dynamics of the protein including the hydrophobic core, which was experimentally verified by carefully engineered mutations.4 Dynamics of HIV-1 protease and especially the flap region have been studied extensively by both experimental and computational methods.5
We have recently reported that, in unliganded protease, the flaps undergo complex motions over a wide range of time scales, as revealed by MD simulations and NMR relaxation experiments, and the dynamics are altered in a multidrug resistant HIV-1 protease variant.6 This variant Flap+ (L10I/G48V/I54V/V82A) was derived as a combination of mutations that simultaneously occur in patient sequences.7 Residues 48 and 54 are at the flaps, and residue 82 is at the active site. Interestingly, regardless of the PI bound, Flap+ protease displays extreme entropy–enthalpy compensation relative to wild-type (WT) protease.8 In the case of the most potent FDA-approved inhibitor DRV, this compensation is in the order of 10 kcal/mol, and in contrast to WT, binding is entropy-driven to Flap+ protease. Hence, drug resistance mutations profoundly modulate the thermodynamics of inhibitor binding in Flap+ protease. However, the molecular mechanisms that underlie these energetic changes and how protease dynamics in inhibitor-bound state may be altered has not been thoroughly investigated.
Here, we investigate how conformational dynamics are altered in Flap+ HIV-1 protease variant, which displays an unusual thermodynamic profile of inhibitor binding.8 We combined extensive MD simulations with NMR relaxation experiments for a comprehensive investigation of DRV-bound Flap+ protease and further analysis of the unliganded-state dynamics. As we previously saw in the unliganded state,6 the dynamic ensemble sampled by the protease is altered in inhibitor-bound Flap+ relative to WT protease. These changes in dynamic behavior in both unliganded and DRV-bound states may impact conformational entropy and solvation effects in DRV binding, including alterations in dehydration of solvent-exposed hydrophobic flap regions in Flap+ variant compared to WT protease. Our results highlight the importance of considering entropic contributions and conformational dynamics as an additional challenge in rational structure-based drug design.
Methods
MD Simulations
MD simulations were performed using the program Sander in the AMBER 8 (Assisted Model Building with Energy Refinement) package.9 The initial coordinates of the WT and Flap+ protease complexes with DRV were from crystal structures 1T3R and 1T7J, respectively.10 For the standard protease residues, atomic partial charges, van der Waals (vdW) parameters, equilibrium bond lengths, bond angles, dihedral angles, and their relative force constants were taken from the AMBER database (ff03).11 The first conformation of multiple occupancy side-chains was used in the simulations. Any missing side-chain atoms were built back into the structures using the Leap program and default geometry in AMBER. All ionizable residues were left in their standard states at pH 7 except for the Asp25. The explicit solvent model was applied to all systems. Each structure was solvated with the TIP3P water box to allow for at least 8 Å of solvent on each face of the protease. The vdW dimensions for the protease are 44 × 35 × 59 Å. The dimensions of the final periodic box are 63 × 55 × 78 Å. The simulation system had approximately 7000 water molecules, and five Cl– counterions were added to balance the charge of the system. The center-of-mass (COM) motion was removed at the default AMBER intervals (nscm 1000). A three-step energy minimization process with the steepest-descent method was used to allow the system to reach an energetically favorable conformation.
In the first energy minimization step, all the heavy atoms of the protease were restrained with a harmonic force constant of 10 kcal mol–1 Å–2. In the second step, only the backbone nitrogen, oxygen, and carbon atoms were restrained. In the third step, all atoms were allowed to move. Each of the three steps had 2000 cycles. The temperature of the energy-minimized system was then gradually raised from 50 to 300 K in the NVT ensemble. Initial velocities were assigned according to the Maxwellian distribution, and random seeds were assigned with 10 different values to generate 20 simulations, 10 parallel simulations for each of the WT–DRV and Flap+–DRV. In the thermalization process, heavy atoms were restrained with a harmonic force constant of 10 kcal mol–1 Å–2. The whole process was 50 ps (50,000 steps, each 1 fs). A 50 ps equilibration was then performed in the NPT ensemble without restraining heavy atoms. In the subsequent sampling MD simulations, each step was 2 fs, and the trajectory was recorded every 100 fs. For the thermalization, equilibration, and sampling simulations, the SHAKE algorithm12 was applied to constrain all hydrogen atoms.
The total simulation time was 100 ns for each of the 20 trajectories. Graphics and visualization analysis was processed using the VMD program13 and PyMOL (Schrodinger). At every 10 ps, a snapshot was taken to be analyzed for the production phase. Snapshots were aligned to the crystal structure backbone region 24–26 on both monomers. The root-mean-squared fluctuations (RMSFs) of Cα atoms were calculated using the PTRAJ program.9 Amide backbone order parameters were calculated for each backbone N–H vector using an in-house script based on the following equation:
| eq 1 |
μα(α = 1, 2, 3) are the x, y, z components of the normalized N–H vector.14
Statistical Analysis
Mann–Whitney U test (also called the Mann–Whitney–Wilcoxon (MWW), Wilcoxon rank-sum test, or Wilcoxon–Mann–Whitney test) is a nonparametric test of the null hypothesis that two populations are the same against an alternative hypothesis, especially that a particular population tends to have larger values than the other. The Mann–Whitney U test has greater efficiency than the t test on non-normal distributions, such as a mixture of normal distributions, and is nearly as efficient as the t test on normal distributions. The ranksum analysis was applied to MD-derived root-mean-square fluctuations (RMSF) and S2 values to identify residues with statistically significant differences in WT versus Flap+ protease simulations.
15N-Labeled Protease Expression, Purification and NMR Sample Preparation
HIV-1 protease was expressed, purified, and refolded as described before.6 Proteins were dissolved in a buffer containing 20 mM sodium phosphate pH 5.8 and 100 mM NaCl with 5% D2O. All the NMR experiments were performed at a concentration of ∼250–300 μM (as a monomer). For the DRV bound samples, DRV was added (an 8:1 molar ratio of inhibitor to dimeric protein to ensure full binding) during the refolding step.
NMR Data Acquisition
All NMR spectra were acquired at 293 K on a Bruker Avance II spectrometer operating at a 1H Larmor frequency of 600 MHz. Backbone signal assignments for DRV-bound WT and Flap+ proteases were performed using spectra acquired with the same experimental parameters as for the unliganded state.6 Backbone resonance assignments of 15N and 1H signals for DRV bound WT and Flap+ proteases were carried out using an HNCA spectrum with the apo form assignments as a reference. Similarly, R1, R2, and {1H}-15N NOE parameters were determined as previously described.6 In the R1 and R2 experiments, spectra were recorded with 7 relaxation delay points: 0, 50, 100, 200, 300, 500, and 800 ms for R1, and 0, 8, 16, 24, 32, 48, and 64 ms for R2. Uncertainties in the relaxation rates were estimated from Monte Carlo error simulation using residual of the initial fits as data uncertainties to generate synthetic data sets. Uncertainties in the {1H}-15N NOE parameter were estimated from the spectrum noise.
CT-CPMG R2 dispersion experiments, to probe ms−μs time scale motions,15 were employed for WT and Flap+ proteases in the presence and absence of DRV, according to established protocols with a 15N carrier frequency at 117.12 ppm and the total relaxation delay period TCPMG of 32 ms. In addition to a reference spectrum without the TCPMG delay, the dispersion spectra were recorded at νeff of 31.25, 62.5, 93.75, 125, 156.25, 187.5, 218.75, 250, 281.25, 312.5, 375, 437.5, 500, 562.5, 625, 687.5, and 750 Hz. Here, νeff is an effective field strength defined by the relation νeff = 1/(4·τeff) where τeff is a half delay between the centers of adjacent 15N CPMG pulses. R2 was determined by assuming a single exponential decay function relating the initial (I0) at t = 0 and the final (Iνeff) at t = TCPMG peak intensity with R2(νeff) = −ln(I0/Iνeff)/TCPMG. Data were analyzed according to established protocols and primarily evaluated based on partial F statistic.16 The details are provided in Supporting Information.
Model Free Analysis and Same Model Selection
After determining the overall rotational correlation time τc, model-free analysis (MFA) was performed using the same model selection (MFAsame) method to compare the difference in dynamics between the WT and Flap+ protease, as described previously.6 First, data for all the residues were fit using the standard model (S2, τi) by minimizing a target function, χ2. If the data sets were not fit adequately using the standard model, models with three parameters, an extended model (Sf2, Ss2, τi) and an exchange model (S2, τi, Rex), were tested (with fit criterion for all models that the normalized χ2, χ2/N < 6.64, which corresponds to α = 0.01). Here, S2 = Sf2·Ss2 with order parameters for fast (f) and slow (s) internal motions, and Rex indicates contribution of chemical exchange to R2. When one of the two data sets, either WT or Flap+, was not explained using the standard model but a three-parameter model instead, that same three parameter-model was applied to the other data set for the final determination of the S2 value. For the model-free analysis, the minimum error in the relaxation parameters was set at 2% for the R1 and R2 data and 4% for the {1H}-15N NOE to avoid underestimation of the error.
Results
Protein dynamics is a key component in proper biological function, and alterations in dynamics due to mutations may be one of the molecular mechanisms underlying drug resistance in HIV-1 protease. We previously observed a high impact of mutations on dynamics in the unliganded state of Flap+, especially in the flap region.6 The flaps are very mobile in unliganded protease, but close upon the bound inhibitor and become less flexible in the inhibitor-bound state. The impact of mutations on this DRV-bound state were comparatively investigated for WT and Flap+ protease.
Molecular Dynamics Simulations of DRV-Bound WT and Flap+ Protease
To investigate the conformational dynamics of DRV-bound HIV-1 protease, a total of 10 fully hydrated 100 ns MD trajectories each for WT and Flap+ proteases were generated, enabling extensive sampling of the conformational space (Figure 1). Although the protease is a symmetric homodimer, the inhibitor is not and hence induces asymmetry to the complex. Therefore, the dynamics of the two monomers were analyzed separately.
Figure 1.

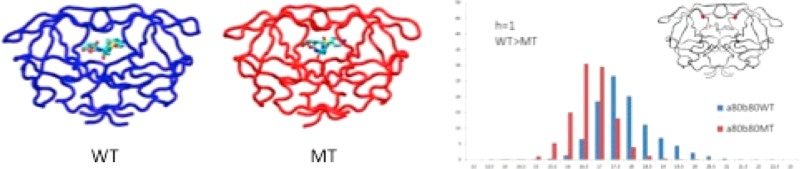
Snapshots of DRV-bound WT (blue) and Flap+ (red) protease complex conformation at the end of each 100 ns MD simulation.
The protease backbone flexibility was assessed by RMSF of Cα atoms during the MD trajectories (Figure 2). As with the unliganded protease, the most stable area with the lowest RMSF values in both monomers is the region around the catalytic Asp25. Compared to the WT protease, the whole backbone is less flexible in Flap+ with average RMSF values of 1.43 and 1.30 Å and dispersions of 0.53 and 0.50 over the residues, respectively. This decrease in RMSF values was statistically significant for 108 out of 198 protease residues (p < 0.05, negative values in Figure S1b). Hence, drug resistance mutations in Flap+ cause restriction of backbone flexibility in the inhibitor-bound state, while they have the opposite effect in the unliganded state (positive values in Figure S1a).6
Figure 2.

RMSF values of the Cα atoms (Å) for each residue in WT (blue) and Flap+ (red) HIV-1 protease averaged over ten 100 ns MD simulations.
Distance Distributions Around the Active Site Are Altered in Flap+
To assess the conformational differences between the DRV-bound WT and Flap+ protease, distance distributions between residues at the active site were calculated over the MD trajectories (Figure 3). The distance sampling between the catalytic Asp25 and the flap tip is slightly larger in Flap+, with a statistically significant increase for one of the intramonomeric distances (a25–a50). In the complex crystal structures, this distance is also larger in Flap+ for monomer a (0.41 Å), but shorter in monomer b (−0.44 Å for b25–b50) (Table 1). However, this difference in the b25–b50 distance is lost in the dynamic conformational ensemble.
Figure 3.

Distribution in percent of distances in Å between alpha carbons of the flaps, 80s loop, and the active site in WT (blue) and mutant Flap+ (MT, red) HIV-1 protease calculated over ten 100 ns trajectories. The h value is 1 for statistically significant differences between WT and Flap+ according to rank sum analysis (see Methods for details).
Table 1. Distance in Å in Crystal Structures (cryst) and Average Distance (ave) between Cα Atom Pairs During 100 ns MD Trajectories for WT and Mutant Flap+ (MT) Protease.
| atom pair | WTcryst | MTcryst | Δcrystb | WTavea | MTavea | Δaveb |
|---|---|---|---|---|---|---|
| b25b50 | 14.60 | 14.16 | 0.44 | 14.27 ± 0.51 | 14.22 ± 0.48 | 0.05 |
| a50a25 | 13.60 | 14.01 | –0.41 | 14.15 ± 0.59 | 14.33 ± 0.55 | –0.18 |
| a25b50 | 12.69 | 12.74 | –0.05 | 12.58 ± 0.51 | 12.67 ± 0.50 | –0.09 |
| a50b25 | 12.67 | 12.53 | 0.14 | 13.26 ± 0.74 | 13.34 ± 0.62 | –0.08 |
| a50b50 | 6.02 | 6.18 | –0.16 | 6.16 ± 0.72 | 6.07 ± 0.58 | 0.08 |
| a80b50 | 5.18 | 5.19 | –0.01 | 5.84 ± 0.42 | 5.60 ± 0.53 | 0.24 |
| a50b80 | 5.88 | 5.09 | 0.79 | 6.25 ± 0.67 | 6.04 ± 0.67 | 0.21 |
| a80a50 | 11.06 | 11.32 | –0.26 | 11.73 ± 0.88 | 11.41 ± 0.81 | 0.32 |
| b80b50 | 11.82 | 11.26 | 0.55 | 12.26 ± 0.82 | 11.98 ± 0.78 | 0.27 |
| a80b80 | 16.88 | 16.39 | 0.49 | 17.82 ± 0.92 | 17.27 ± 0.96 | 0.55 |
Mean and standard deviation for distributions displayed in Figure 3.
Δ = WT – MT.
The change in the distance between the 80s loop and the flap tip of Flap+ is more pronounced. All four residue 80–50 distances are shorter in Flap+ than in the WT protease. The intermonomeric 80–80 distance is also shorter in Flap+, while the 50–50 distance is unchanged. These changes are consistent with the crystallographic distances, except for those involving residue a80. In crystal structures, a80–b50 is unchanged, while a80–a50 is longer in Flap+. However, dynamically the two 80s loops of Flap+ behave more similarly to each other and move closer to each other on the average by 0.55 Å and to the flap tips by 0.24–0.32 Å (Table 1). In the unliganded state, the distance between the 80s loops was also shorter compared to WT.6 Together, these distance distributions describe the dynamic ensemble of DRV-bound Flap+ having the two inner walls of the active site (80s loops) closer to each other and the flap tips, while the flaps move slightly away from the catalytic site.
NMR Dynamics and Comparison with MD of DRV-Bound Protease
As we did previously for the unliganded state,6 the MD simulations were complemented with NMR relaxation experiments to evaluate the dynamic differences between WT and Flap+ protease variants. For this purpose, the backbone dynamics was characterized on nano- and picosecond (ns–ps) time scale for the DRV-bound forms of WT and Flap+ proteases by R1 (longitudinal relaxation rate), R2 (transverse relaxation rate), and {1H}-15N nuclear Overhauser enhancement ({1H}-15N NOE) experiments with model free analysis.17 We further elucidated dynamics in the milli- and microsecond (ms−μs) time scale by constant-time Carr–Purcell–Meiboom–Gill (CT-CPMG) R2 relaxation dispersion experiments.
Binding of asymmetric inhibitor DRV removes the degeneracy of signals that was observed in the symmetric apo homodimer of the protease. Because of this, some residues showed signals at two 1H and 15N cross peaks in the DRV-bound state (Figure 4). The regions that display the most pronounced loss in degeneracy with distinct 13C chemical shifts (difference for the same residue in the two monomers >1 ppm) correspond to the active site where the asymmetric inhibitor binds: residues 23–32, 46–53, 82–85 in WT and 23–33, 45–58, 84–85 in Flap+ protease.
Figure 4.

NMR relaxation data for WT (filled circles) and Flap+ (open triangles) HIV-1 protease in DRV-bound state. Data were acquired at a 15N Larmor frequency of 61 MHz at 20 °C. Two data points are displayed for some residues due to the loss of degeneracy between the two subunits on binding the asymmetric inhibitor DRV.
The profiles of R1, R2, and {1H}-15N NOE values for WT and Flap+ variants are very similar (Figure 4), indicating that the overall dynamics of the protein does not change. Unlike the unliganded state, the flaps are not very flexible and do not undergo significant motions in the subnanosecond time scale, which is reflected in R2 and NOE values for the flaps not lower than the rest of the protein, except for residues 50–51. The higher R2 values for these residues may be due to βI-βII turn flip motion at the tip of the flap in the DRV bound state for both WT and Flap+ protease, as discussed previously.18 In the WT protease, residue 51 was not visible in the 1H–15N correlation spectra possibly due to peak broadening caused by this turn flip motion, suggesting this motion may be more extensive in WT compared to Flap+ variant.
The acquired relaxation parameters were subjected to model free analysis to investigate internal protein dynamics. The rotational correlation time for the overall tumbling of the protein in solution τc was determined as 11.9 ± 0.2 and 12.2 ± 0.2 ns for DRV-bound Flap+ and WT HIV-1 protease, respectively, consistent with the similarity of their crystal structures.10 The order parameters obtained through model-free analysis and calculated from MD trajectories qualitatively agree, and are similar for WT and Flap+ proteases (Figures 5 and S5). The average value of NMR order parameters is 0.81 for both WT and Flap+ protease, in good agreement with average MD-derived value of 0.83 for the 1 ns time window, indicating the backbone flexibility on the subnanosecond time scale is similar for the two variants.
Figure 5.

Order parameters of backbone N–H bonds from MD simulations (blue, green, red lines for 1, 10, and 50 ns time windows, respectively) and NMR experiments (black circles) for WT and Flap+ HIV-1 protease. There are two data points displayed for most residues for experimentally determined NMR order parameters, as the degenerate resonances cannot be unequivocally assigned to chains a or b due to the homodimeric nature of the protease.
Conformational Exchange in Apo and DRV-Bound Protease
To investigate slower motions in the ms−μs time scale by NMR relaxation, especially in the flap region, we preformed relaxation dispersion analysis on both apo and DRV-bound forms. The conformational exchange, or motions in the ms−μs time scale that give rise to an additional contribution Rex to R2, was probed by CT-CPMG relaxation dispersion experiments. The residues undergoing conformational exchange were identified by statistically comparing the fit of the data to a uniform R2 model versus an exchange model, assessed by F statistics. Residues with high F statistic (F > 0.35) were then analyzed in more detail to determine the rate of conformational exchange, Rex (see Supporting Information).
As expected, the residues in the flap region of the apo protease displayed high F statistic and Rex values in both WT and Flap+ protease variants (Figure 6). Interestingly, albeit much lower in magnitude than the flaps, ms−μs motions are detected in other active site residues as well, including the catalytic site and the 80s loop. Dynamics in such longer time scales may be relevant to biological processes such as ligand recognition and binding. These motions were attenuated in the Flap+ variant of the apo enzyme, especially in the flap region. We previously showed that motions in the subnanosecond time scale are enhanced in Flap+ compared to WT protease for this region.6 Hence, in the apo form of Flap+, the flap dynamics are attenuated in the longer ms−μs time scales, and enhanced in subnanosecond time scales.
Figure 6.

Conformational exchange due to motions in the ms−μs time scale in unliganded WT (filled circle) and Flap+ (open triangle) HIV-1 protease. (A) The partial F statistic comparing the fits of individual residues to no-exchange and exchange models and (B) Rex, the exchange contribution to transverse relaxation. High F statistic and Rex values indicate residues undergoing conformational exchange in the ms−μs time scales.
In DRV-bound form, there was no conformational exchange detected in the flaps except for residues 50–51 (Figure S3). This result is consistent with βI-βII turn flip motion at the tip of the flap in the DRV bound forms, and low R2 and NOE values (Figure 4).
Difference in Mutant and WT Protease Dynamics in Apo and Inhibitor-Bound States
To obtain a complete picture of altered protein dynamics in Flap+ variant compared to WT protease, we compared the DRV-bound dynamics to the apo form, which we recently investigated in detail.6 We performed statistical analysis to reveal regions displaying changes in RMSF and order parameter values in MD simulations of both apo and inhibitor-bound states. In the apo form of the enzyme, there is no statistically significant difference in the order parameters except for the terminal regions of the two monomers (Figure 7a), while the Flap+ variant has higher RMSF in the outer regions of the protein including the flaps (Figure 7b). Unlike order parameters, which monitor the mobility of a vector, the RMSF values have no directionality; hence they are complementary probes of different types of dynamics. The high RMSF values of the outer region connected to the flaps in Flap+ protease indicate the changes in flap dynamics propagate to a relatively large portion of the protease in the apo form.
Figure 7.

Residues displaying statistically significant differences between WT and Flap+ protease dynamics in apo (left) and complex (right) forms. (a) MD order parameters. Blue indicates higher flexibility for WT (smaller order parameters) and red higher flexibility for Flap+ protease. (b) RMSF of Cα atoms in MD simulations. Magenta and cyan indicate higher fluctuations for WT and Flap+, respectively.
In the DRV-bound state, there are many residues distributed over the structure with lower order parameter values in WT protease (Figure 7a, right). This higher backbone flexibility of WT protein in DRV-bound state is consistent with higher RMSF values compared to Flap+ variant (Figure 7b). As expected, the flap regions are less flexible in the inhibitor-bound state for both WT and mutant protease. However, this is not valid for all the regions of the backbone. When the RMSF values for free and bound states were compared (Figure S2), the active site region where the inhibitor binds (flaps, catalytic loop, 80s loop) was found to be less flexible in the inhibitor-bound state. This restriction is more pronounced and spread over a wider range of the backbone in Flap+ variant. However, regions of the protease other than the active site are actually more flexible in the inhibitor-bound state. Interestingly, these two effects compensate for each other to yield almost no overall change in RMSF values when averaged over the whole protease backbone (0.1 Å for WT, −0.2 Å for Flap+ with a dispersion of 0.4 over the protease residues for both variants). Hence, the average flexibility of the backbone is not significantly restricted due to inhibitor binding in WT protease (p > 0.05; p = 0.25 indicating statistically undistinguishable apo and inhibited forms in two-tailed unequal variance t test).
Compared to WT protease, Flap+ backbone is less flexible in the bound state (Figure 2) and more flexible in the unliganded state.6 These two effects add up to cause a considerable loss of motion due to inhibitor binding in Flap+ throughout the protease, and especially in the flap regions (Figure S1) (p < 0.05; p = 0.03 indicating apo and inhibited forms are different with a significance level of 97%).
Discussion
While the effect of active site mutations on drug resistance can be rationalized in terms of changes in the physical interactions between the inhibitor and the target, understanding resistance due to multiple mutations distributed throughout the target is not straightforward. To understand the molecular mechanisms underlying interdependency of mutations requires combining information from multiple techniques and considering the system as a whole, including the dynamics of both the inhibitor-free and bound states. Here, we found that drug resistance mutations alter the dynamic ensemble not only of the unliganded state of the enzyme6 but also with a unique signature in the inhibitor-bound state of HIV-1 protease.
We have used two independent and complementary methods, MD and NMR relaxation to assess the dynamics and backbone flexibility in WT and Flap+ protease. Although the order parameters from NMR model-free analysis and MD trajectories capture the overall subnanosecond flexibility trends of the backbone, the agreement between the two methods is hampered due to inherent limitations and errors associated with both methods and complex dynamics of the protease, as previously reported.5 NMR model free analysis assumes independent local and overall motions, which may not be valid for residues undergoing complex motions distributed over a wide time scale range. In this case, the exchange contribution to R2, which affects the resulting order parameter values, cannot be reliably extracted. Similarly, the spectral density function for the extended model assumes motions on two time scales, an approximation that cannot adequately represent the complex protease dynamics. Nevertheless, both methods concur in revealing that the subnanosecond dynamics are unchanged, while dynamics of the flap region on longer time scales are affected by the mutations. Recently, other drug resistance mutations have been reported to change the conformational sampling of HIV-1 protease detected by site-directed spin labeling DEER spectroscopy.19 In addition to the standard NMR relaxation experiments and model-free analysis, which probe ps–ns time scale motions, we employed CT-CPMG relaxation dispersion for motions in the ms−μs time scale. NMR relaxation dispersion is a very powerful method to extract information on these longer time scales where many biological processes including protein folding, binding, and enzyme catalysis, take place. Alteration of flap motions on these time scales in Flap+ variant (Figure 6) suggests that dynamics of substrate recognition events are impacted due to drug resistance mutations.
The relation between dynamics, entropy, and free energy of binding is conceptually known but often neglected, as evaluating such properties in a quantitative framework that can be utilized in practical applications is not straightforward. There are attempts linking NMR order parameters to conformational entropy,20 but conformational entropy due to motions on time scales not reflected in order parameters and entropic effects from the ligand or solvent further complicate linking dynamics to entropy. The conformational dynamics in the subnanosecond time scale probed by MD simulations and NMR order parameters were not sufficient to explain the entropy-driven inhibitor binding to Flap+, suggesting these other factors are in play here, as discussed below.
Our analysis of DRV dynamics during MD simulations did not reveal any significant changes between WT and Flap+ complexes, suggesting ligand contribution cannot be accountable for the energetic changes in Flap+ protease. Moreover, the observed extreme entropy–enthalpy compensation in Flap+ is not a function of the inhibitor, as this phenomenon was observed in binding all six different inhibitors tested.8 Another possible contributor is the solvent, water. The dramatic entropy–enthalpy compensation in Flap+ relative to WT protease is accompanied by a large change in heat capacity of binding (ΔCp = −508 ± 16 and −373 ± 32 cal/K mol for WT and Flap+ protease, respectively).8 This negative change in heat capacity upon binding indicates severe hydrophobic effects21 and may be at least partly due to the differential flap dynamics in Flap+ compared to WT protease. Our NMR and MD results indicate that in the unliganded Flap+ protease, the flap motions are enhanced in the faster subnanosecond motions, while the much longer ms−μs time scale dynamics and chemical exchange are attenuated. These dynamic changes are consistent with a smaller population of the minor flap conformer with flap–flap interactions.5e Such a loss in the minor flap–flap conformer is in agreement with the observed entropy-driven inhibitor binding by Flap+ protease, as the entropy would be enhanced by (1) less entropic penalty due to inhibitor binding as the unliganded state conformational degrees of freedom is restricted and (2) more entropic gain due to dehydration of solvent-exposed hydrophobic flaps.
Hence, the burial of hydrophobic solvent accessible surface area and the differential flap dynamics we detected by MD and NMR are intimately related to each other and are key in the underlying mechanism of entropic changes in inhibitor binding by Flap+ compared to WT protease. These effects should also be reflected in solvation energy, which can in principle be estimated using computational free energy techniques. Our previous free energy decomposition analysis using nanosecond-scale MD simulations suggested solvent effects to be minimal,22 indicating dynamic changes detected here at much longer time scales (6–7 orders of magnitude) may be responsible for the energetic behavior of Flap+ protease, consistent with our hypothesis above. More rigorous analysis of water molecules and networks encompassing wider time scales may be able to pinpoint changes in solvation, which has been reported to contribute to entropy–enthalpy compensation in other systems.23
The first-generation PIs were entropy-driven, more recent and more potent inhibitors such as DRV have binding enthalpies highly optimized as a result of structure-based design. However, Flap+ variant displays entropy-driven binding to DRV with an energetic profile similar to first-generation inhibitors.8 How can such drug resistance mutations profoundly modulate the thermodynamics of inhibitor binding and defy rational design? Our results indicate the need to consider both the unliganded and inhibitor-bound states and the dynamic changes therein. The inhibitor complex structures8 and backbone dynamics probed by traditional model free analysis were not sufficient to explain the thermodynamic observations. More extensive analysis by MD and NMR revealed differences in the conformational ensemble sampled by the two variants of protease in both unliganded and DRV-bound states. Notably, the shape of the active site is altered in inhibitor-bound state, and the flap motions of unliganded protease in the slower ms−μs time scales are more restricted in Flap+ variant. This attenuated dynamics corresponds to a loss in conformational exchange, which may lead to less entropic penalty upon ligand binding, correlating with entropy-driven inhibitor binding to Flap+ protease.
To conclude, despite extensive literature on the subject and recent advancements,23b,24 the molecular basis for entropy–enthalpy compensation is not fully understood, rendering prediction of thermodynamics from structure very difficult if not impossible. Additionally, structure-based design often focuses on observed interactions in the crystallographic bound state only and thereby neglects a major portion of the thermodynamics governing binding which includes the unliganded state, solvation processes and conformational dynamics. Our results support going beyond the lock-and-key models involving the structure of the ligand and active site and bringing conformational dynamics and entropic considerations to drug design. Mimicking the dynamic properties of natural substrates, employing the dynamic substrate envelope,25 and evaluating water structure in both unliganded and bound states may be useful approaches.
Acknowledgments
This work was supported by grants from the National Institutes of Health, National Institute of General Medical Sciences: P01 GM66524 and R01 GM65347.
Supporting Information Available
NMR CT-CPMG R2 dispersion methods and results, table of rank sum analysis results, plots of RMSF fluctuations, and scatter plots of MD-derived versus NMR order parameters. This material is available free of charge via the Internet at http://pubs.acs.org.
Author Contributions
§ These authors contributed equally
The authors declare no competing financial interest.
Funding Statement
National Institutes of Health, United States
Supplementary Material
References
- a Altman M. D.; Ali A.; Reddy G. S.; Nalam M. N.; Anjum S. G.; Cao H.; Chellappan S.; Kairys V.; Fernandes M. X.; Gilson M. K.; Schiffer C. A.; Rana T. M.; Tidor B. HIV-1 protease inhibitors from inverse design in the substrate envelope exhibit subnanomolar binding to drug-resistant variants. J. Am. Chem. Soc. 2008, 130, 6099–113. [DOI] [PMC free article] [PubMed] [Google Scholar]; b Nalam M. N.; Ali A.; Reddy G. S.; Cao H.; Anjum S. G.; Altman M. D.; Yilmaz N. K.; Tidor B.; Rana T. M.; Schiffer C. A. Substrate Envelope-Designed Potent HIV-1 Protease Inhibitors to Avoid Drug Resistance. Chem. Biol. 2013, 20, 1116–24. [DOI] [PMC free article] [PubMed] [Google Scholar]; c Ozen A.; Haliloglu T.; Schiffer C. A. Dynamics of Preferential Substrate Recognition in HIV-1 Protease: Redefining the Substrate Envelope. J. Mol. Biol. 2011, 410, 726–744. [DOI] [PMC free article] [PubMed] [Google Scholar]; d Prabu-Jeyabalan M.; King N. M.; Nalivaika E. A.; Heilek-Snyder G.; Cammack N.; Schiffer C. A. Substrate envelope and drug resistance: crystal structure of RO1 in complex with wild-type human immunodeficiency virus type 1 protease. Antimicrob. Agents Chemother. 2006, 50, 1518–21. [DOI] [PMC free article] [PubMed] [Google Scholar]
- Foulkes-Murzycki J. E.; Rosi C.; Kurt Yilmaz N.; Shafer R. W.; Schiffer C. A. Cooperative effects of drug-resistance mutations in the flap region of HIV-1 protease. ACS Chem. Biol. 2013, 8, 513–8. [DOI] [PMC free article] [PubMed] [Google Scholar]
- a Clemente J. C.; Hemrajani R.; Blum L. E.; Goodenow M. M.; Dunn B. M. Secondary mutations M36I and A71V in the human immunodeficiency virus type 1 protease can provide an advantage for the emergence of the primary mutation D30N. Biochemistry (Moscow) 2003, 42, 15029–35. [DOI] [PubMed] [Google Scholar]; b Clemente J. C.; Moose R. E.; Hemrajani R.; Whitford L. R.; Govindasamy L.; Reutzel R.; McKenna R.; Agbandje-McKenna M.; Goodenow M. M.; Dunn B. M. Comparing the accumulation of active- and nonactive-site mutations in the HIV-1 protease. Biochemistry (Moscow) 2004, 43, 12141–51. [DOI] [PubMed] [Google Scholar]
- a Foulkes-Murzycki J. E.; Scott W. R.; Schiffer C. A. Hydrophobic sliding: a possible mechanism for drug resistance in human immunodeficiency virus type 1 protease. Structure 2007, 15, 225–33. [DOI] [PMC free article] [PubMed] [Google Scholar]; b Mittal S.; Cai Y.; Nalam M. N.; Bolon D. N.; Schiffer C. A. Hydrophobic core flexibility modulates enzyme activity in HIV-1 protease. J. Am. Chem. Soc. 2012, 134, 4163–8. [DOI] [PMC free article] [PubMed] [Google Scholar]
- a Freedberg D. I.; Ishima R.; Jacob J.; Wang Y. X.; Kustanovich I.; Louis J. M.; Torchia D. A. Rapid structural fluctuations of the free HIV protease flaps in solution: relationship to crystal structures and comparison with predictions of dynamics calculations. Protein Sci. 2002, 11, 221–32. [DOI] [PMC free article] [PubMed] [Google Scholar]; b Galiano L.; Bonora M.; Fanucci G. E. Interflap distances in HIV-1 protease determined by pulsed EPR measurements. J. Am. Chem. Soc. 2007, 129, 11004–5. [DOI] [PubMed] [Google Scholar]; c Hornak V.; Okur A.; Rizzo R. C.; Simmerling C. HIV-1 protease flaps spontaneously close to the correct structure in simulations following manual placement of an inhibitor into the open state. J. Am. Chem. Soc. 2006, 128, 2812–3. [DOI] [PMC free article] [PubMed] [Google Scholar]; d Ishima R.; Freedberg D. I.; Wang Y. X.; Louis J. M.; Torchia D. A. Flap opening and dimer-interface flexibility in the free and inhibitor-bound HIV protease, and their implications for function. Structure 1999, 7, 1047–55. [DOI] [PubMed] [Google Scholar]; e Ishima R.; Louis J. M. A diverse view of protein dynamics from NMR studies of HIV-1 protease flaps. Proteins 2008, 70, 1408–15. [DOI] [PubMed] [Google Scholar]; f Louis J. M.; Ishima R.; Nesheiwat I.; Pannell L. K.; Lynch S. M.; Torchia D. A.; Gronenborn A. M. Revisiting monomeric HIV-1 protease. Characterization and redesign for improved properties. J. Biol. Chem. 2003, 278, 6085–92. [DOI] [PubMed] [Google Scholar]; g Perryman A. L.; Lin J. H.; McCammon J. A. HIV-1 protease molecular dynamics of a wild-type and of the V82F/I84V mutant: possible contributions to drug resistance and a potential new target site for drugs. Protein Sci. 2004, 13, 1108–23. [DOI] [PMC free article] [PubMed] [Google Scholar]; h Scott W. R.; Schiffer C. A. Curling of flap tips in HIV-1 protease as a mechanism for substrate entry and tolerance of drug resistance. Structure 2000, 8, 1259–65. [DOI] [PubMed] [Google Scholar]
- Cai Y.; Yilmaz N. K.; Myint W.; Ishima R.; Schiffer C. A. Differential Flap Dynamics in Wild-type and a Drug Resistant Variant of HIV-1 Protease Revealed by Molecular Dynamics and NMR Relaxation. J. Chem. Theory Comput. 2012, 8, 3452–3462. [DOI] [PMC free article] [PubMed] [Google Scholar]
- Shafer R. W.; Stevenson D.; Chan B. Human immunodeficiency virus reverse transcriptase and protease sequence database. Nucleic Acids Res. 1999, 27, 348–352. [DOI] [PMC free article] [PubMed] [Google Scholar]
- King N. M.; Prabu-Jeyabalan M.; Bandaranayake R. M.; Nalam M. N.; Ozen A.; Haliloglu T.; Schiffer C.. Extreme Entropy-Enthalpy Compensation in a Drug Resistant Variant of HIV-1 Protease. in preparation 2012. [DOI] [PMC free article] [PubMed]
- Case D. A.; Cheatham T. E. III; Darden T.; Gohlke H.; Luo R.; Merz K. M. Jr.; Onufriev A.; Simmerling C.; Wang B.; Woods R. J. The Amber biomolecular simulation programs. J. Comput. Chem. 2005, 26, 1668–88. [DOI] [PMC free article] [PubMed] [Google Scholar]
- Surleraux D. L.; Tahri A.; Verschueren W. G.; Pille G. M.; de Kock H. A.; Jonckers T. H.; Peeters A.; De Meyer S.; Azijn H.; Pauwels R.; de Bethune M. P.; King N. M.; Prabu-Jeyabalan M.; Schiffer C. A.; Wigerinck P. B. Discovery and selection of TMC114, a next generation HIV-1 protease inhibitor. J. Med. Chem. 2005, 48, 1813–22. [DOI] [PubMed] [Google Scholar]
- Duan Y.; Wu C.; Chowdhury S.; Lee M. C.; Xiong G.; Zhang W.; Yang R.; Cieplak P.; Luo R.; Lee T.; Caldwell J.; Wang J.; Kollman P. A point-charge force field for molecular mechanics simulations of proteins based on condensed-phase quantum mechanical calculations. J. Comput. Chem. 2003, 24, 1999–2012. [DOI] [PubMed] [Google Scholar]
- Ryckaert J.-P.; Ciccotti G.; Berendsen H. J. C. Numerical integration of the Cartesian equations of motion of a system with constraints: molecular dynamics of n-alkanes. J. Comput. Phys. 1977, 23, 327–341. [Google Scholar]
- Humphrey W.; Dalke A.; Schulten K. VMD - Visual Molecular Dynamics. J. Mol. Graphics 1996, 14, 33–8. [DOI] [PubMed] [Google Scholar]
- a Smith L. J.; Mark A. E.; Dobson C. M.; Vangunsteren W. F. Comparison of Md Simulations and Nmr Experiments for Hen Lysozyme - Analysis of Local Fluctuations, Cooperative Motions, and Global Changes. Biochemistry (Moscow) 1995, 34, 10918–10931. [DOI] [PubMed] [Google Scholar]; b Chandrasekhar I.; Clore G. M.; Szabo A.; Gronenborn A. M.; Brooks B. R. A 500-Ps Molecular-Dynamics Simulation Study of Interleukin-1-Beta in Water - Correlation with Nuclear-Magnetic-Resonance Spectroscopy and Crystallography. J. Mol. Biol. 1992, 226, 239–250. [DOI] [PubMed] [Google Scholar]
- Hansen D. F.; Vallurupalli P.; Kay L. E. An improved 15N relaxation dispersion experiment for the measurement of millisecond time-scale dynamics in proteins. J. Phys. Chem. B 2008, 112, 5898–904. [DOI] [PubMed] [Google Scholar]
- Jee J.; Ishima R.; Gronenborn A. M. Characterization of specific protein association by 15N CPMG relaxation dispersion NMR: the GB1(A34F) monomer-dimer equilibrium. J. Phys. Chem. B 2008, 112, 6008–12. [DOI] [PubMed] [Google Scholar]
- a Lipari G.; Szabo A. Model-free approach to the interpretation of nuclear magnetic resonance relaxation in macromolecules. 1. Theory and range of validity. J. Am. Chem. Soc. 1982, 104, 4546–4559. [Google Scholar]; b Lipari G.; Szabo A. Model-free approach to the interpretation of nuclear magnetic resonance relaxation in macromolecules. 2. Analysis of experimental results. J. Am. Chem. Soc. 1982, 104, 4559–4570. [Google Scholar]; c Mandel A. M.; Akke M.; Palmer A. G. Backbone Dynamics of Escherichia-Coli Ribonuclease Hi - Correlations with Structure and Function in an Active Enzyme. J. Mol. Biol. 1995, 246, 144–163. [DOI] [PubMed] [Google Scholar]
- Nicholson L. K.; Yamazaki T.; Torchia D. A.; Grzesiek S.; Bax A.; Stahl S. J.; Kaufman J. D.; Wingfield P. T.; Lam P. Y.; Jadhav P. K.; et al. Flexibility and function in HIV-1 protease. Nat. Struct. Biol. 1995, 2, 274–80. [DOI] [PubMed] [Google Scholar]
- a de Vera I. M.; Blackburn M. E.; Fanucci G. E. Correlating conformational shift induction with altered inhibitor potency in a multidrug resistant HIV-1 protease variant. Biochemistry (Moscow) 2012, 51, 7813–5. [DOI] [PMC free article] [PubMed] [Google Scholar]; b de Vera I. M.; Smith A. N.; Dancel M. C.; Huang X.; Dunn B. M.; Fanucci G. E. Elucidating a relationship between conformational sampling and drug resistance in HIV-1 protease. Biochemistry (Moscow) 2013, 52, 3278–88. [DOI] [PMC free article] [PubMed] [Google Scholar]
- a Tzeng S. R.; Kalodimos C. G. Protein activity regulation by conformational entropy. Nature 2012, 488, 236–40. [DOI] [PubMed] [Google Scholar]; b Yang D.; Kay L. E. Contributions to conformational entropy arising from bond vector fluctuations measured from NMR-derived order parameters: application to protein folding. J. Mol. Biol. 1996, 263, 369–82. [DOI] [PubMed] [Google Scholar]
- Perozzo R.; Folkers G.; Scapozza L. Thermodynamics of protein-ligand interactions: history, presence, and future aspects. J. Recept. Signal Transduction Res. 2004, 24, 1–52. [DOI] [PubMed] [Google Scholar]
- Cai Y.; Schiffer C. A. Decomposing the energetic impact of drug resistant mutations in HIV-1 protease on binding DRV. J. Chem. Theory Comput. 2010, 6, 1358–1368. [DOI] [PMC free article] [PubMed] [Google Scholar]
- a Abel R.; Salam N. K.; Shelley J.; Farid R.; Friesner R. A.; Sherman W. Contribution of explicit solvent effects to the binding affinity of small-molecule inhibitors in blood coagulation factor serine proteases. ChemMedChem 2011, 6, 1049–66. [DOI] [PubMed] [Google Scholar]; b Breiten B.; Lockett M. R.; Sherman W.; Fujita S.; Al-Sayah M.; Lange H.; Bowers C. M.; Heroux A.; Krilov G.; Whitesides G. M. Water networks contribute to enthalpy/entropy compensation in protein-ligand binding. J. Am. Chem. Soc. 2013, 135, 15579–84. [DOI] [PubMed] [Google Scholar]
- a Fenley A. T.; Muddana H. S.; Gilson M. K. Entropy-enthalpy transduction caused by conformational shifts can obscure the forces driving protein-ligand binding. Proc. Natl. Acad. Sci. U. S. A. 2012, 109, 20006–11. [DOI] [PMC free article] [PubMed] [Google Scholar]; b Ward J. M.; Gorenstein N. M.; Tian J.; Martin S. F.; Post C. B. Constraining binding hot spots: NMR and molecular dynamics simulations provide a structural explanation for enthalpy-entropy compensation in SH2-ligand binding. J. Am. Chem. Soc. 2010, 132, 11058–70. [DOI] [PMC free article] [PubMed] [Google Scholar]
- Ozen A.; Haliloglu T.; Schiffer C. A. Dynamics of preferential substrate recognition in HIV-1 protease: redefining the substrate envelope. J. Mol. Biol. 2011, 410, 726–44. [DOI] [PMC free article] [PubMed] [Google Scholar]
Associated Data
This section collects any data citations, data availability statements, or supplementary materials included in this article.