Abstract
In patients with type 1 diabetes mellitus (T1DM) complicated by severe hypoglycemic episodes, fear of hypoglycemia can significantly impact daily life. We evaluated whether restoration of glycemic awareness and prevention of hypoglycemia by islet allotransplant could reduce fear and improve health status. We conducted a comprehensive evaluation of patient based outcomes in 48 T1DM subjects screened for allogeneic islet transplant alone (ITA) and 27 subjects who received an ITA. A battery of generic health status and diabetes-specific measures were used to assess at evaluation, 6 months, and then annually after ITA. Allogeneic islet transplant was associated with a reduction in behaviors adopted in avoiding hypoglycemia (p value < 0.001) and an attenuation in concerns about hypoglycemic episodes (p value < 0.001). Changes in hypoglycemia fear tracked most closely with insulin use. While there was a trend toward global improvement in health as measured by theEQ-5D (p value = 0.002) and depression symptoms as measured by the Beck (p value = 0.003), physical health remained unchanged following ITA. Our findings support the socio-emotional benefits of ITA during the 5 years after ITA which to some extent remains dependent on preservation of islet graft function.
Keywords: allogeneic islet transplant, outcomes assessment (health care), quality of life, hypoglycemia fear, type 1 diabetes mellitus
Introduction
Glycemic lability and frequent, severe hypoglycemic episodes are accepted indications for islet allograft transplantation in individuals with type 1 diabetes mellitus [1, 2]. Allogeneic islet transplantation has emerged as a promising alternative to pancreas transplant for β-cell replacement in individuals with type 1 diabetes mellitus. Multiple studies have documented successful restoration of insulin independence after islet transplant alone (ITA) [3–9] In one follow-up analysis, investigators reported relief from glucose instability and severe hypoglycemia in a cohort of 65 islet transplant recipients for up to 5 years post-transplant [10]. However, only a minority of the patients in this cohort maintained insulin independence despite multiple transplants. The University of Minnesota has previously demonstrated the feasibility of achieving insulin independence and resolution of hypoglycemic episodes from a single donor [3, 4] and long-term preservation of insulin independence [6].
While previous research has demonstrated the clinical effectiveness of islet transplantation, less is known about the islet transplant recipients perception of their health before and after islet transplantation. In a letter to the readers of Diabetes Care, Johnson and his colleagues [11] reported a reduction in the fear of hypoglycemic episodes after islet transplantation, as measured by the Hypoglycemia Fear Survey (FHS), and a reduction in anxiety [12, 13]. In a subsequent follow-up, Toso and colleagues [14] found a reduced fear of hypoglycemia at 3-years but without improvements in health-related quality of life. Barshes and his colleagues [15] reported similar reductions in anxiety about hypoglycemia and its consequences, in the absence of improvements in general health posttransplant and other dimensions of health post transplant. These small studies were limited by their follow up. Taken as whole, the previous research into the impact of ITA on psychological function and general health status has been limited by short length of follow-up and the number of health dimensions considered.
The Long-term Islet Transplant Follow-up Study (LTIS) is an exploratory investigation into the effectiveness of ITA on health-related quality of life (HQOL) during the first 5 years following the last islet infusion. The principal focus of LTIS is the reduction in the fear of hypoglycemia and distress associated with diabetes and its management. Secondary health outcomes measures, such as global health and mental health, form the remaining components of the comprehensive LTIS health assessment following ITA.
Materials and Methods
Study Group
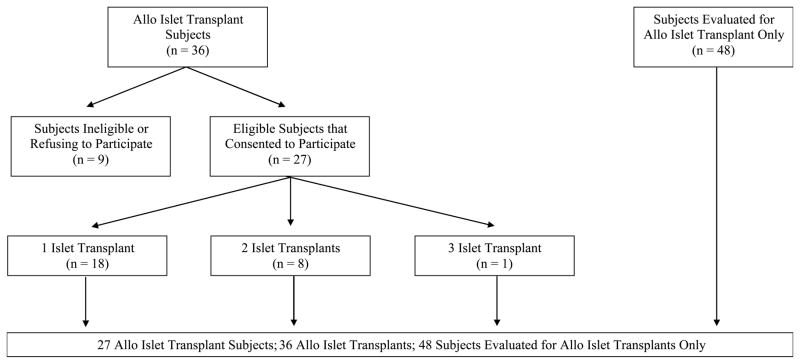
Between August 2000 and August 2009, there were 36 ITA patients at the University of Minnesota (UMN) eligible for recruitment. Only 27 ITA recipients with at least 6-months posttransplant were included in the LTIS follow-up analysis. Human islet transplants were performed at UMN as previously described [3, 4, 6]. A battery of generic and diabetes-targeted measures was administered as part of the screening process for all patients. Those patients receiving ITA were invited to participate in a long-term follow up study, in which we examined the self-reported health status at different stages before and after islet transplantation. Twenty-seven ITA recipients and 48 type 1 diabetic patients who were evaluated but did not undergo transplant were included in this analysis (see Figure 1). Nine ITA recipients were excluded for refusing to participate in LTIS or enrollment in a competing clinical study that forbade participation. All protocols were approved by the University of Minnesota Human Subjects Protection Committee.
Figure 1.
Participants in the Long-Term Allogeneic Islet Transplant Follow-up Study (LTIS)
Health Outcomes
Health outcomes were assessed by a battery of HRQoL measures. Generic health was assessed using the EuroQol-5D (EQ-5D), a standardized, global measure of health [16], along with the most recent version of the 36-item short form health survey (SF-36v2) [17–22]. The SF-36v2 gives a health status profile along 8 dimensions: Physical Functioning (PF), Role Limitations Attributed to Physical Health Problems (RP), Bodily Pain (BP), General Health (GH), Social Functioning (SF), Vitality (VT), Role Limitations Attributed to Emotional Health Problems (RE), and Mental Health (MH). The scale scores range between 0 and 100 with higher values signifying more positive health attributes. These 8 scale scores were summarized as Physical Component Summary (PCS) and Mental Component Summary Scale (MCS) scores. These latter more global measures are standard normalized (mean of 50 and standard deviation of 10) to a representative sample of the United States.
As a global measure of HRQoL, we used the visual analogue scale (VAS) version EQ-5D [16, 23, 24]. In the EQ-5D, values approaching a maximum of 100 signify a perfect health state whereas values approaching 0 indicate the worst possible health states. We used the revised version of the Beck Depression Inventory (BDI-II) to measure depression [25, 26]. High scores indicate more depressive symptoms.
Two diabetes-specific quality of life instruments were administered in LTIS battery of measures. To measure fear of hypoglycemia and lack of awareness of hypoglycemia, we used the Hypoglycemia Fear Survey (HFS) [27–29]. The HFS has subscales measuring behavior (HFS-B) and worry (HFS-W). Finally, to measure distress associated with managing diabetes, we used the Diabetes Distress Scale (DDS) [28]. The DDS is partly based on earlier work with the Problem Areas in Diabetes (PAID) scale [27, 29]. The 17-item DDS measures 4 domains critical to diabetes-related distress: (1) emotional burden of diabetes (EB), (2) physician-related distress (PD), (3) regimen-related distress (RD), and (4) interpersonal distress (ID).
Timing of Data Collection
Prior to collecting data, appropriate informed consent was obtained for all subjects. The battery of health measures was administered to study participants at the time of transplant evaluation and 6 months, 1 year and annually thereafter. After islet transplant, study participants who were not physically present for testing or follow-up care were mailed the instruments and asked to return them to us in a self-addressed, stamped envelope. Since 9 islet transplant recipients received 2 or more islet transplant infusions, the last islet transplant was used as the baseline or index measure for the analysis. Using the most recent or last transplant provided a definitive start point for observations and comparable follow-up windows between transplant numbers (i.e., the number of transplants).
Statistical Analysis
Our analysis focused on trajectory of change in patient-based health status with time following islet transplant. For the analysis, mixed model methods were used. Compared to least squares linear modeling techniques, mixed model methods has several advantages. First, this method can accommodate missing data, frequently encountered in panel and longitudinal studies. Not unexpected, participating subjects had as few as one health outcomes measure but as many as 7. Second, mixed model methods take into account the dependence of replicate measures [30, 31]. That is, follow-up measures are more strongly associated with earlier scores for that subject. This approach more fully accounts for the within subject variability that is ignored in least squares regression. Finally, the mixed approach allowed us to quantify the effects of the ITA in terms of a standard metric. In the analysis, we looked at change scores between the baseline evaluation and each interval through 5 years follow-up. All analysis was performed using the PROC MIXED procedure in SAS® System version 9.2. Scale scores were reported as least squares (LS) means, which are equivalent to adjusted means. Since the study did not call for a control group, the LS means were adjusted for potential confounding using the following factors: (1) age of the subject, (2) gender of subject, (3) the number of previous allogeneic islet transplants, (4) the number of hypoglycemic episodes prior to islet infusion, (5) number of years with diabetes mellitus, and (6) hemoglobin A1C at transplant evaluation.
Improvements in HRQoL were tested using a global test for each of the primary outcomes. The dimension of time was represented by 0 for the pre-ITA evaluation and the number of years after IAT (i.e., 0.5, 1, 2, 3, 4, 5 years). Since subjects often completed multiple surveys within a time window, say 1 to 2 years, the survey measure closest to the time-point was chosen for analysis. Global tests for the effect of time that were statistically significant at the 0.05 level based on the Type III sum of squares were follow-up tested. The selection of the covariance structure and best fitting model for each mixed model was based on Akaike’s Information Criteria (AIC). Post-hoc follow-up included: (1) pre-transplant – 6-month, (2) pre-transplant – 1-year, (3) pre-transplant –2-years, (4) pre-transplant – 3-years, (5) pre-transplant – 4-years, (6) pre-transplant – 5-years. The adjusted differences in scale scores were tested for statistical significance using a Bonferroni corrected p value [32–34]. This correction reduces the threat of type 1 errors by taking into account the number of comparisons being made.
Results
Based on the timing of recruitment to the study and subject consent, there were 123 observation windows across the 27 ITA subjects. Ninety-four of the observation windows (response rate 76.4%) had completed surveys. Response rates for each window were as follows (number of observations/number eligible): (1) pretransplant evaluation, (12/14) 85.7%; (2) 6 months, (11/14) 78.6%; (3) 1 year, (16/18) 88.9%; (4) 2 year, (14/22) 63.6%; (5) 3 year, (13/19) 68.4%; (6) 4 year, (13/17) 76.5%; and (7) 5 year, (15/19) 78.9%. Across the observation windows, subjects were eligible for as few as 1 to as many 7 surveys. The average number of eligible surveys was 4.6. Five of the subjects (22.7%) were missing more than 2 surveys. Twenty-six of the LTIS subjects (96.3%) completed more than one-half of the required surveys.
Table 1 summarizes key characteristics for ITA subjects and subjects that were evaluated but not transplanted. There were a total of 36 islet infusions across the 27 recipient subjects. Two-thirds of these subjects had one transplant, 8 (29.6%) had 2 transplants, and 1 (3.7%) had 3 transplants. The mean age of recipients was slightly younger than those evaluated only, 41.5 years compared with 46.1 years respectively (p value 0.023). Recipient and evaluation subjects were female and over three-fourths were married.
Table 1.
Characteristics of Participants in the Long-Term Allo Islet Transplant Follow-up Study (LTIS).
| Allo Islet Transplant Recipients | Allo Islet Transplant Evaluations Only | P value | |
|---|---|---|---|
| N | 27 | 48 | |
| Age, in years | 41.5 ± 1.3 | 46.1 ± 1.4 | 0.023 |
| Gender† | |||
| Male | 7 (25.9) | 18 (37.5) | 0.307 |
| Female | 20 (74.1) | 30 (62.5) | |
| Marital Status† | |||
| Married | 6 (22.2) | 10 (21.3) | 0.924 |
| Unmarried | 21 (77.8) | 37 (78.7) | |
| Number of Years of Diabetes Mellitus* | 26.49 ± 1.59 | 31.79 ± 1.51 | 0.018 |
| Body Mass Index (kg/meter2)* | 22.50 ± 0.33 | 23.81 ± 0.37 | < 0.001 |
| Hemoglobin A1C at Time of Evaluation* | 7.12 ± 0.20 | 7.19 ± 0.15 | 0.785 |
| Number of Hypoglycemic Episodes in the Year Before Evaluation* | 8.89 ± 4.08 | 8.54 ± 5.88 | 0.765 |
| Number of Islet Infusions | |||
| One Islet Infusion | 18 (66.7) | ||
| Two Islet Infusions | 8 (29.6) | ||
| Three Islet Infusions | 1 (3.7) | ||
Values are mean ± SEM
Values are number (percent)
Since 12 subjects (44.4%) were recruited to the study after ITA, pretransplant health status was incomplete for the LTIS study group. As a frame of reference, the 48 subjects evaluated for ITA but not transplanted were compared with ITA recipients. These individuals at the time of this analysis were awaiting ITA under new protocol. Except for being older (p value = 0.023), subjects on the waitlist were similar to the ITA subjects, slightly heavier than recipient subjects (p < 0.001) and had diabetes longer (26.49 ± 1.59 years for ITA recipients compared with 31.79 ± 1.51 years for evaluations only, p = 0.018).
Patients were weaned off insulin to meet the following glycemic goals: capillary fasting blood sugars < 140 mg/dL, 2 hour post-prandial <180 mg/dL and HbA1c ≤ 6.5%. Those patients not requiring any insulin on a daily basis were considered insulin independent. Twenty-four of the 27 (88.9%) achieved insulin independence at any time point. Three of the recipients had graft failure during the first year; the remaining 2 had graft failures between the 4th and 5th years after islet transplant. Twenty-three (85.2%) of recipients maintained insulin independence at 1 year, 52.4% at 3 years, and 47.4% at 5 years.
The primary patient-based health outcomes at the time of evaluation are summarized in Table 2. Generic outcomes include: the 2 component summary scales from the SF-36 Health Survey, the BDI-II and EQ-5D. The 6 diabetes-targeted outcomes were derived from the Diabetes Distress Scale and the Hypoglycemia Fear Scale. The table shows that the ITA recipients at the evaluation before islet infusion had comparable health-related quality of life, diabetes distress and hypoglycemia fear to those subjects that were evaluated only and not transplanted. In general, pre-transplant subjects tended to have scale scores indicative of normal physical functioning and mental health scores suggesting higher levels of depression and anxiety. The diabetes-specific measures show that subjects at higher levels of distress and fear of hypoglycemia.
Table 2.
Adjusted Means* at Evaluation for Allo Islet Transplant Recipients (N = 12) and Allo Islet Transplant Evaluations (N = 48).
| Allo Islet Transplant Recipients | Allo Islet Transplant Evaluations Only | P value | |
|---|---|---|---|
| SF-36 Health Survey | |||
| Physical Functioning | 91.0 | 85.1 | 0.348 |
| Role-Physical | 77.4 | 71.4 | 0.582 |
| Bodily Pain | 83.4 | 75.9 | 0.386 |
| General Health | 56.1 | 49.1 | 0.349 |
| Social Functioning | 77.0 | 70.6 | 0.492 |
| Vitality | 49.9 | 56.1 | 0.392 |
| Role-Emotional | 84.1 | 80.5 | 0.640 |
| Mental Health | 59.4 | 57.9 | 0.736 |
| Physical Component Summary | 52.7 | 49.6 | 0.343 |
| Mental Component Summary | 42.3 | 42.4 | 0.984 |
| Beck Depression Inventory | 15.2 | 8.3 | 0.019 |
| EQ-5D VAS | 65.9 | 66.4 | 0.943 |
| Diabetes Distress Scale | |||
| Emotional Burden | 36.7 | 48.9 | 0.236 |
| Physician Related Distress | 12.2 | 10.4 | 0.768 |
| Regimen Related Distress | 17.5 | 18.6 | 0.859 |
| Interpersonal Distress | 10.5 | 21.4 | 0.174 |
| Hypoglycemia Fear Scale | |||
| Behavioral Subscale | 44.7 | 49.6 | 0.401 |
| Worry Subscale | 57.0 | 58.0 | 0.894 |
Values adjusted for age, gender, marital status, years with diabetes, HbA1C, and the number of hypoglycemic episodes in the previous 12 months.
The trajectories of change in HRQoL are given in Table 3. For each health outcome, the results of the mixed model analysis (Type III) are shown for the effect of time in years following ITA. Since none of the potential covariates was independently associated with the change in HRQoL, the final model includes only the effect of time following ITA within subject. Change in scale scores and the corresponding standard error of the mean for the difference between the pre-transplant evaluation and each of the 6 time intervals following islet transplant infusion are given.
Table 3.
Least Squares Mean Change in Scale Score from Pretransplant Evaluation to Time Following Islet Transplant Alone (+/− Standard Error of Mean) for 27 Subjects Enrolled in the Long-Term Islet Transplant Study.
| Pretransplant Evaluation Scale Score | Change in Scale Score from Pretransplant Evaluation to…
|
Type 3 Test of Fixed Effects
|
||||||||
|---|---|---|---|---|---|---|---|---|---|---|
| 6 Months | 1 Year | 2 Year | 3 Year | 4 Year | 5 Year | F Statistic | DF | p value | ||
| SF-36 Health Survey | ||||||||||
| Physical Functioning | 91.88 | 1.08 ± 4.9 | 2.88 ± 4.5 | −4.17 ± 4.5 | −3.20 ± 4.6 | −3.69 ± 4.5 | −3.94 ± 4.5 | 1.19 | 6, 86 | 0.320 |
| Role-Physical | 76.45 | −2.42 ± 9.6 | 5.86 ± 8.8 | −8.62 ± 8.9 | −12.54 ± 9.5 | −5.34 ± 9.1 | −0.48 ± 9.3 | 0.99 | 6, 72.4 | 0.436 |
| Bodily Pain | 78.47 | 7.58 ± 7.9 | 5.20 ± 7.2 | −4.09 ± 7.4 | 3.82 ± 7.7 | 7.50 ± 7.6 | 2.68 ± 7.8 | 0.69 | 6, 77.7 | 0.657 |
| General Health | 64.14 | 5.83 ± 6.1 | 5.54 ± 5.6 | −4.18 ± 5.8 | −0.52 ± 6.0 | 2.65 ± 5.9 | −1.84 ± 6.1 | 0.85 | 6, 75.9 | 0.537 |
| Social Functioning | 74.39 | 21.16 ± 10.6 | 12.44 ± 9.8 | −15.21 ± 9.7 | −5.42 ± 10.0 | −10.68 ± 9.7 | −7.75 ± 9.8 | 3.55 | 6, 67.9 | 0.004 |
| Vitality | 54.40 | −3.44 ± 7.8 | 1.29 ± 7.2 | −6.04 ± 7.3 | −0.66 ± 7.6 | −3.42 ± 7.5 | −1.49 ± 7.6 | 0.26 | 6, 77.6 | 0.954 |
| Role-Emotional | 87.97 | 0.24 ± 7.1 | 5.86 ± 6.4 | −5.46 ± 6.6 | 1.57 ± 7.0 | −1.03 ± 6.7 | 2.11 ± 6.9 | 0.63 | 6, 76.8 | 0.702 |
| Mental Health | 62.84 | 3.89 ± 4.6 | 3.10 ± 4.2 | −0.57 ± 4.3 | 3.83 ± 4.5 | 5.27 ± 4.5 | 4.95 ± 4.6 | 0.58 | 6, 75.6 | 0.743 |
| Physical Component Summary | 52.44 | 0.87 ± 2.9 | 1.80 ± 2.6 | −2.32 ± 2.7 | −2.30 ± 2.8 | −0.23 ± 2.7 | 0.47 ± 2.8 | 0.71 | 6, 77.9 | 0.641 |
| Mental Component Summary | 45.11 | 3.03 ± 3.4 | 2.91 ± 3.1 | −1.54 ± 3.2 | 2.55 ± 3.7 | 0.75 ± 3.2 | 1.41 ± 3.3 | 0.61 | 6, 75.8 | 0.719 |
| Beck Depression Inventory | 13.57 | −5.55 ± 2.1 | −7.80 ± 1.9 | −7.07 ± 2.0 | −5.76 ± 2.0 | −4.48 ± 2.0 | −3.77 ± 2.1 | 3.70 | 6, 73.5 | 0.003 |
| EQ-5D VAS | 68.28 | 9.73 ± 4.4 | 17.25 ± 4.0 | 13.35 ± 4.2 | 13.12 ± 4.3 | 10.00 ± 4.3 | 6.69 ± 4.4 | 3.84 | 6, 74 | 0.002 |
| Diabetes Distress Scale | ||||||||||
| Emotional Burden | 36.35 | −6.09 ± 9.9 | −0.24 ± 9.1 | −7.21 ± 9.4 | −6.64 ± 9.7 | −6.56 ± 9.6 | −5.61 ± 9.9 | 0.21 | 6, 75.6 | 0.971 |
| Physician Related Distress | 12.23 | −5.76 ± 4.5 | −3.38 ± 4.1 | −6.54 ± 4.2 | −6.17 ± 4.4 | −4.15 ± 4.3 | 7.54 ± 4.4 | 0.67 | 6, 76.4 | 0.675 |
| Regimen Related Distress | 20.17 | −4.21 ± 4.7 | −4.80 ± 4.3 | −3.09 ± 4.5 | −5.47 ± 4.7 | −5.88 ± 4.6 | −5.49 ± 4.8 | 0.37 | 6, 71.4 | 0.894 |
| Interpersonal Distress | 14.86 | −2.26 ± 5.9 | 3.42 ± 5.4 | −0.19 ± 5.6 | 2.79 ± 5.8 | −5.41 ± 5.7 | −4.44 ± 5.9 | 0.83 | 6, 74.5 | 0.550 |
| Hypoglycemia Fear Scale | ||||||||||
| Behavioral Subscale | 47.94 | −28.48 ± 6.2 | −37.93 ± 5.7 | −41.16 ± 5.8 | −35.09 ± 6.2 | −34.41 ± 6.0 | −35.27 ± 6.1 | 10.42 | 6, 74.5 | < 0.001 |
| Worry Subscale | 55.77 | −41.94 ± 6.9 | −46.13 ± 6.2 | −46.91 ± 6.6 | −39.49 ± 6.6 | −37.52 ± 6.7 | −37.16 ± 6.9 | 11.88 | 6, 71.4 | < 0.001 |
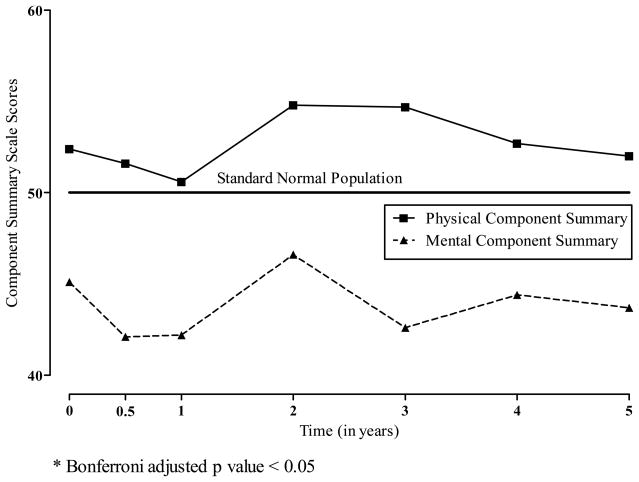
The component summary scales derived from the SF-36v2 showed no effect on generic health following ITA (see Figure 2). ITA recipients were physically healthier (PCS) than the standard United States population and less healthy emotionally, as measured by the MCS. On average, pre-transplant and evaluation MCS scores were approximately one-half standard deviation below the United States standard population mean. The PCS and MCS scores remain relatively stable from the pretransplant evaluation through the first 5 years following ITA.
Figure 2.
Least Squares Means for SF-36 Component Summary Scale Scores According to the Years Following Allogeneic Islet Transplantation.
* Bonferroni adjusted p value < 0.05
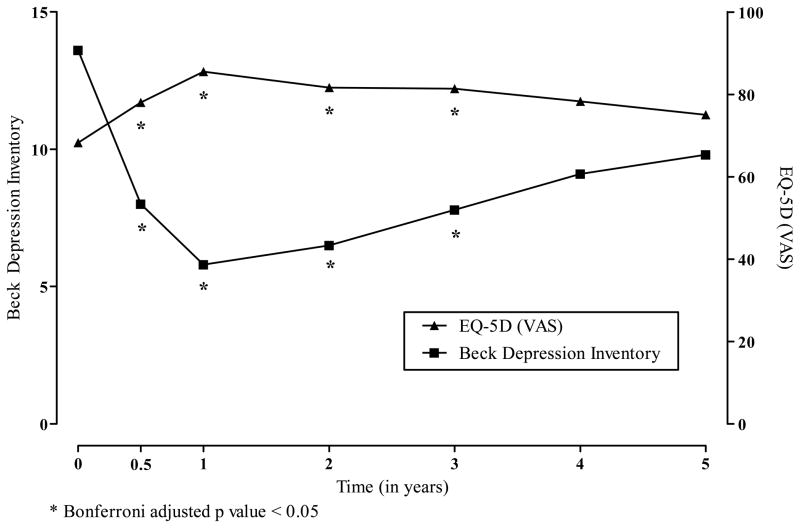
The visual analogue scale version of the EQ-5D showed improved HRQoL post-transplant over pretransplant evaluation (see Figure 3). There were Bonferroni adjusted statistical differences in the change scores at 6-months, 1-year, 2-year and 3-years. Depression as measured by the BDI-II was reduced following transplant with Bonferroni adjusted statistical differences in the change scores at 1-year, 2-years and 3-years.
Figure 3.
Least Squares Means for Beck Depression Inventory and the EuroQol 5D According to the Years Following Allogeneic Islet Transplantation.
* Bonferroni adjusted p value < 0.05
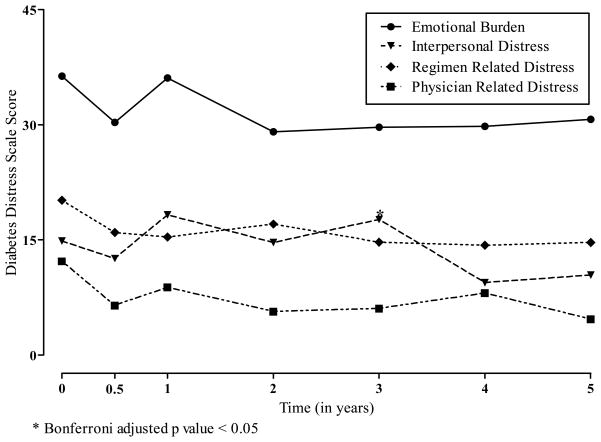
Figure 4 shows the least squares means for the 4 subscales comprising the Diabetes Distress Scale. There were no statistical differences in the LS means for any of the scales with time following ITA.
Figure 4.
Least Squares Means for Diabetes Distress Scales According to the Years Following Allogeneic Islet Transplantation.
* Bonferroni adjusted p value < 0.05
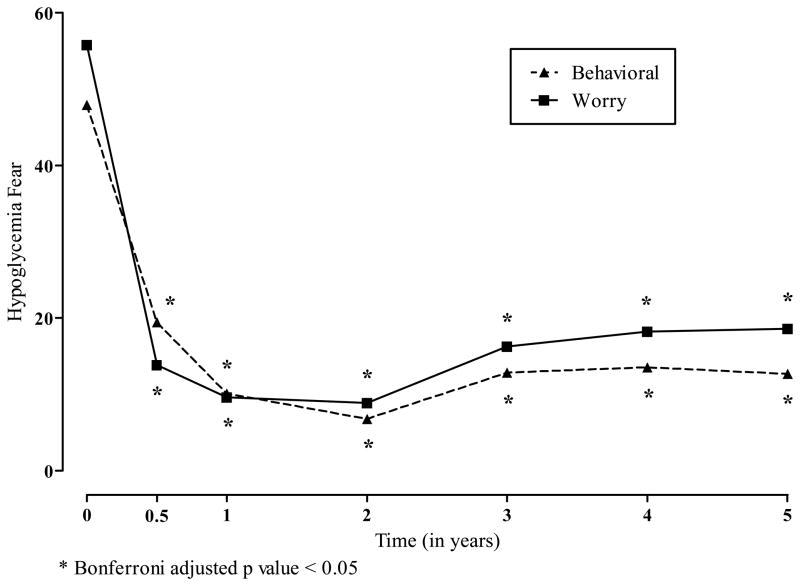
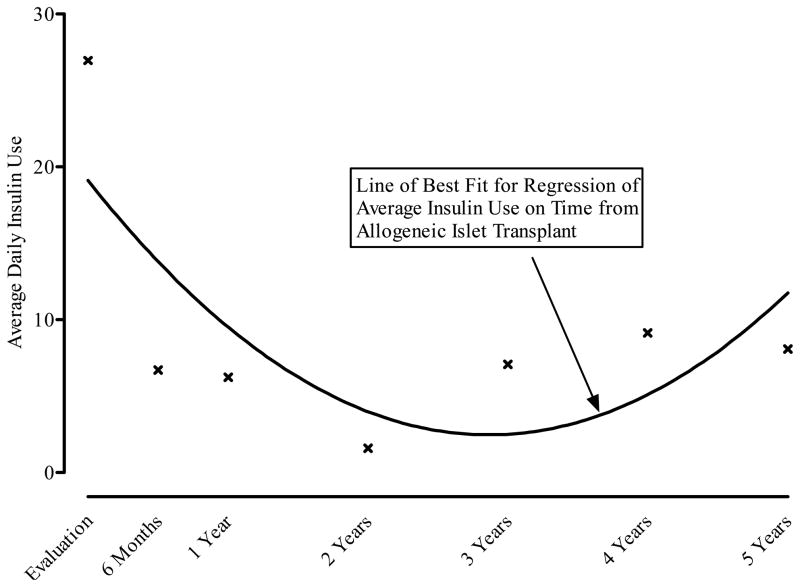
Overall, the greatest effects of ITA were observed for the reduction in hypoglycemia fear. Both the behavior and worry subscale scores on the HFS were statistically significantly reduced from pretransplant evaluation at all time points through 5 years posttransplant (see Figure 5). Changes in the Hypoglycemia Fear scales tracked closely with insulin use with time after allogeneic islet transplant (see Figure 6). Using the mean insulin levels for each window period, hypoglycemia fear drops between the time of evaluation and the first 2 years after ITA. With increased insulin use among some patients, mean HFS scores rise slightly. Insulin use (not shown) was directly related to HFS scores.
Figure 5.
Least Squares Means for Hypoglycemia Fear According to the Years Following Allogeneic Islet Transplantation.
* Bonferroni adjusted p value < 0.05
Figure 6.
Average Daily Insulin Use (Units/Day) According to Years Following Allogeneic Islet Transplant.
Discussion
The results of our study support the effectiveness of islet transplantation beyond the physiological and biochemical changes that are already reported in the literature. Using generic HRQoL measures in combination with diabetes-specific measures, we found that allogeneic islet transplant recipients generally perceived improvement in their health, a reduction in depressive symptoms, and attenuation in hypoglycemia fear.
Most important, ITA was strongly associated with changes in the behavior and worry of hypoglycemia fear posttransplant compared with pretransplant evaluation. This effect was sustained for 5 years following ITA – a particularly encouraging finding given that hypoglycemia unawareness is the principal indication for islet transplant. The effect sizes that we reported should guide researchers in designing future studies that include these measures.
Our current study did not observe similar improvements in the distress associated with diabetes management, as measured by the DDS. Emotional burden, physician related distress, regimen-related distress and interpersonal distress remained unchanged. These findings deserve further investigation. One possibility is that the need for ongoing immunosuppressive therapy posttransplant attenuates the potential impact of ITA on these measures. However, by most any criterion, the magnitude of effects we observed for the diabetes-specific measures was noteworthy and warrants reconfirmation in other study populations.
Little has been written about the responsiveness of diabetes-specific measures in the ITA population. Investigators seeking to validate the effectiveness of ITA would be advised to use a breadth of measures incorporated into this evaluation. Based on our experience, the HFS proved most responsive to the documented clinical changes. While generic HRQoL measures, such as the SF-36 and EuroQol, provide a more holistic picture of the patient, they lack the requisite psychometric properties for serving as a primary end-point for health outcomes research.
Responses to the SF-36 support the perception that individuals considered for islet transplantation are physically healthy, but face similar emotional challenges as others T1DM. Our study found MCS scale scores typical of individuals with diabetes in the United States [18]. None of the 8 subscales (not reported) underlying the component summaries supported health improvement for these recipients.
HRQoL as measured by the EQ-5D improved over the pretransplant evaluation score with statistically differences found at 1 year, 2 years and 3 years following ITA. These findings are encouraging for future studies designed to evaluate the cost benefits of allogeneic islet transplant over competing therapies. Our evidence supports the responsiveness of the EQ-5D as a potential measure of quality-adjusted life-years (QALY) in this population. Future ITA studies would do well to incorporate reliable and responsive QALY measures to assess the benefits gained by this therapy.
Our results are limited by the fact that our study population consisted of a panel of islet transplant candidates and recipients. Although ITA recipients were followed prospectively, it lacked an intact prospective cohort containing the transplant candidates. In addition, ITA recipients were often on the waitlist for some time prior to transplant, without any additional “pretransplant assessments” between screening and the time of transplant. Differences across our time points could be overstated because of selection or screening biases. However, the transplant candidates and transplant recipients were remarkably similar demographically and clinically.
The patient-based health assessments were not completed at every time point by each ITA recipient, but follow-up was completed for over three-quarters of the window periods. For handling the few missing data, we used mixed model methods (instead of general least squares regression) in the analysis. Mixed model methods are especially robust in handling problems with missing data and take into account the correlated nature of the panel and cohort data. This is critical in health outcomes research because of the tendency to overstate type 1 error when least squares regression is used.
Our study does provide useful guideposts for planning future islet transplant studies, which would be well advised to use a combination of generic and disease-targeted measures. Clearly generic measures, such as the SF-36 and EQ-5D, have a central role in evaluating the effects of a new procedure: they provide critical information necessary for evaluating the benefits in economic terms and a common metric for comparing a new procedure with existing therapy. This is especially the case when there are competing therapies from which to choose and the investigator wishes to make comparisons with individuals having other chronic conditions. However, their major limitation remains an inability to distinguish subtle health status differences between treatment options. Studies of treatment differences and comparisons with pancreas transplant recipients and patients on intensive insulin therapy are essential before islet transplants can be transitioned from clinical research to clinical care.
Disease-specific measures, such as the HFS and the DDS, are useful adjuncts to generic health status measures. Incorporation of such measures into future islet transplant studies would greatly deflect criticisms that patient reported outcomes lack clinical credibility and of randomized controlled trials that lack adequate statistical power from few events. The marked reduction in hypoglycemia fear that our study found associated with time posttransplant provides strong evidence for the effectiveness of allogeneic islet transplant for T1DM patients with hypoglycemia fear and a history of life threatening hypoglycemic episodes.
Acknowledgments
The study was supported by grants from the National Institutes of Health (National Institute for Diabetes, Digestive and Kidney Diseases, DK56963, the Juvenile Diabetes Research Foundation (JDRF #4-1999-841) and Novartis.
Footnotes
Disclosure
The authors of the manuscript have no conflicts of interest to disclose as described by the American Journal of Transplant.
D. M. Radosevich – No conflicts of interest to disclose as described by the American Journal of Transplant
R. Jevne – No conflicts of interest to disclose as described by the American Journal of Transplant
M. Bellin – No conflicts of interest to disclose as described by the American Journal of Transplant
R. Kandaswamy – The author has conflicts of interest to disclose as described by the American Journal of Transplantation. Dr. Kandaswamy has the following commercial interests: Roche –grant/research support; Novartis – grant/research support; Wyeth – grant/research support; Astellas – grant/research support; Roche – Speaker’s Bureau; and Genzyme – grant/research support.
D. E. R. Sutherland – No conflicts of interest to disclose as described by the American Journal of Transplant
B. J. Hering – No conflicts of interest to disclose as described by the American Journal of Transplant
References
- 1.Pileggi A, Alejandro R, Rirordi C. Clinical islet transplantation. Minerva Endrocrinologica. 2006;31:219–232. [PubMed] [Google Scholar]
- 2.Ryan EA, Bigam D, Sharpiro AMJ. Current indications for pancreas or islet transplant. Diabetes, Obesity and Metabolism. 2005;8:1–7. doi: 10.1111/j.1463-1326.2004.00460.x. [DOI] [PubMed] [Google Scholar]
- 3.Hering BJ, Kandaswamy R, Harmon JV, Ansite JD, Clemmings SM, Sakai T, et al. Transplantation of cultured islets from two-layer preserved pancreases in type 1 diabetes with anti-CD3 antibody. American Journal of Transplantation. 2004;4:390–401. doi: 10.1046/j.1600-6143.2003.00351.x. [DOI] [PubMed] [Google Scholar]
- 4.Hering BJ, Kandaswamy R, Ansite JD, Eckman PM, Nakano M, Sawada T, et al. Single-donor, marginal-dose islet transplantation in patients with type 1 diabetes. Journal of the American Medical Association. 2005;293(7):830–5. doi: 10.1001/jama.293.7.830. [DOI] [PubMed] [Google Scholar]
- 5.Sharpiro AMJ, Lakey JRT, Ryan EA, Korbutt GS, Toth E, Warnock GL, et al. Islet transplantation in seven patients with type 1 diabetes mellitus using a glucocorticois-free immunosuppressive regimen. The New England Journal of Medicine. 2000;243(4):230–8. doi: 10.1056/NEJM200007273430401. [DOI] [PubMed] [Google Scholar]
- 6.Bellin MD, Kandaswamy R, Parkey J, Zhang HJ, Liu B, Ihm SH, et al. Prolonged insulin independence after islet allotransplants in recipients with type 1 diabetes. American Journal of Transplantation. 2008;8(11):2463–70. doi: 10.1111/j.1600-6143.2008.02404.x. [DOI] [PMC free article] [PubMed] [Google Scholar]
- 7.Froud T, Ricordi C, Baidal DA, Hafiz MM, Ponte G, Cure P, et al. Islet transplantation in type 1 diabetes mellitus using cultured islets and steroid-free immunosuppression: Miami experience. American Journal of Transplantation. 2005;5(8):2037–46. doi: 10.1111/j.1600-6143.2005.00957.x. [DOI] [PubMed] [Google Scholar]
- 8.Badet L, Benhamou PY, Wojtusciszyn A, Baertschiger R, Milliat-Guittard L, Kessler L. Expectations and strategies regarding islet transplantation: metabolic data from the GRAGIL 2 trial. Transplantation. 2007;15(84):89–96. doi: 10.1097/01.tp.0000268511.64428.d8. [DOI] [PubMed] [Google Scholar]
- 9.Gangemi A, Salehi P, Hatipoglu B, Martellotto J, Barbaro B, Kuechle JB, et al. Islet transplantation for brittle type 1 diabetes: the UIC protocol. American Journal of Transplantation. 2008;8(6):1250–61. doi: 10.1111/j.1600-6143.2008.02234.x. [DOI] [PubMed] [Google Scholar]
- 10.Ryan EA, Paty BW, Senior PA, Bigam D, Alfadhli E, Kneteman NM, et al. Five-year follow-up after clinical islet transplantation. Diabetes. 2005;54:2060–9. doi: 10.2337/diabetes.54.7.2060. [DOI] [PubMed] [Google Scholar]
- 11.Johnson JA, Kotovych M, Ryan EA, Sharpiro AMJ. Reduced fear of hypoglycemia in successful islet transplantation. Diabetes Care. 2004;27(2):624–5. doi: 10.2337/diacare.27.2.624. [DOI] [PubMed] [Google Scholar]
- 12.Cox DJ, Irvine A, Gonder-Frederick L, Nowacek G, Butterfield J. Fear of hypoglycemia: quantification, validation, and utilization. Diabetes Care. 1987;10(5):617–21. doi: 10.2337/diacare.10.5.617. [DOI] [PubMed] [Google Scholar]
- 13.Irvine A, Cox DJ, Gonder-Frederick L. The fear of hypoglycemia: quantification, validation, and utilization. In: Bradley D, editor. Handbook of Psychology and Diabetes. Amsterdam: Hardwood Academic; 1994. pp. 133–55. [Google Scholar]
- 14.Toso C, Sharpiro AMJ, Bowker S, Dinyari P, Paty B, Ryan EA, et al. Quality of life after islet transplant: Impact of the number of islet infusions and metabolic outcomes. Transplantation. 2007;84(5):664–6. doi: 10.1097/01.tp.0000280550.01028.89. [DOI] [PubMed] [Google Scholar]
- 15.Barshes NR, Vanatta JM, Mote A, Lee TC, Schock AP, Balkrishnan R, et al. Health-related quality of life after pancreatic islet transplantation: A longitudinal study. Transplantation. 2005;79(12):1727–30. doi: 10.1097/01.tp.0000160816.21799.f5. [DOI] [PubMed] [Google Scholar]
- 16.Brooks R, Rabin R, Charro Fd. The measurement and valuation of health status using EQ-5D: A European perspective (Evidence from the EuroQol BIOMED Research programme) Dordrecht, The Netherlands: Kluwer Academic Publishers; 2003. [Google Scholar]
- 17.Ware JE, Kosinski M, Bayliss MS, McHorney CA, Rogers WH, Raczek A. Comparison of Methods for the Scoring and Statistical Analysis of the SF-36 Health Profile and Summary Measures: Summary of Results from the Medical Outcomes Study. Medical Care. 1995;33(4):AS264–AS79. [PubMed] [Google Scholar]
- 18.Ware JE, Kosinski M, Dewey JE. How to score Version 2 of the SF-36 Health Survey. Lincoln, RI: QualityMetric Incorporated; 2000. [Google Scholar]
- 19.Ware JE, Kosinski M, Keller SD. SF-36 Physical and Mental Health Summary Scales: A User’s Manual. Boston: The Health Institute; 1994. [Google Scholar]
- 20.Ware JE, Kosinski M, Turner-Bowker DM, Gandek B. How to score the Version 2 of the SF-12 Health Survey. Lincoln, RI and Boston, MA: QualityMetric Incorporated and Health Assessment Lab; 2002. [Google Scholar]
- 21.Ware JE, Sherbourne CD. The MOS 36-Item Short-Form Health Survey (SF-36) Medical Care. 1992;30(6):473–83. [PubMed] [Google Scholar]
- 22.Ware JE, Snow KK, Kosinski M, Gandek B. SF-36 Health Survey: Manual and Interpretation Guide. Boston: The Health Institute, New England Medical Center; 1993. [Google Scholar]
- 23.Johnson JA, Luo N, Shaw JW, Kind P, Coons SJ. Valuations of the EQ-5D health states: Are the United States and United Kingdom different? Medical Care. 2005;43(3):221–8. doi: 10.1097/00005650-200503000-00004. [DOI] [PubMed] [Google Scholar]
- 24.Shaw JW, Johnson JA, Coons SJ. US Valuation of the EQ-5D health states development and testing of the D1 Valuation Model. Medical Care. 2005;43(3):203–20. doi: 10.1097/00005650-200503000-00003. [DOI] [PubMed] [Google Scholar]
- 25.Beck AT, Ward CH, Mendelson M, Mock J, Erbaugh J. An inventory for measuring depression. Archives of General Psychiatry. 1961;4:561–71. doi: 10.1001/archpsyc.1961.01710120031004. [DOI] [PubMed] [Google Scholar]
- 26.Groth-Marnat G. The handbook of psychological assessment. New York: John Wiley and Sons; 1990. [Google Scholar]
- 27.Polansky WH, Anderson BJ, Lohrer PA, Welch G, Jacobson AM, Aponte JE. Assessment of diabetes-related distress diabetes. Care. 1995;18(6):754–60. doi: 10.2337/diacare.18.6.754. [DOI] [PubMed] [Google Scholar]
- 28.Polonsky WH, Fisher L, Earles J, Dudl R, James, Lees J, Mullan JA, et al. Assessing psychosocial distress in diabetes. Diabetes Care. 2005;28(3):626–31. doi: 10.2337/diacare.28.3.626. [DOI] [PubMed] [Google Scholar]
- 29.Welch GW, Jacobson AM, Polansky WH. The Problem Areas in Diabetes Scale. An evaluation of its clinical utility. Diabetes Care. 1997;20(5):760–6. doi: 10.2337/diacare.20.5.760. [DOI] [PubMed] [Google Scholar]
- 30.Littell RC, Milliken GA, Stroup WW, Wolfinger RD. System for mixed models. Cary, NC: SAS Institute, Inc; 1996. [Google Scholar]
- 31.Murray DM. Design and analysis of group-randomized trials. New York: Oxford University Press; 1998. [Google Scholar]
- 32.Bender R, Lange S. Adjusting for multiple testing - when and how? Journal of Clinical Epidemiology. 2001;54:343–9. doi: 10.1016/s0895-4356(00)00314-0. [DOI] [PubMed] [Google Scholar]
- 33.Savitz DA, Olshan AF. Multiple comparisons and related issues in the interpretation of epidemiologic data. American Journal of Epidemiology. 1995;142(9):904–8. doi: 10.1093/oxfordjournals.aje.a117737. [DOI] [PubMed] [Google Scholar]
- 34.Jaccard J, Wan CK. LISREL approaches to interaction effects in multiple regression. Thousand Oaks, CA: Sage Publications, Inc; 1996. [Google Scholar]


