

Abstract
The M2 proton channel of influenza A is the target of the antiviral drugs amantadine and rimantadine, whose effectiveness has been abolished by a single-site mutation of Ser31 to Asn in the transmembrane domain of the protein. Recent high-resolution structures of the M2 transmembrane domain obtained from detergent-solubilized protein in solution and crystal environments gave conflicting drug binding sites. We present magic-angle-spinning solid-state NMR results of Ser31 and a number of other residues in the M2 transmembrane peptide (M2TMP) bound to lipid bilayers. Comparison of the spectra of the membrane-bound apo and complexed M2TMP indicates that Ser31 is the site of the largest chemical shift perturbation by amantadine. The chemical shift constraints lead to a monomer structure with a small kink of the helical axis at Gly34. A tetramer model is then constructed using the helix tilt angle and several interhelical distances previously measured on unoriented bilayer samples. This tetramer model differs from the solution and crystal structures in terms of the openness of the N-terminus of the channel, the constriction at Ser31, and the sidechain conformations of Trp41, a residue important for channel gating. Moreover, the tetramer model suggests that Ser31 may interact with amantadine amine via hydrogen bonding. While the apo and drug-bound M2TMP have similar average structures, the complexed peptide has much narrower linewidths at physiological temperature, indicating drug-induced changes of the protein dynamics in the membrane. Further, at low temperature, several residues show narrower lines in the complexed peptide than the apo peptide, indicating that amantadine binding reduces the conformational heterogeneity of specific residues. The differences of the current solid-state NMR structure of the bilayer-bound M2TMP from the detergent-based M2 structures suggest that the M2 conformation is sensitive to the environment, and care must be taken when interpreting structural findings from non-bilayer samples.
Keywords: influenza M2 proton channel, solid-state NMR, chemical shifts, magic-angle spinning, amantadine
Introduction
The M2 protein of influenza A virus forms a tetrameric proton channel that is the target of the antiviral drugs amantadine and rimantadine 1. The drugs were effective until recently, when a single-site mutation of S31N in the transmembrane domain of the protein caused complete resistance of the viruses to the drugs 2. The M2 proton channel is important for viral replication. After the virus enters the infected cell by endocytosis, the proton channel acidifies the viral core, which triggers the dissociation of the virus matrix and subsequent viral gene expression 3. With 97 amino acids, the M2 protein is small compared to typical ion channels, thus it is an excellent system for elucidating the structure-function relationship of ion channels. Extensive mutagenesis, electrophysiological 4; 5 and sedimentation experiments 6 have been carried out to determine the low-resolution structure and stability of this proton channel. Elucidating the high-resolution structure and the difference between the drug-free and drug-bound states is the next natural challenge that is important not only for developing new inhibitors to curb influenza infection but also for understanding the fundamental biophysics of ion channels.
The transmembrane domain of the M2 protein spanning residues 22 to 46 (Figure 1a) contains a histidine and a tryptophan that are crucial for proton conduction and gating 7; 8. This domain exhibits channel activity 9 and forms a parallel four-helix bundle with left-handed crossing angles. The residues facing the channel lumen versus the lipids have been identified through experiments probing the effects of mutation on proton currents and amantadine inhibition 10. The main channel-facing residues, V27, A30, G34 and H37, fall onto the a and d positions of a heptad repeat (Figure 1b). The b, c, and f positions of the heptad repeat face the lipids, while the e and g positions occupy the helix-helix interfaces. Apart from the transmembrane domain, the segment of the protein spanning residues 44–60 forms a membrane-proximal amphipathic helix that is important for channel stability 11 and is recently found to be involved in pH activation 12.
Figure 1.

M2(22–46) sequence and its representation as a heptad repeat. (a) Amino acid sequence. The a and d residues of the heptad repeat abcdefg are labeled. The 13C, 15N-labeled residues that have been studied so far 19 are colored in red. H37 and W41, which are central for proton conduction and channel gating, are shown in blue. (b) Four-helix bundle organization of M2TMP. Channel-facing a and d residues are shaded in pink, and interfacial e and g residues are shaded in cyan.
Recently, two high-resolution structures of portions of the M2 protein containing the transmembrane domain were reported simultaneously 13; 14. One structure was obtained by X-ray crystallography and the other by solution NMR. The X-ray structure was determined on amantadine-bound M2(22–46) in the detergent octyl-βD-glucopyranoside (OG) 14. The solution NMR structure was determined on rimantadine-bound M2(18–60) solubilized in DHPC micelles 13. Strikingly, the two structures showed very different drug binding sites: the solution NMR structure showed rimantadine to be bound at the helix-helix interfaces of the tetramer near the C-terminus of the transmembrane domain, while the crystal structure showed amantadine bound to the channel lumen near the N-terminus. In addition, the helix orientation and the sidechain conformations of the two structures differ substantially 15.
These structural differences underscore the importance of examining the M2 transmembrane peptide structure using an independent technique and doing so in the most biologically relevant environment of lipid bilayers. Detergent micelles are known to cause curvature stress to membrane proteins and have been documented to affect the structure of proteins compared to bilayer-bound samples 16. Similarly, crystallizing hydrophobic membrane proteins in a sparse matrix of detergent molecules leaves open the question of how different the structure is from the bilayer-bound state. For these reasons, solid-state NMR (SSNMR) spectroscopy, which can be readily applied to lipid bilayers and other semi-solids, is the preferred method for determining the high-resolution structures of membrane proteins.
Until recently, the majority of SSNMR data on the M2 transmembrane peptide (M2TMP) consisted of static 15N chemical shift anisotropies and N-H dipolar couplings measured on uniaxially aligned membrane samples. These data yielded very precise orientation angles of the M2TMP helices in the lipid bilayer 17; 18. However, the 15N NMR constraints do not report the sidechain conformation nor the interhelical packing of the tetramer. Further, information on the backbone structure is only inferred by pattern recognition of the 2D N-H dipolar and 15N chemical shift correlation spectra.
We recently undertook a magic-angle-spinning (MAS) SSNMR study of the structure and dynamics of M2(22–46) in lipid bilayers. Several types of structural information have been obtained so far. First, isotropic 13C and 15N chemical shifts of eight residues in the transmembrane domain (L26, V27, A29, A30, I33, G34, I35, and L38) were measured and compared between the apo and amantadine-complexed states 19 to determine structure perturbation by the drug. Second, ϕ, ψ and χ1 torsion angles were directly measured at selected residues by dipolar correlation experiments to quantify the peptide conformation. Third, we measured the helix orientations using unoriented membrane samples and found small differences between the apo and drug-bound peptide, as well as different tilt angles in lipid bilayers of different thicknesses 20; 21. Fourth, the peptide dynamics were probed by 2H quadrupole NMR and various dipolar coupling and chemical shift anisotropy measurements, and were found to be dramatically altered by drug binding 20. Finally, we measured interhelical distances at V27, A30, L38, and W41 using 19F-labeled M2TMP to constrain the helix packing in the tetrameric bundle 22; 23. These SSNMR results were obtained from M2TMP bound to hydrated and unoriented DLPC, DMPC or POPC membranes, which are more natural environments for membrane proteins than detergents.
In this work, we report the chemical shifts of Ser31, Val28 and Leu36, and propose a backbone structural model of M2TMP using all SSNMR constraints obtained so far. Ser31 has been postulated to be the main residue involved in amantadine binding. MD simulations suggested that the Ser31 hydroxyl group forms hydrogen bonds with the amantadine amine 24. This was supported by neutron diffraction experiments that showed amantadine to be positioned between Val27 and Ser31 25. Mutation of Ser31 to Asn gives rise to the main drug-resistant mutant in current influenza A viruses. Thus, knowledge of Ser31 conformation in M2TMP is important for understanding how amantadine blocks the channel. The availability of chemical shifts for a contiguous segment of the peptide allows us to deduce the (ϕ, ψ) torsion angles of the protein using the well established relation between protein conformation and NMR chemical shifts 26. From this chemical shift constrained monomer structure, we constructed a tetramer model of the transmembrane domain using several interhelical distances measured previously. We compare this MAS-NMR model with the solution NMR, X-ray, and 15N orientation-NMR structures, and suggest the binding site of amantadine.
Results
13C chemical shifts of VSL-M2TMP without and with amantadine
Figure 2 shows the lipid-suppressed 13C MAS spectra of V28, S31, L36-labeled M2TMP without (a, c) and with amantadine (b, d). The lipid background signals were suppressed by a 13C-13C DQ filter in (a, b) and a 15N-13C heteronuclear dipolar filter in (c, d). For the N-C filtered spectra, only the directly bonded Cα signals are selected due to the short N-C recoupling time used. All spectra were measured at 243 K, in the gel phase of the membrane.
Figure 2.

1D 13C spectra of VSL-M2TMP in DLPC bilayers at 243 K. (a) 13C DQF spectrum of the apo peptide. (b) 13C DQF spectrum of the amantadine-bound peptide. (c) 15N-filtered 13C spectrum of the apo peptide. (d) 15N-filtered 13C spectrum of the amantadine-bound peptide.
The main 13C chemical shift difference caused by amantadine occurs at S31 Cα and Cβ: the two sites overlap completely in the apo-M2TMP spectrum (a) but become partly resolved in the amantadine-complexed spectrum (b). In addition, the 15N-13C filtered spectra in (c, d) show a narrower S31 Cα peak for the complexed peptide than the apo peptide. At low temperature where peptide motion is frozen, NMR linewidths reflect conformational distribution. Thus, the narrower Cα line of the complexed peptide indicates reduced conformational heterogeneity at S31 upon drug binding (see below).
Figure 3 shows the 2D 13C-13C DQF-COSY spectra to illustrate the unambiguous assignment of the 13C chemical shifts. The 2D spectra further illustrate the striking difference of S31 chemical shifts between the apo- and amantadine-complexed M2TMP: while the apo peptide does not resolve the S31 Cα and Cβ peaks near 61 ppm, the complexed peptide shows clear off-diagonal intensities indicative of chemical shift separation between Cα and Cβ (b). On the other hand, the S31 Cβ/CO cross peaks are unchanged by amantadine (c). Since protein secondary structures give opposite-signed secondary shifts between Cβ on one hand and Cα and CO on the other, the absence of opposite Cα and CO shift changes from the Cβ shift change suggests that the cause for the Cβ change is packing interaction with amantadine rather than (ϕ, ψ) angle changes of the S31 backbone.
Figure 3.

2D 13C-13C DQF correlation spectra of VSL-M2TMP in DLPC bilayers at 243 K without (black) and with (red) amantadine. (a) Aliphatic region. (b) S31 and V28 region. (c) Carbonyl region.
To confirm the S31 Cβ chemical shift, we carried out a 1D CH2-spectral editing experiment. The experiment selectively detects CH2 groups such as Ser Cβ while suppressing the signals of all CH groups such as backbone Cα’s. Figure 4 compares the CH2-edited spectra (b, d) with the 13C CP spectra (a, c) of the apo and complexed M2TMP. The unfiltered spectra contain all labeled peptide 13C signals as well as natural abundance lipid 13C signals; thus they are less resolved than Figure 2. The CH2 filter suppressed the V28 and L36 Cα signals but retained S31 Cβ, L36 Cβ, and the main lipid CH2 peaks. The method does not completely suppress the mobile CH3 groups, however their chemical shifts do not overlap with Ser Cβ. The CH2-edited spectra of the apo and complexed peptide (b, d) confirm the 1.0 ppm upfield shift of the S31 Cβ peak upon amantadine binding.
Figure 4.

Selective detection of S31 Cβ by CH2 editing. (a) 13C CP-MAS spectrum of apo-M2TMP. (b) CH2 edited spectrum of apo-M2TMP. (c) 13C CP-MAS spectrum of amantadine-bound M2TMP. (d) CH2 edited spectrum of bound M2TMP. Note the suppression of the Cα CH peaks in (b) and (d).
In addition to S31, V28 Cα and CO show significant chemical shift changes in the 2D spectra (Figure 3c). The CO frequency increased by 1.4 ppm while the Cα chemical shift increased by 0.7 ppm (Table 1). These downfield shift changes are consistent with a more ideal helical conformation in the presence of amantadine. Moreover, the CO chemical shift is sensitive to hydrogen bonding 27; thus the larger increase of the CO chemical shift over Cα suggests that amantadine may perturb the hydrogen-bond network around V28.
Table 1.
13C and 15N chemical shifts (ppm) of M2TMP in DLPC bilayers at 243 K without and with amantadine (Amt). Sites with chemical shift differences greater than 0.5 ppm are bolded. Letters s, m and w denote strong, medium and weak, respectively. The 13C and 15N shifts are referenced to TMS and liquid NH3, respectively.
| N | CO | Cα | Cβ | Cγ | Cδ | Cε | ||
|---|---|---|---|---|---|---|---|---|
| L26 | apo | 117.7 | 176.6 | 55.5 | 39.1 | 25.2 | 23.8 | 21.2 |
| Amt | 117.5 | 176.3 | 55.7 | 39.4 | 25.2 | 23.3 | 20.9 | |
|
| ||||||||
| V27 | Apo | 120.4 | 177.8 | 63.8 | 29.7 | 21.2 | 19.3 | |
| Amt | 119.9 | 178.1 | 63.9s 62.0w |
30.0 | 20.8 | 19.5 | ||
|
| ||||||||
| V28 | Apo | 122.8 | 175.9 | 64.8 | 29.7 | 20.7 | 19.5 | |
| Amt | 125.9 | 177.0 | 65.4 | 29.7 | 20.8 | 19.0 | ||
|
| ||||||||
| A29 | Apo | 120.9 | 176.7 | 53.5 | 16.6 | |||
| Amt | 121.7 | 176.8 | 53.5 | 16.3 | ||||
|
| ||||||||
| A30 | Apo | 118.0w 119.4 |
177.7 | 52.8 | 16.5 | |||
| Amt | 118.7 | 177.5 | 52.8 | 17.0 | ||||
|
| ||||||||
| S31 | Apo | 114.7 | 173.7 | 61.2 | 60.8 | |||
| Amt | 121.4 | 173.1 | 61.3 | 59.8 | ||||
|
| ||||||||
| I33 | Apo | 120.3 | 175.7 | 63.1 | 35.4 | 28.5 | 15.7 14.9 |
11.8 |
| Amt | 119.4 | 176.0 | 63.2 | 35.4 | 28.3 | 16.0 | 12.0 | |
|
| ||||||||
| G34 | Apo | 107.1 | 173.0 | 45.7 | ||||
| Amt1 | 106.3 | 173.2 | 45.5 | |||||
| Amt2 | 109.7 | 175.0 | 45.0 | |||||
|
| ||||||||
| I35 | Apo | 122.3 | 175.5 | 63.9 | 35.7 | 28.1 | 15.7 | 11.7 |
| Amt | 124.6 | 175.4 | 63.8 | 35.8 | 27.3 | 15.6 | 11.6 | |
|
| ||||||||
| L36 | Apo | 119.9 | 175.8 | 56.0 | 39.4 | 24.9 | 24.2 | 21.2 |
| Amt | 119.6 | 175.3 | 55.8 | 39.5 | 24.7 | 23.8 | 21.2 | |
|
| ||||||||
| L38 | apo | 117.8 | 175.8 | 56.1 | 37.5w 39.5s |
25.0 | 24.2 | 20.1 |
| Amt | 117.1 | 175.8 | 56.0 | 37.4m 39.6s |
24.9 | 23.9 | 21.0 | |
15N chemical shifts of VSL-M2TMP without and with amantadine
Low-temperature 1D 15N MAS spectra of the apo and complexed VSL-M2TMP are shown in Figure 5. The assignment of the 15N peaks is based on 2D 15N-13C correlation spectra shown in Figure 6 below. Both the 15N chemical shifts and 15N linewidths show dramatic changes upon amantadine binding. The V28 and S31 15N peaks move downfield, and all three sites are narrowed by a factor of two. The drug-complexed peptide has FWHM of 2.0 ppm for all three sites, while the apo peptide linewidths range from 3.5 – 5.3 ppm (Table 2).
Figure 5.

1D 15N CP-MAS spectra of VSL-M2TMP in DLPC bilayers at 243 K. (a) Without amantadine. (b) With amantadine.
Figure 6.

(a) 2D 15N-13C 2D correlation spectrum of VSL-M2TMP in DLPC bilayers at 243 K. Black: without amantadine. Red: with amantadine. (b) S31 15N cross sections.
Table 2.
13C and 15N apparent (Δ*) and intrinsic linewidths (Δ) of VSL-M2TMP at 243 K under 71 kHz 1H decoupling. Significant linewidth changes between the apo and amantadine-bound samples are bolded.
| Residue | site | Δ*, apo (ppm) | Δ, apo (ppm) | Δ*, + Amt (ppm) | Δ + Amt (ppm) |
|---|---|---|---|---|---|
| V28 | N | 5.3 | - | 2.0 | - |
| Cα | 1.4 | 0.60 | 1.3 | 0.60 | |
| Cβ | 1.1 | 0.67 | 1.0 | 0.67 | |
| Cγ1 | 1.7 | 0.40 | 1.4 | 0.40 | |
| Cγ2 | 1.3 | 0.40 | 1.6 | 0.40 | |
| S31 | N | 3.5 | - | 2.0 | - |
| Cα | 1.5 | 0.60 | 0.93 | 0.60 | |
| Cβ | 2.8 | 0.57 | 1.6 | 0.57 | |
| L36 | N | 4.0 | - | 2.0 | - |
| Cα | 1.0 | 0.47 | 0.9 | 0.47 | |
| Cβ | 1.3 | 0.73 | 1.1 | 0.73 | |
| Cγ | 1.1 | 0.57 | 1.0 | 0.57 | |
| Cδ1 | 1.9 | 0.40 | 1.7 | 0.40 | |
| Cδ2 | 1.4 | 0.40 | 1.4 | 0.40 |
2D 15N-13C correlation spectra are shown in Figure 6 to provide definitive evidence of structure perturbation by amantadine. Consistent with the 13C data, the most pronounced 15N chemical shift change occurs at S31 (6.7 ppm), followed by V28, which has a more modest but still significant 15N shift increase of 3.1 ppm. Similar to the 13C data, L36 exhibits little change in its 15N chemical shift.
Chemical shift perturbation at the M2TMP core
Table 1 summarizes all 13C and 15N chemical shifts measured for eleven residues, including L26, V27, V28, A29, A30, S31, I33, G34, I35, L36, and L38. This table extends the one recently reported 19 by the addition of V28, S31 and L36 chemical shifts, the addition of carbonyl chemical shifts for all residues, and the more accurately measured sidechain methyl chemical shifts 28. Figure 7a plots the average chemical shift change per residue due to amantadine binding:
where n is the number of chemical shift values available in each residue. Both the 13C and 15N chemical shifts are included, and the absolute value of the chemical shift difference is summed to avoid cancellation of positive and negative shift changes. Figure 7a shows three distinct local maxima of chemical shift perturbation: S31, G34 and V28, with average chemical shift changes of 2.1 ppm, 1.1 ppm, and 0.9 ppm, respectively.
Figure 7.

Amantadine-induced changes of M2TMP structure and dynamics in DLPC bilayers. (a) Average isotropic chemical shift changes for each residue, measured at low temperature. (b) Average 13C T2 changes, measured at 303 K.
Conformational distributions at V28, S31 and L36
While isotropic chemical shifts report the average conformation, linewidths of frozen proteins indicate the conformational distribution. Apparent linewidths (Δ*) directly read off from the spectra are indicative of conformational heterogeneity, while homogeneous linewidths (Δ) result from T2 relaxation, which is induced by microsecond-timescale molecular motions that modulate the nuclear spin interactions. The homogeneous linewidths can be measured using spin echo experiments and are related to T2 by Δ = 1/πT2. We extracted the 15N and 13C apparent linewidths from 2D 13C-13C and 15N-13C correlation spectra where all signals are resolved. Low temperature spectra are used since they capture all conformations present in the fluid membrane. Table 2 shows that the apparent linewidths of most sites in V28, S31 and L36 are similar between the apo and complexed peptide, with the exception of all amide 15N sites and S31 Cα and Cβ.
To obtain the 13C homogeneous linewidths, we measured the T2 relaxation times under a 1H decoupling field of 71 kHz. 1H-decoupled heteronuclear T2 is mainly sensitive to motions on the timescale of the inverse of the decoupling field, which is thus ~ 10 μs. Table 2 shows that the 13C homogeneous linewidths are identical between the apo and complexed peptide within experimental uncertainty, indicating that all peptide motion is frozen at 243 K and does not cause different relaxation between the apo and complexed states. Thus, the narrower Δ* of S31 in the complexed peptide must be attributed to reduced conformational heterogeneity due to drug binding.
Amantadine-induced changes of M2TMP dynamics
Complementing the low-temperature chemical shift and linewidth data, we measured the 13C spectra of M2TMP in the liquid-crystalline phase of the lipid bilayer to obtain information on the molecular motion of the protein. Previous data on eight other labeled residues found across-the-board line narrowing by amantadine at high temperature 19. This is now observed at V28, S31, and L36 as well. Figure 8 shows the 13C CP-MAS spectra of apo and complexed VSL-M2TMP in DLPC bilayers from 243 K to 313 K. At 243 K, the spectra show strong intensities characteristic of immobilized molecules for both the apo and complexed M2TMP. When the temperature increased to 283 K, near the phase transition temperature of the DLPC bilayer, the peak intensities decrease significantly for both samples, indicating intermediate-timescale motion. Increasing the temperature to the near-physiological 313 K partially recovered the intensities of both samples, but the amantadine-complexed peptide exhibits stronger CP intensities than the apo-peptide, especially for methylene groups such as L36 Cβ and S31 Cβ.
Figure 8.

1D 13C variable-temperature CP-MAS spectra of VSL-M2TMP bound to DLPC bilayers. (a) Without amantadine. (b) With amantadine. Temperatures from top to bottom are 313 K, 283 K and 243 K.
To probe fluid-phase dynamics of M2TMP, we measured the 13C T2 of the peptide at 303 K using the Hahn-echo experiment and compared them between the apo and complexed states. Table 3 shows that the 13C T2 values increase by 1.5 – 4.0 fold upon drug binding, consistent with what was observed at other residues 19. Plotting the fractional increase of the 13C T2 for the eleven residues as
Table 3.
13C homogeneous T2 (ms) of VSL-M2TMP at 303 K with 71 kHz 1H decoupling.
| Residue | site | T2, apo | T2, +Amt |
|---|---|---|---|
| V28 | Cα | 1.0 | 2.5 |
| Cγ1 | 3.0 | 5.6 | |
| Cγ2 | 2.6 | 4.7 | |
| S31 | Cα | 1.1 | 3.5 |
| Cβ | 3.8 | ||
| L36 | Cα | 1.0 | 3.6 |
| Cβ | 1.1 | 3.5 | |
| Cγ | 2.6 | 7.9 | |
| Cδ1 | 6.0 | 11.6 | |
| Cδ2 | 6.0 | - |
we find two local maxima, V27 and S31 (Figure 7b).
Dependence of M2 structural changes on amantadine concentration and specificity of the structure changes
The above amantadine-induced chemical shift changes were measured on membrane samples prepared from buffers containing 10 mM amantadine. 1H solution NMR analysis of the supernatant after the membrane is pelleted showed that the amount of amantadine bound to the membrane typically corresponded to a M2 : amantadine molar ratio of ~1 : 10. This is well in excess of the expected stoichiometric M2 : amantadine ratio, which is either 4 : 1 based on the crystal structure or 1: 1 based on the solution NMR structure. The use of excess amantadine is largely due to the concern that the lipophilic drug, which readily partitions into the lipid membrane from the aqueous solution 29; 30; 31, may not all end up in the channel. Nevertheless, the question arises as to whether the observed M2 chemical shift changes result from non-specific effects of amantadine on the lipid bilayer that then indirectly change the peptide structure, or whether it is due to direct amantadine-peptide interactions. To address this question, we prepared a VSL-M2TMP sample in DLPC bilayers with a much lower M2 : amantadine molar ratio of 1 : 2, by directly titrating a quantitative amount of amantadine solution into the M2 membrane pellet. The resulting 2D spectrum (Fig. 9c) shows that 70% of the S31 15N-13Cα peak has shifted to the bound position. The 30% remaining unshifted signal can be attributed to channels without amantadine, implying that some amantadine is dispersed in the rest of the lipid bilayer. The observation of the same chemical shift perturbation at much lower amantadine levels confirm that the structural changes we detect at high concentration result from direct drug-protein interactions rather than non-specific lipid-mediated effects.
Figure 9.
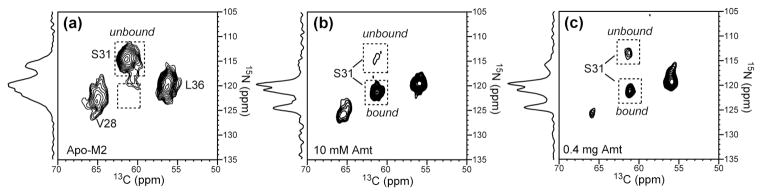
2D 15N-13C correlation spectra of VSL-M2TMP in DLPC bilayers with different amounts of amantadine. The S31 15N-13Cα cross peak is used to indicate the degree of amantadine binding. 1D 15N CP spectra are shown projected from the indirect dimension of each spectrum. (a) No amantadine. The S31 peak is completely in the unbound position. (b) Amantadine added at 10 mM in the buffer. The M2 : amantadine molar ratio in the final membrane is ~1 : 8. Almost all S31 intensities are at the bound position. (c) Amantadine directly titrated into the membrane pellet. The M2 : amantadine molar ratio in the final pellet is ~ 1 : 2. 70% of the S31 intensity is at the bound position.
A related question is whether amantadine causes the M2 13C T2 relaxation time changes (Figure 7b) by indirect and non-specific changes of the membrane dynamics. To answer this question, we prepared two DLPC samples without the M2 peptide. One sample does not contain amantadine and the other contains 10 mM amantadine in the buffer during vesicle formation. The 13C T2 relaxation times of the two DLPC samples were measured at 313 K by direct polarization Hahn echo experiments, in which identical 1H decoupling field strengths (30 kHz) were used to ensure that the motion is probed on the same timescale. Figure 10 shows the fractional T2 changes for all resolved DLPC carbon sites. It can be seen that all sites except the headgroup Cβ experience negligible T2 changes of less than ±10% upon amantadine binding. Moreover, most DLPC sites show a decrease of 13C T2, opposite to the trend for M2TMP. Thus, amantadine does not significantly impact the lipid dynamics, and the dynamic changes of M2TMP are specifically due to peptide-drug interactions.
Figure 10.

Fractional 13C T2 changes of DLPC lipid carbons upon amantadine binding at 313 K. No M2 peptide is present. The fractional change is calculated as .
Discussion
The goals of this study are two fold: obtain a chemical shift constrained backbone structure of M2TMP in the absence and presence of amantadine, and determine the size and nature of the drug-induced conformational change, particularly at Ser31. With the consolidation of the 13C and 15N chemical shifts for eleven consecutive residues in the core of the peptide, we can now use the TALOS program to predict the backbone torsion angles of the M2 peptide in the lipid bilayer.
Backbone structure of M2TMP monomer
The TALOS predicted (ϕ, ψ) torsion angles of M2TMP based on the 13C and 15N chemical shifts are shown in Figure 11 and tabulated in Table S1 in Supplementary Materials. TALOS requires the chemical shifts of three consecutive residues to predict the torsion angles of the central residue. Since I32 and H37 have not been labeled in our studies but data for their neighboring residues are available, we used database ideal helical chemical shifts for these two residues as placeholders in order to extract the (ϕ, ψ) angles of their neighboring residues. The torsion angles of I32 and H37 are thus not entirely constrained (shaded points in Figure 11).
Figure 11.

TALOS predicted (ϕ, ψ) angles for residues 26–38 of apo (black) and amantadine-complexed M2TMP (red). Filled and open red symbols denote the conformations of amt1 and amt2, which differ at G34. Residues 32 and 37 are shaded due to incomplete experimental data.
The chemical shift changes listed in Table 1 indicate a number of (ϕ, ψ) changes, although none of them are large enough to alter the basic helical nature of the protein. The first region of change is V27-V28, and the second is A30-S31. Interestingly, while the chemical shifts of V27 and A30 themselves are not significantly perturbed, the larger chemical shift changes of their C-terminal residues, V28 and S31, translated into significant (ϕ, ψ) changes at V27 and A30. In particular, the large 15N chemical shift changes of S31 and V28 indicate that the ψ angle of A30 and V27, respectively, are significantly perturbed.
The G34-I35 pair is the third region of (ϕ, ψ) perturbation that merits attention. Not only do both residues show clear chemical shift perturbations, but also two sets of G34 15N and 13C chemical shifts are present in the complexed peptide (Table 1). We denote the set with an upfield 15N shift of 106.3 ppm as amt1, and the set with a downfield 15N chemical shift of 109.7 ppm as amt2. The amt1 chemical shifts are similar to the apo values, suggesting that a population of peptide either does not bind or only weakly binds amantadine. In contrast, the amt2 chemical shifts are significantly different from the apo values, and cause larger G34 ϕ and I35 ψ changes (Figure 11). Overall, the TALOS predicted (ϕ, ψ) angle differences between the apo- and amt2 forms of M2TMP are on average (1.8°, 2.8°).
Figure 12 shows the monomer structure of the M2TMP backbone based on the TALOS (ϕ, ψ) angles. The apo structure is shown in black and gray and the amt2 structure in blue and cyan. For residues 39 down to the end of the helix, where no experimental chemical shifts are available, we used the helical torsion angles of (−59°, −44°) for both the apo and complexed peptide. Figure 12 shows that both helices are relatively ideal. The side views of the two models are oriented such that the N-terminus half of the helix above G34 has a tilt angle of 35° for the apo peptide and 38° for the amantadine-bound peptide. These tilt angles were measured on hydrated vesicle samples by 15N NMR 19; 20; 21. When the N-terminal segments of the two helices are superimposed, it becomes apparent that the amt2 and apo helices diverge in the orientation of the segment C-terminal to G34. Comparing the helical axis for residues 27–33 with the helical axis for residues 35–41, we find a kink of 8° for the apo peptide and 5° for the amt2 helix. The helical axis orientations were calculated as the average N-H vector orientation of each 7-residue segment, which approximately complete two turns of the helix.
Figure 12.

Chemical shift constrained backbone structure of the M2TMP monomer. Apo: black and gray ribbon. Amantadine-bound: blue and cyan ribbon. (a) Side view of the helix with tilt angles determined by SSNMR. (b) Top view of the apo monomer. (c) Top view of the amantadine-complexed monomer. The apo peptide has a more noticeable kink.
15N chemical shift anisotropies and N-H dipolar couplings have been measured on M2TMP in glass-plate aligned DMPC/DMPG membranes using static NMR techniques. These data indicated a pronounced helix kink of 13° for the drug-complexed M2TMP 17. The site of the kink is G34, in good qualitative agreement with the current chemical shift data that indicate structure perturbation at G34-I35. However, the kink from the oriented-sample NMR data is much larger than deduced from the current unoriented MAS samples. While static 15N anisotropic couplings are very sensitive to helix orientations, it is possible that glass-plate samples may exert additional influences on the protein orientation through mechanical stress and hydration. In comparison, the unoriented vesicle samples should place much less stress on membrane proteins and thus provide a useful check of the protein orientation. Moreover, the membrane thickness may affect the helical kink. The aligned membrane experiments were done in DMPC and DMPG lipids while the current experiments were conducted in the thinner DLPC bilayers.
The recent solution NMR 13 and X-ray structures 14 of drug-bound and detergent solubilized M2 peptide show different kinks of the helical backbone. Comparing the same segments of 27–33 and 35–41, the solution NMR structure (PDB: 2RLF) has a minor kink of 4°, while the refined crystal structure (PDB: 3C9J) has a larger kink of 12°. Thus, the amt2 kink of 5° measured by MAS-SSNMR falls within the range of reported by all methods.
Paradoxically, the structure of the apo M2 peptide is much less known than that of the drug-bound M2. Static 15N NMR data of the apo peptide suffered from broad linewidths due to unfavorable conformational dynamics of the protein 18; 32, which made it difficult to detect possible helix orientation differences between the N- and C-terminal segments of the helix. The MAS-NMR approach here bypasses this difficulty since its main structural constraints are isotropic chemical shifts, which can be measured at low temperature where motion is frozen. Based on the 13C and 15N isotropic chemical shifts, the helical backbone of the apo M2TMP is also not straight but has a kink of ~9°, as shown in the top view in Figure 12b. While the chemical shift constrained backbone conformation are only indirect constraints of the helix orientation, the data nevertheless suggests that the presence of Gly34 in the peptide may cause a small kink already in the apo protein. This would not be surprising since Gly is a helix breaker in globular proteins 33. In membrane proteins Gly adheres to more ideal helical torsion angles 34, as in the case of Gly34, but a small deviation from ideality is all that is required to cause a small kink of the helical axis. If confirmed, then the role of helix kink to the M2 channel activity would need to be considered. Since Gly34 is located roughly one turn away from His37, which is responsible for proton conduction, we speculate that the kink may be required for establishing the proper His37 sidechain conformation. The change in the helix kink after amantadine binding may thus be relevant for proton blockage.
Backbone structure of the M2 tetramer
Based on the chemical shift constrained monomer structure, we now construct a tetramer model of amantadine-bound M2TMP using the measured helix orientation and interhelical distances. Again, the helix tilt angle is set to be 35° for the apo peptide 20 and 38° for the amantadine-bound peptide 19; 21 for the segment N-terminal to Gly34. We have previously measured two 19F-19F interhelical distances at Trp41 5-19F 23 and Phe30 4-19F 22; 35 using 19F spin diffusion NMR 36. By design, these experiments measure all three distances in the symmetric tetramer, including two nearest neighbor i − i±1 distances rnn and the diagonal i − i+2 distance, . The tetrameric nature of the channel is directly confirmed in the experiment as an equilibrium value of 1/4. We found an rnn of 11.8 Å for Trp41 5-19F and 8.5 Å at Phe30 4-19F. The former constrained the Trp41 sidechain rotamer to t90 (χ1=180°, χ2=90°), while the latter constrained the Phe30 rotamer to t (χ1=180°). In addition to these two interhelical distances, we use a Gly34 Cα-Cα diagonal distance of 10.4 Å 37 in building the tetramer model.
Figure 13 shows the tetramer model for the amt2 peptide where the three distance restraints are indicated. For clarity we show only the diagonal distances, which are 16.7 Å, 12.5 Å, and 10.4 Å for Trp41 5-19F, Phe30 4-19F, and Gly34 Cα, respectively. For comparison, the tetramer structure solved by 15N static NMR (PDB: 2H95), solution NMR (PDB: 2RLF), and X-ray crystallography (PDB: 3C9J) are shown in Figure 14b-d. A number of differences can be seen. First, both the solution NMR structure in DHPC micelles and the static 15N NMR structure in DMPC bilayers give inter-helical Trp41 distances that are much shorter than the measured value. This discrepancy is mainly due to the different (χ1, χ2) angles in these models: t-90 in the solution NMR structure and (−95°, 125°) in the static 15N NMR model. The crystal structure has the t90 rotamer for Trp41 and thus gives consistent interhelical distances with the 19F MAS NMR result. Second, the MAS-SSNMR tetramer model is more open at the N-terminus than the solution NMR and crystal structures. At Val27, the Hγ - Hγ diagonal distances in our model are ~11 Å, but are 5 – 7 Å in the other models. The relatively large pore opening at Val27 in our model is a direct result of the helix orientation, and is consistent with the small chemical shift perturbation of Val27 and the interhelical Phe30 distance constraint. This large opening may be necessary to allow the drug to bind at the N-terminus. The smaller Val27 constriction in the solution NMR and crystal structures is a direct result of smaller tilt angles, which may be influenced by the detergent matrix used. It is well documented that the orientation of the M2 transmembrane helix is relatively plastic, readily affected by the bilayer thickness 20; 38. In DLPC and DMPC bilayers, both MAS and static NMR experiments point to a large helical tilt angle of about 35°, while in POPC bilayers the tilt angle is only 26° 20.
Figure 13.

Tetramer model of M2TMP constrained by SSNMR chemical shifts, interhelical distances and helix orientations. (a) Trp41 5-19F distance between the two opposite helices is 16.7 Å 23. (b) Phe30 4-19F diagonal distance is 12.5 Å 22. (c) Side view of the tetramer, with a diagonal Gly34 Cα-Cα distance of 10.4 Å.
Figure 14.

Comparison of the MAS NMR structure model with other recently published structures of drug-complexed M2. The Trp41 indole ring and the diagonal distance between its 5-19F or Hζ3 is indicated. (a) MAS-NMR model of amantadine-bound M2TMP. (a) 15N static SSNMR model of amantadine-bound M2TMP (PDB code: 2H95). (b) Solution NMR structure of rimantadine-bound M2(18-60) (PDB code: 2RLF). (c) Crystal structure of amantadine-bound M2TMP (PDB: 3C9J).
In contrast to the openness of the channel at Val27, the MAS-derived structural model shows a tight Ser31 constriction, with a distance of 9.0 Å between the two opposing hydroxyl oxygens. This Ser31 constriction is similar to the crystal structure, but tighter than the static 15N NMR model (11.9 Å) and the solution NMR structure (19.4 Å) (Figure 14). Overall, the small Ser31 constriction is consistent with the large chemical shift perturbation at this site (see next section).
To compare the various M2 PDB structures with the current MAS-based model more quantitatively, we used the SHIFTX program 39 to calculate the 15N, 13CO, 13Cα and 13Cβ chemical shifts for the crystal structure (PDB: 3C9J), the solution NMR structure (PDB: 2RLF), and the oriented solid-state NMR structure (PDB: 2H95). The root-mean-square (RMS) deviations of the predicted chemical shifts from the measured values for both the apo and amantadine-bound M2TMP are summarized in Table S2 (Supplementary Material). Three observations can be made. First, with the exception of the 13CO shifts for the oriented NMR structure model, most 13C RMS shift differences are in the range of 0.8–1.3 ppm, which are comparable to the standard RMS errors of the SHIFTX program. This suggests that the deviations are mostly due to systematic uncertainties in the prediction protocol rather than large secondary structure differences. Second, the 15N chemical shifts differences are comparable to the standard RMS error when the predicted values are compared to the measured apo chemical shifts, but the differences become almost two times larger when the predicted values are compared to the amantadine-bound chemical shifts. This further indicates the sensitivity of 15N chemical shifts to long-range electrostatic effects due to ligand binding and helix packing, which are not taken into account in such chemical shift prediction programs. Third, among the three PDB structures, the oriented SSNMR structure (2H95) has the largest 13C chemical shift deviations from the current data, but the smallest 15N chemical shift deviations. This is consistent with the sole use of 15N NMR inputs to constrain the 2H95 model.
Ser31 interaction with amantadine
The chemical shift perturbation plot (Figure 7a) indicates maximal drug-induced changes at Ser31 and Val28, which are mainly due to the large 15N chemical shift changes of these two residues. Many factors influence 15N chemical shielding: in addition to (ϕ, ψ, χ) torsion angles 40, solvation effects and electrostatic field effects can be significant. Hydrogen bonding of the NH group can cause a deshielding of as much as 13 ppm 41, and γ-gauche effect through the sidechain torsion angle also affects the 15N chemical shifts 40. However, database 15N secondary shifts show only small deviations of ~ 1 ppm for the helical conformation from the random coil values 42. Thus, it is difficult to directly interpret the large 15N chemical shift perturbation of Ser31. Nevertheless, it is noteworthy that both the 15N and Cβ chemical shifts of Ser31 in the bound peptide (Table 1) are well beyond the typical values for α-helical Ser 42, which are 114.9 ppm and 61.2 ppm, respectively, while the apo peptide’s Ser31 chemical shifts are within the database range for α-helical Ser. This suggests that Ser31 is locally perturbed by amantadine through packing effects.
Early neutron diffraction 25 and MD simulations 24 both supported the N-terminus of the helical bundle to be the amantadine binding site. However, the recently published high-resolution crystal structure 14 and solution NMR structure 13 of M2 gave contradictory results on the drug binding site. The former shows an N-terminus binding site deeper than Ser31, while the latter puts four rimantadine molecules per channel on the C-terminus side at helical interfaces. Since then, a functional study of the proton conductivity of M2 mutants has been carried out that supports the N-terminus region as the primary amantadine binding site with channel inhibition properties 43.
While the current data do not directly probe the drug binding site, several indirect pieces of structural evidence support an N-terminus location for amantadine. First, Ser31 is the only residue among the three studied here whose sidechain Cβ linewidth is reduced. This may reflect sidechain conformational ordering necessary to form the appropriate hydrogen bond with amantadine. Second, the chemical shift perturbation for the segment N-terminal to G34 is extensive (Figure 11), with only the lipid-facing A29 and the very upstream L26 showing no torsion angles changes. Third, both V28 and L36 lie at lipid-facing positions (b and c) of the heptad repeat, but the chemical shift perturbation of the N-terminus V28 is much larger than that of the C-terminus L36.
Assuming that amantadine indeed binds the N-terminus portion of the channel, we can model the distances of amantadine from Ser31 in the tetramer (Figure 15). Using the height of amantadine found in the crystal structure as a template, we found that if the amine points to the center of the membrane, then the RNO distances between Ser31 OH and amantadine NH2 are 7.5 – 8.0 Å, too long for hydrogen bonding. However, if the amine points to the membrane surface, then much shorter RNO distances of ~4.5 Å are found. This amine-up orientation is supported by a recent paramagnetic relaxation NMR and MD simulation study of the depth of insertion of amantadine in the absence of M2 30. To decrease the RNO distance further to form hydrogen bonds of 2.5 – 3.5 Å, the Ser31 χ1 torsion angle would need to be changed. Due to the small sidechain, Ser does not have a single dominant χ1 rotamer. For α-helical backbones, the most popular rotamer of m (χ1= −65°) is 44% while the least popular rotamer t (χ1=−170°) still has a significant presence of 22% 44. In our model (Figure 15), both the m and t rotamers give RNO distance of ~4.5 Å, but shorter distances of ~3.5 Å may be reached for less canonical χ1 angles. Ultimately, intermolecular distance experiments are necessary to test this Ser31 binding-site hypothesis and to determine the high-resolution structure of the amantadine binding pocket in the bilayer-bound M2.
Figure 15.

MAS-NMR M2 tetramer model with the proposed amantadine-binding site. The height of amantadine is set to be similar to that of the crystal structure. Ser31 sidechain O distances to the amine are indicated. The top view looks down the helix axis from the N- to the C-terminus.
Molecular dynamics of M2TMP
The conformational plasticity of the M2 peptide in lipid membranes are now well documented 20; 32; 38. The low 13C CP intensities and short 13C T2 relaxation times for V28, S31 and L36 at high temperature all confirm the presence of intermediate-timescale conformational dynamics, which interfere with 1H decoupling and the 1H-13C cross polarization process. In the gel phase, the motion is largely frozen, thus the distribution of conformations sampled at high temperature is shown as isotropic chemical shift distributions. The larger low-temperature linewidths of the apo peptide compared to the complexed peptides, mostly at 15N sites, indicate larger conformational disorder of the apo peptide.
The nature of the M2 motion is complex. We have shown that the whole helical bundle undergoes uniaxial rotation around the bilayer normal 20, which explains the observation that the short 13C T2 times are not local but occur throughout the peptide. The lengthening of the T2 upon amantadine binding (Table 3) can in principle result from either a decrease or increase of motional correlation times. Temperature-sensitive relaxation times (unpublished data) indicate that the rate of motion is accelerated rather than slowed down by amantadine. Figure 7b indicates that most residues have similar amantadine-induced T2 increases except for Ser31 and Val27, whose T2 increases are much larger. We hypothesize that the exceptionally long 13C T2 at this two sites may be caused by strong interaction with amantadine. However, the exact nature of the site-specific conformational dynamics or ordering will require further investigation.
In summary, the solid-state NMR chemical shifts and dynamic constraints measured here for Ser31 and other residues combine with previous data to allow the determination of a bilayer-bound structure of the transmembrane domain of this important influenza proton channel. We found that the apo and amantadine-complexed M2TMP differ in conformation mainly at three regions, V27-V28, A30-S31, and G34-I35. In particular, G34 is the site of a helical kink in both the apo and drug-bound peptide. Interhelical distances and helix orientations constrain the tetramer to be relatively open at the N-terminus, which allows the drug to enter, but tight at Ser31, which suggests hydrogen bonding between the hydroxyl group and the amantadine amine. At Trp41 the channel has an interhelical distance of ~16.7 Å between opposing helices. Among all residues, Ser31 shows the largest drug-induced perturbations of chemical shifts, conformational dynamics, and conformational disorder, strongly suggesting that this residue is the amantadine binding site.
Material and Methods
Peptides and lipids
Fmoc-protected uniformly 13C, 15N-labeled Val, Ser, and Leu were either prepared in-house 45 or purchased from Sigma-Aldrich and Cambridge Isotope Laboratories. The M2 transmembrane domain of the Udorn strain (residues 22–46) 46 was synthesized by PrimmBiotech (Cambridge, MA) and purified to >95% purity. The amino acid sequence is SSDPL VVAASII GILHLIL WILDRL. The main peptide used in this work includes labeled residues at V28, S31, and L36 and is denoted VSL-M2TMP. Two previously studied M2TMP samples were also reexamined for their chemical shift assignment. One peptide contains labeled residues at L26, A29, G34 and I35, and the other peptide contains labeled sites at V27, A30, I33 and L38.
Membrane sample preparation
M2TMP was reconstituted into 1,2-dilauroyl-sn-glycero-3-phosphatidylcholine (DLPC) bilayers by detergent dialysis 23. DLPC was chosen because of the favorable dynamics of the protein in this membrane 20 and the similar phase transition temperature (−2°C) of this bilayer to biological cell membranes. The lipid vesicle solution was prepared by suspending dry DLPC powder (Avanti Polar Lipids) in 1 mL phosphate buffer (10 mM Na2HPO4/NaH2PO4, 1 mM EDTA, 0.1 mM NaN3) at pH 7.5, vortexing and freeze-thawing 6–8 times to create uniform vesicles 47. M2TMP powder was codissolved with OG in 2 mL phosphate buffer to an OG concentration of 30 mg/mL. The M2TMP/OG solution was mixed with an equal volume of DLPC vesicles to halve the OG concentration to 15 mg/mL. The final peptide/lipid molar ratio (P/L) was 1:15. The mixture was vortexed for 1 hr, allowed to stand for 6–8 hrs at room temperature, then dialyzed with a 3.5 kDa cutoff against 1 L phosphate buffer at 4°C for 3 days. The buffer was changed every 8–12 hrs to ensure complete removal of the detergent. The dialyzed M2TMP/DLPC solution was centrifuged at 150,000 g for 3 hours at 10°C, resulting in a pellet containing ~50 wt% water. For most amantadine-bound samples, 10 mM amantadine hydrochloride was added to the phosphate buffer either throughout the vesicle formation and peptide reconstitution processes or before ultracentrifugation. After ultracentrifugation the percent of amantadine left in the supernatant was quantified by 1H solution NMR and found to be roughly 60%. This gave a peptide : lipid : drug molar ratio of about 1 : 15 : 8. All membrane-bound M2 samples were thus studied at pH 7.5, corresponding to the closed state of the channel.
Solid-state NMR spectroscopy
Most SSNMR experiments were carried out on a Bruker AVANCE-600 (14.1 Tesla) spectrometer (Karlsruhe, Germany) using a 4 mm triple-resonance MAS probe. 13C-13C and 15N-13C 2D correlation experiments were conducted at 243 K to freeze peptide motion. 13C T2 relaxation times were measured at 303 K where the peptide is uniaxially mobile in the liquid-crystalline DLPC bilayer. Typical rf pulse lengths were 5 μs for 13C and 3.5–4.0 μs for 1H. 1H TPPM 48 or SPINAL 49 decoupling field strengths of 60 – 70 kHz were applied. 13C chemical shifts were referenced to the α-Gly C′ signal at 176.49 ppm on the TMS scale, and 15N chemical shifts were referenced to the 15N signal of N-acetyl-valine at 122.0 ppm on the liquid ammonia scale.
Three types of 2D 13C-13C correlation experiments were carried out to assign all regions of the 13C spectra. A double-quantum-filtered (DQF) COSY experiment was used to obtain lipid-free protein spectra. Double-quantum filtration was performed using the dipolar recoupling sequence SPC5 50 with the sample spun at 7000 Hz. To better assign the carbonyl peaks, which are weak in the DQF-COSY spectrum due to their large chemical shift difference from the aliphatic carbons, a 2D 1H-driven 13C spin diffusion experiment with a 10 ms DARR mixing period 51 was carried out under 5333 Hz MAS. Finally, to completely resolve the sidechain methyl 13C signals, a double-quantum single-quantum correlation experiment, INADEQUATE 52; 53, was used in which the SPC5 sequence was again used for double-quantum excitation and reconversion.
Heteronuclear 2D 15N-13C correlation experiments were carried out in an out-and-back fashion using the REDOR sequence 54 for 13C-15N coherence transfer 55. The C-N recoupling times varied between 0.7 and 2.1 ms to observe one-bond versus multiple-bond cross peaks.
To selectively detect the S31 Cβ signal that overlaps with its Cα, we carried out a methylene spectral editing experiment 56 at 233 K. The β pulse in the sequence that was responsible for clean suppression of the methine CH signals was optimized to be 40°. For MREV-8 57 1H homonuclear decoupling, a 1H pulse flip angle of 94° was used.
Structure Modeling
The M2TMP tetramer structure was modeled in Insight II (Accelrys, Inc. San Diego). The central segment of residues 26–38 was constrained by the chemical shifts and interhelical distances except for residues I32 and H37. The final tetramer model used the wild-type residue Ala at position 30, after the mutation Phe30 was checked for interhelical distance restraint. The atomic coordinates of the tetrameric helical bundle have been deposited in the Protein Data Bank (accession number: 2kad). The SSNMR chemical shift restraints have been deposited in the Biological Magnetic Resonance Bank (accession number: 16020). These data will be released upon publication.
Supplementary Material
Acknowledgments
This work is funded by NSF grants MCB-0543473 to M.H. and DBI-0421374 for the 600 MHz NMR spectrometer. The authors thank Professor Bill DeGrado for discussions and sharing the refined crystal structure coordinates, and Professor Klaus Schmidt-Rohr for providing the pulse sequence for the CH2 selection experiment.
Footnotes
References
- 1.Pinto LH, Lamb RA. Controlling influenza virus replication by inhibiting its proton channel. Mol Biosyst. 2007;3:18–23. doi: 10.1039/b611613m. [DOI] [PubMed] [Google Scholar]
- 2.Bright RA, Medina MJ, Xu X, Perez-Oronoz G, Wallis TR, Davis XM, Povinelli L, Cox NJ, Klimov AI. Incidence of adamantane resistance among influenza A (H3N2) viruses isolated worldwide from 1994 to 2005: a cause for concern. Lancet. 2005;366:1175–1181. doi: 10.1016/S0140-6736(05)67338-2. [DOI] [PubMed] [Google Scholar]
- 3.Lamb RA, Holsinger KJ, Pinto LH. The Influenza A virus M2 ion channel protein and its role in the influenza virus life cycle. In: Wemmer E, editor. Cellular Receptors of Animal Viruses. Cold Spring Harbor Lab Press; Plainview, NY: 1994. pp. 303–321. [Google Scholar]
- 4.Pinto LH, Holsinger LJ, Lamb RA. Influenza virus M2 protein has ion channel activity. Cell. 1992;69:517–528. doi: 10.1016/0092-8674(92)90452-i. [DOI] [PubMed] [Google Scholar]
- 5.Holsinger LJ, Nichani D, Pinto LH, Lamb RA. Influenza A virus M2 ion channel protein: a structure-function analysis. J Virol. 1994;68:1551–1563. doi: 10.1128/jvi.68.3.1551-1563.1994. [DOI] [PMC free article] [PubMed] [Google Scholar]
- 6.Sakaguchi T, Tu Q, Pinto LH, Lamb RA. The active oligomeric state of the minimalistic influenza virus M2 ion channel is a tetramer. Proc Natl Acad Sci USA. 1997;94:5000–5005. doi: 10.1073/pnas.94.10.5000. [DOI] [PMC free article] [PubMed] [Google Scholar]
- 7.Hu J, Fu R, Nishimura K, Zhang L, Zhou HX, Busath DD, Vijayvergiya V, Cross TA. Histidines, heart of the hydrogen ion channel from influenza A virus: toward an understanding of conductance and proton selectivity. Proc Natl Acad Sci USA. 2006;103:6865–6870. doi: 10.1073/pnas.0601944103. [DOI] [PMC free article] [PubMed] [Google Scholar]
- 8.Tang Y, Zaitseva F, Lamb RA, Pinto LH. The Gate of the Influenza Virus M2 Proton Channel Is Formed by a Single Tryptophan Residue. J Biol Chem. 2002;277:39880–39886. doi: 10.1074/jbc.M206582200. [DOI] [PubMed] [Google Scholar]
- 9.Duff KC, Ashley RH. The transmembrane domain of influenza A M2 protein forms amantadine-sensitive proton channels in planar lipid bilayers. Virology. 1992;190:485–489. doi: 10.1016/0042-6822(92)91239-q. [DOI] [PubMed] [Google Scholar]
- 10.Pinto LH, Dieckmann GR, Gandhi CS, Papworth CG, Braman J, Shaughnessy MA, Lear JD, Lamb RA, DeGrado WF. A functionally defined model for the M2 proton channel of influenza A virus suggests a mechanism for its ion selectivity. Proc Natl Acad Sci USA. 1997;94:11301–11306. doi: 10.1073/pnas.94.21.11301. [DOI] [PMC free article] [PubMed] [Google Scholar]
- 11.Kochendoerfer GG, Salom D, Lear JD, Wilk-Orescan R, Kent SB, DeGrado WF. Total chemical synthesis of the integral membrane protein influenza A virus M2: role of its C-terminal domain in tetramer assembly. Biochemistry. 1999;38:11905–13. doi: 10.1021/bi990720m. [DOI] [PubMed] [Google Scholar]
- 12.Nguyen PA, Soto CS, Polishchuk A, Caputo GA, Tatko CD, Ma C, Ohigashi Y, Pinto LH, DeGrado WF, Howard KP. pH-induced conformational change of the influenza M2 protein C-terminal domain. Biochemistry. 2008;47:9934–9936. doi: 10.1021/bi801315m. [DOI] [PMC free article] [PubMed] [Google Scholar]
- 13.Schnell JR, Chou JJ. Structure and mechanism of the M2 proton channel of influenza A virus. Nature. 2008;451:591–595. doi: 10.1038/nature06531. [DOI] [PMC free article] [PubMed] [Google Scholar]
- 14.Stouffer AL, Acharya R, Salom D, Levine AS, Di Costanzo L, Soto CS, Tereshko V, Nanda V, Stayrook S, DeGrado WF. Structural basis for the function and inhibition of an influenza virus proton channel. Nature. 2008;451:596–599. doi: 10.1038/nature06528. [DOI] [PMC free article] [PubMed] [Google Scholar]
- 15.Miller C. Ion channels: coughing up flu’s proton channels. Nature. 2008;451:532–533. doi: 10.1038/451532a. [DOI] [PubMed] [Google Scholar]
- 16.Chou JJ, Kaufman JD, Stahl SJ, Wingfield PT, Bax A. Micelle-induced curvature in a water-insoluble HIV-1 Env peptide revealed by NMR dipolar coupling measurement in stretched polyacrylamide gel. J Am Chem Soc. 2002;124:2450–1. doi: 10.1021/ja017875d. [DOI] [PubMed] [Google Scholar]
- 17.Hu J, Asbury T, Achuthan S, Li C, Bertram R, Quine JR, Riqiang F, Cross TA. Backbone Stucture of the Amantadine-Block Trans-Membrane Domain M2 Proton Channel from Influenza A Virus. Biophys J. 2007;92:4335–4343. doi: 10.1529/biophysj.106.090183. [DOI] [PMC free article] [PubMed] [Google Scholar]
- 18.Wang J, Kim S, Kovacs F, Cross TA. Structure of the transmembrane region of the M2 protein H(+) channel. Protein Sci. 2001;10:2241–2250. doi: 10.1110/ps.17901. [DOI] [PMC free article] [PubMed] [Google Scholar]
- 19.Cady SD, Hong M. Amantadine-Induced Conformational and Dynamical Changes of the Influenza M2 Transmembrane Proton Channel. Proc Natl Acad Sci US A. 2008;105:1483–1488. doi: 10.1073/pnas.0711500105. [DOI] [PMC free article] [PubMed] [Google Scholar]
- 20.Cady SD, Goodman C, Tatko CD, DeGrado WF, Hong M. Determining the orientation of uniaxially rotating membrane proteins using unoriented samples: a 2H, 13C, AND 15N solid-state NMR investigation of the dynamics and orientation of a transmembrane helical bundle. J Am Chem Soc. 2007;129:5719–5729. doi: 10.1021/ja070305e. [DOI] [PubMed] [Google Scholar]
- 21.Cady SD, Hong M. Simultaneous extraction of multiple orientational constraints of membrane proteins by 13C-detected N-H dipolar couplings under magic angle spinning. J Magn Reson. 2008;191:219–225. doi: 10.1016/j.jmr.2008.01.001. [DOI] [PubMed] [Google Scholar]
- 22.Luo W, Hong M. Determination of the oligomeric number and intermolecular distances of membrane protein assemblies by anisotropic (1)h-driven spin diffusion NMR spectroscopy. J Am Chem Soc. 2006;128:7242–7251. doi: 10.1021/ja0603406. [DOI] [PubMed] [Google Scholar]
- 23.Luo W, Mani R, Hong M. Sidechain conformation and gating of the M2 transmembrane peptide proton channel of influenza A virus from solid-state NMR. J Phys Chem. 2007;111:10825–10832. doi: 10.1021/jp073823k. [DOI] [PubMed] [Google Scholar]
- 24.Sansom MS, Kerr ID. Influenza virus M2 protein: a molecular modelling study of the ion channel. Protein Eng. 1993;6:65–74. doi: 10.1093/protein/6.1.65. [DOI] [PubMed] [Google Scholar]
- 25.Duff KC, Gilchrist PJ, Saxena AM, Bradshaw JP. Neutron diffraction reveals the site of amantadine blockade in the influenza A M2 ion channel. Virology. 1994;202:287–293. doi: 10.1006/viro.1994.1345. [DOI] [PubMed] [Google Scholar]
- 26.Cornilescu G, Delaglio F, Bax A. Protein backbone angle restraints from searching a database for chemical shift and sequence homology. J Biomol NMR. 1999;13:289–302. doi: 10.1023/a:1008392405740. [DOI] [PubMed] [Google Scholar]
- 27.de Dios AC, Oldfield E. Chemical shifts of carbonyl carbons in peptides and proteins. J Am Chem Soc. 1994;116:11485–11488. [Google Scholar]
- 28.Cady SD, Mishanina T, Hong M. 2008 manuscript in preparation. [Google Scholar]
- 29.Wang J, Schnell JR, Chou JJ. Amantadine partition and localization in phospholipid membrane: a solution NMR study. Biochem Biophys Res Commun. 2004;324:212–217. doi: 10.1016/j.bbrc.2004.09.039. [DOI] [PubMed] [Google Scholar]
- 30.Li C, Yi M, Hu J, Zhou HX, Cross TA. Solid-state NMR and MD simulations of the antiviral drug amantadine solubilized in DMPC bilayers. Biophys J. 2008;94:1295–1302. doi: 10.1529/biophysj.107.112482. [DOI] [PMC free article] [PubMed] [Google Scholar]
- 31.Subczynski WK, Wojas J, Pezeshk V, Pezeshk A. Partitioning and localization of spin-labeled amantadine in lipid bilayers: an EPR study. J Pharm Sci. 1998;87:1249–1254. doi: 10.1021/js970381n. [DOI] [PubMed] [Google Scholar]
- 32.Li C, Qin H, Gao FP, Cross TA. Solid-state NMR characterization of conformational plasticity within the transmembrane domain of the influenza A M2 proton channel. Biochim Biophys Acta. 2007;1768:3162–3170. doi: 10.1016/j.bbamem.2007.08.025. [DOI] [PMC free article] [PubMed] [Google Scholar]
- 33.O’Neil KT, DeGrado WF. A thermodynamic scale for the helix-forming tendencies of the commonly occurring amino acids. Science. 1990;250:646–651. doi: 10.1126/science.2237415. [DOI] [PubMed] [Google Scholar]
- 34.Javadpour MM, Eilers M, Groesbeek M, Smith SO. Helix packing in polytopic membrane proteins: role of glycine in transmembrane helix association. Biophys J. 1999;77:1609–1618. doi: 10.1016/S0006-3495(99)77009-8. [DOI] [PMC free article] [PubMed] [Google Scholar]
- 35.Howard KP, Lear JD, DeGrado WF. Sequence determinants of the energetics of folding of a transmembrane four-helix-bundle protein. Proc Natl Acad Sci USA. 2002;99:8568–8572. doi: 10.1073/pnas.132266099. [DOI] [PMC free article] [PubMed] [Google Scholar]
- 36.Buffy JJ, Waring AJ, Hong M. Determination of Peptide Oligomerization in Lipid Membranes with Magic-Angle Spinning Spin Diffusion NMR. J Am Chem Soc. 2005;127:4477–4483. doi: 10.1021/ja043621r. [DOI] [PubMed] [Google Scholar]
- 37.Harris NL, Presnell SR, Cohen FE. Four helix bundle diversity in globular proteins. J Mol Biol. 1994;236:1356–68. doi: 10.1016/0022-2836(94)90063-9. [DOI] [PubMed] [Google Scholar]
- 38.Duong-Ly KC, Nanda V, DeGrado WF, Howard KP. The conformation of the pore region of the M2 proton channel depends on lipid bilayer environment. Protein Sci. 2005;14:856–61. doi: 10.1110/ps.041185805. [DOI] [PMC free article] [PubMed] [Google Scholar]
- 39.Neal S, Nip AM, Zhang H, Wishart DS. Rapid and accurate calculation of protein 1H, 13C and 15N chemical shifts. J Biomol NMR. 2003;26:215–240. doi: 10.1023/a:1023812930288. [DOI] [PubMed] [Google Scholar]
- 40.Le H, Oldfield E. Correlation between 15N NMR chemical shifts in proteins and secondary structure. J Biomol NMR. 1994;4:341–348. doi: 10.1007/BF00179345. [DOI] [PubMed] [Google Scholar]
- 41.deDios AC, Pearson JG, Oldfield E. Secondary and tertiary structural effects on protein NMR chemical shifts: an ab initio approach. Science. 1993;260:1491–1496. doi: 10.1126/science.8502992. [DOI] [PubMed] [Google Scholar]
- 42.Zhang H, Neal S, Wishart DS. RefDB: A database of uniformly referenced protein chemical shifts. J Biomol NMR. 2003;25:173–195. doi: 10.1023/a:1022836027055. [DOI] [PubMed] [Google Scholar]
- 43.Jing X, Ma C, Ohigashi Y, Oliveira FA, Jardetzky TS, Pinto LH, Lamb RA. Functional studies indicate amantadine binds to the pore of the influenza A virus M2 proton-selective ion channel. Proc Natl Acad Sci USA. 2008;105:10967–10972. doi: 10.1073/pnas.0804958105. [DOI] [PMC free article] [PubMed] [Google Scholar]
- 44.Lovell SC, Word JM, Richardson JS, Richardson DC. The penultimate rotamer library. Proteins: Struct, Funct, Genet. 2000:40. [PubMed] [Google Scholar]
- 45.Carpino LA, Han GY. 9-Fluorenylmethoxycarbonyl amino-protecting group. J Org Chem. 1972;37:3404–3409. [Google Scholar]
- 46.Ito T, Gorman OT, Kawaoka Y, Bean WJ, Webster RG. Evolutionary analysis of the influenza A virus M gene with comparison of the M1 and M2 proteins. J Virol. 1991;65:5491–5498. doi: 10.1128/jvi.65.10.5491-5498.1991. [DOI] [PMC free article] [PubMed] [Google Scholar]
- 47.Traikia M, Warschawski DE, Recouvreur M, Cartaud J, Devaux PF. Formation of unilamellar vesicles by repetitive freeze-thaw cycles: characterization by electron microscopy and 31P-nuclear magnetic resonance. Eur Biophys J. 2000;29:184–195. doi: 10.1007/s002490000077. [DOI] [PubMed] [Google Scholar]
- 48.Bennett AE, Rienstra CM, Auger M, Lakshmi KV, Griffin RG. Heteronuclear decoupling in rotating solids. J Chem Phys. 1995;103:6951–6958. [Google Scholar]
- 49.Fung BM, Khitrin AK, Ermolaev K. An improved broadband decoupling sequence for liquid crystals and solids. J Magn Reson. 2000;142:97–101. doi: 10.1006/jmre.1999.1896. [DOI] [PubMed] [Google Scholar]
- 50.Hohwy M, Rienstra CM, Jaroniec CP, Griffin RG. Fivefold symmetric homonuclear dipolar recoupling in rotating solids: application to double-quantum spectroscopy. J Chem Phys. 1999;110:7983–7992. [Google Scholar]
- 51.Takegoshi K, Nakamura S, Terao T. C-13-H-1 dipolar-assisted rotational resonance in magic-angle spinning NMR. Chem Phys Lett. 2001;344:631–637. doi: 10.1063/1.2364503. [DOI] [PubMed] [Google Scholar]
- 52.Bax A, Freeman R, Kempsell SP. Natural-abundance 13C-13C coupling observed via double-quantum coherence. J Am Chem Soc. 1980;102:4849–4851. [Google Scholar]
- 53.Hong M. Solid-state dipolar INADEQUATE NMR spectroscopy with a large double-quantum spectral width. J Magn Reson. 1999;136:86–91. doi: 10.1006/jmre.1998.1631. [DOI] [PubMed] [Google Scholar]
- 54.Gullion T, Schaefer J. Rotational echo double resonance NMR. J Magn Reson. 1989;81:196–200. doi: 10.1016/j.jmr.2011.09.003. [DOI] [PubMed] [Google Scholar]
- 55.Hong M, Griffin RG. Resonance Assignment for Solid Peptides by Dipolar-Mediated 13C/15N Correlation Solid-State NMR. J Am Chem Soc. 1998;120:7113–7114. [Google Scholar]
- 56.Mao JD, Schmidt-Rohr K. Methylene spectral editing in solid-state C-13 NMR by three-spin coherence selection. J Magn Reson. 2005;176:1–6. doi: 10.1016/j.jmr.2005.04.016. [DOI] [PubMed] [Google Scholar]
- 57.Rhim W-K, Elleman DD, Vaughan RW. Analysis of multiple-pulse NMR in solids. J Chem Phys. 1973;59:3740–3749. [Google Scholar]
Associated Data
This section collects any data citations, data availability statements, or supplementary materials included in this article.