

Abstract
Previous studies showed glucose and insulin signaling can regulate bile acid (BA) metabolism during fasting or feeding. However, limited knowledge is available on the effect of calorie restriction (CR), a well-known anti-aging intervention, on BA homeostasis. To address this, the present study utilized a “dose-response” model of CR, where male C57BL/6 mice were fed 0, 15, 30, or 40% CR diets for one month, followed by BA profiling in various compartments of the enterohepatic circulation by UPLC-MS/MS technique. This study showed that 40% CR increased the BA pool size (162%) as well as total BAs in serum, gallbladder, and small intestinal contents. In addition, CR “dose-dependently” increased the concentrations of tauro-cholic acid (TCA) and many secondary BAs (produced by intestinal bacteria) in serum, such as tauro-deoxycholic acid (TDCA), DCA, lithocholic acid, ω-muricholic acid (ωMCA), and hyodeoxycholic acid. Notably, 40% CR increased TDCA over 1000% (serum, liver, and gallbladder). Interestingly, 40% CR increased the proportion of 12α-hydroxylated BAs (CA and DCA), which correlated with improved glucose tolerance and lipid parameters. The CR-induced increase in BAs correlated with increased expression of BA-synthetic (Cyp7a1) and conjugating enzymes (BAL), and the ileal BA-binding protein (Ibabp). These results suggest that CR increases BAs in male mice possibly through orchestrated increases in BA synthesis and conjugation in liver as well as intracellular transport in ileum.
Keywords: Calorie restriction, Bile acids, Enterohepatic circulation, 12α-hydroxylated BAs, BA profiling, UPLC-MS/MS
Introduction
Calorie restriction (CR), which refers to decrease in calorie intake without causing malnutrition, is a well-known anti-aging intervention to decrease the incidence of age-related diseases. CR elicits multiple downstream signaling pathways that are orchestrated to achieve beneficial effects. CR alters many endogenous molecules, such as glucose, insulin, triglycerides, growth hormone, insulin-like growth factor 1, leptin, and dehydroepiandrosterone sulfate (Ramsey et al., 2000; Pasiakos et al., 2011). However, limited knowledge is available about the effect of CR on another endogenous molecule, bile acids (BAs).
BAs are end-products of cholesterol metabolism in liver, and well-known for their classic roles in facilitating cholesterol elimination in liver and dietary fat absorption in intestine as amphipathic molecules. There are two major BA receptors, namely the nuclear receptor farnesoid X receptor (FXR/Nr1h4) (Makishima et al., 1999; Parks et al., 1999; Wang et al., 1999) and the membrane-bound G-protein coupled receptor TGR5 (GPBAR1) (Kawamata et al., 2003). Upon BA activation, FXR translocates to the nucleus, and heterodimerizes with RXR, which binds to DNA and initiates target gene expression (Forman et al., 1995). FXR is crucial for regulating BA, glucose, and lipid metabolism (Claudel et al., 2005). TGR5 activation by BAs increases cAMP-deiodinase 2 and T3 signaling, which subsequently promotes energy expenditure in brown adipose tissue and muscle (Watanabe et al., 2006). Interacting with these receptors, BAs are versatile signaling molecules that regulate glucose, lipid, and energy metabolism (Lefebvre et al., 2009). Moreover, glucose and insulin are important regulators for BA homeostasis (Park and Pak, 2011; Li et al., 2012).
BA homeostasis is well maintained under normal conditions. Primary BAs are synthesized and conjugated in liver, from which secondary BAs are produced by bacterial enzymes mainly in the lumen of large intestine (LI) (Ridlon et al., 2006). BA de-novo synthesis involves many enzymes that are preferentially expressed in liver (Russell, 2003). The classic pathway starts with Cyp7a1, the rate-limiting enzyme (Chiang, 1998) that catalyzes cholesterol 7α-hydroxylation. The alternative pathway starts with 27-hydroxylation of cholesterol by mitochondrial Cyp27a1, and involves 7α-hydroxylases Cyp7b1 and Cyp39a1. Cyp8b1, a 12α-hydroxylase, is required for cholic acid formation (Chiang, 2003). The expression of BA-synthetic enzymes (Cyp7a1 and Cyp8b1) is transcriptionally suppressed by BA-mediated feedback inhibition via two mechanisms. 1) FXR activation by BAs in liver induces small heterodimer partner (SHP), which suppresses the transactivation of BA-synthetic genes by liver receptor homolog-1 (LRH-1) (Goodwin et al., 2000). 2) FXR activation by BAs in intestine induces fibroblast growth factor 15 (Fgf15), an intestinal hormone that travels to the liver, where it interacts with its receptor Fgfr4 and inhibits BA synthesis (Inagaki et al., 2005).
BA transporters play crucial roles in facilitating the “enterohepatic circulation” (EHC) of BAs. In liver, conjugated BAs are taken up by the Na+/taurocholate cotransporting polypeptide (Ntcp) (Anwer, 2004), whereas unconjugated BAs by the organic anion transporting polypeptide 1b2 (Oatp1b2) (Csanaky et al., 2011), and BAs are effluxed into bile canaliculi by the bile salt export pump (Bsep) (Wang et al., 2001). At the end of small intestine (SI), BAs are reabsorbed by the apical sodium-dependent bile acid transporter (Asbt) (Dawson et al., 2003), transferred from the apical to basolateral membrane by the ileal BA binding protein (Ibabp) (Grober et al., 1999), and pumped into portal blood by the organic solute transporter heterodimer Ostα and Ostβ (Ballatori et al., 2008; Rao et al., 2008).
Previous reports about the effect of glucose and insulin signaling on BA metabolism are mainly on the regulation of the rate-limiting enzyme Cyp7a1 (Park and Pak, 2011; Li et al., 2012). Insulin suppresses the transcription of Cyp7a1, and therefore Cyp7a1 expression increases during fasting and decreases when fasted mice are re-fed (De Fabiani et al., 2003; Ponugoti et al., 2007). During CR, which resembles intermittent fasting and re-feeding cycles, the nutrient intake is restricted, and thus glucose and insulin levels are lower (Pasiakos et al., 2011). Therefore, it is hypothesized that CR can increase Cyp7a1 expression and thus likely BA concentrations. Increased bile flow was previously reported in CR rats (Tuchweber et al., 1987). However, how CR affects the concentrations of individual BAs as well as the BA composition is not known. Therefore, the present study aimed to systematically investigate the effect of CR on BA homeostasis using a “dose-response” model of CR (0, 15, 30, or 40%). BA profiling was performed in various compartments of the EHC following an improved UPLC-MS/MS method that was recently established in our laboratory. Furthermore, the expression of BA-related genes was determined to provide possible regulatory mechanisms for BA alterations by CR.
Materials and methods
Chemicals and Reagents
The sources of individual BA standards and internal standards were described previously (Zhang and Klaassen, 2010). All other chemicals and reagents, unless indicated, were purchased from Sigma-Aldrich (St. Louis, MO).
Animal Experiments and Study Design
Only male mice were used for this study. The majority of previous reports about CR have used male mice. Limited information is available on CR female mice, providing little evidence for design of percentages of CR that produce beneficial effects. Female mice have lower body weight compared to their age-matched male counterparts, and thus have varied ability to sustain CR. This leads to the technical difficulty of using female mice in a short-term CR study, which involves a rapid decrease in body weight within a relatively short period of time during preparation feeding. Furthermore, it is technically challenging to include mice of both genders in this “dose-response” study for “side-by-side” comparison, because of the extensive workload to perform CR on such large number of animals.
Mice were housed in an AAALAC-accredited facility at the University of Kansas Medical Center, with a 14-h light/10-h dark-cycle, temperature-, and humidity-controlled environment and ad libitum access to water. These studies were approved by the Institutional Animal Care and Use Committee at the University of Kansas Medical Center.
Previous studies on CR usually use one percentage of CR (15–60% CR) and various feeding regimes and diet formulae (Faulks et al., 2006; Yoshida et al., 2006; Rocha et al., 2007; Boily et al., 2008; Kim et al., 2008; Niemann et al., 2008; Yamamoto et al., 2009). Therefore, in order to determine which percentage of CR altered BA homeostasis, a “dose-response” CR model was utilized. The scheme of the current study design is illustrated in Fig. 1. Male C57BL/6 mice (3-month old) were purchased from Charles River Laboratories (Wilmington, MA), fed with purified AIN-93M diet (TD94048, Harlan Teklad, Madison, WI) for one week, and then randomly divided into four experimental groups, namely ad libitum (AL), 15% CR, 30% CR, and 40% CR (n=5). All mice were housed individually, and the AL control mice were given ad libitum access to TD94048 diet throughout this study. The diet consumption of the AL group was recorded daily, and subsequently 85%, 70%, and 60% of this amount were given to 15%, 30%, and 40% CR groups, respectively, for one month. Similar rationale of using short-term CR to recapitulate long-term effects (Cao et al., 2001; Estep et al., 2009) and designing enriched diets for CR animals (Lee et al., 2002; Barger et al., 2008; Nogueira et al., 2012) was published previously. Feed was provided between 17:00–18:00 daily. CR mice finished their daily feed within 2 hours after feeding. In order to prevent sudden weight loss, a gradual decrease in feed was provided to the mice one week before the start of CR feeding (Fig. 1B). In order to prevent malnutrition, which is a common side effect of CR studies (Cerqueira and Kowaltowski, 2010), custom enriched diets TD110466, TD110467, and TD110468 (Harlan Teklad, Madison, WI) were designed to feed 15%, 30%, and 40% CR groups respectively (Supplemental Table 1). Body weights were recorded weekly.
Fig. 1. Scheme of CR study design.
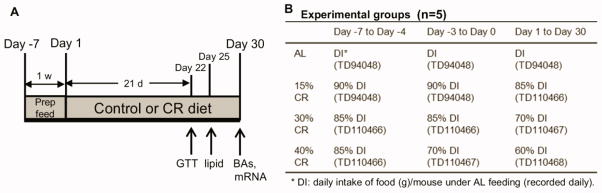
(A) Mice (3-mon old) were randomly divided into four groups, namely AL, 15%, 30%, and 40% CR (n=5). Before the start of 1-mon CR feeding, mice were provided with gradual decrease amount of feed for 1 week. Glucose tolerance test (GTT) was performed on Day 22, and small amount of fasting plasma was drawn by retro-orbital bleeding for lipid quantification on Day 25. On Day 30, all mice were sacrificed and blood and tissues were collected for further quantification of BAs and mRNA expression of BA-related genes. (B) CR mice were fed with decreased amount of feed compared to their AL controls. In addition, proportionally enriched diets were designed and provided to mice under a certain percentage of CR, respectively.
Glucose Tolerance Test
Glucose tolerance test (GTT) was conducted on Day 22 (after 21 days of CR feeding). Before the GTT, the AL mice were fasted for 6 h starting from 8:00, whereas the CR mice had finished their daily feed and literally started fasting around 19:00 the previous evening. A single dose of D-glucose (20% solution in water; 10 mL/kg) was injected i.p. Blood was taken from tails of mice at 0, 30, 60, 90, and 120 min thereafter, and glucose concentrations were determined using a ReliOn Ultima glucose monitor (Arkray USA, Inc., Minneapolis, MN).
Sample Collection
Fasting plasma was collected on Day 25. The AL mice were fasted for 4 h starting from 8:00, whereas the CR mice had finished their daily feed and literally started fasting around 19:00 the previous evening. All mice were anesthetized with pentobarbital (50 mg/kg), and then approximately 100 μL of plasma was collected by retro-orbital bleeding using heparin-coated capillary tubes. Mice were returned to cages after blood was drawn and remained AL or CR feeding for the rest of the study.
At the end of the one-month CR feeding (Day 30), all mice were anesthetized with pentobarbital (50 mg/kg), and serum was collected by retro-orbital bleeding. After cervical dislocation, liver, gallbladder (GB), and ileum were removed, snap-frozen in liquid nitrogen, and stored at −80°C. SI and LI were flushed with 10 mL saline and the intestinal contents were collected separately on ice, and stored at −80°C. Tissue collections were between 9:00 and 12:00 in the morning to decrease the variations due to circadian rhythm of BAs (Zhang et al., 2011b).
Plasma Lipid Parameters
The triglycerides (TG; Pointe Scientific Inc, Canton, MI), total cholesterol (Wako Diagnostics, Richmond, VA), and non-esterified fatty acids (FAs; Wako Diagnostics, Richmond, VA) in fasting plasma were quantified using colorimetric assays according to the manufacturer’s instructions.
Liver Lipid Parameters
Liver lipids were extracted as described (McGrath and Elliott, 1990), and the TG, total cholesterol, and FAs in liver were quantified with the same protocol as plasma lipids.
BA Extraction and Quantification
BAs were extracted from serum and livers (Zhang and Klaassen, 2010), GBs (tissue with bile inside) (Zhang et al., 2011a), as well as SI and LI contents (Zhang et al., 2012b). Ultra-performance liquid chromatography-tandem mass spectrometry (UPLC-MS/MS) was used to quantify 20 individual BAs, including primary and secondary BAs as well as their taurine conjugates (Zhang and Klaassen, 2010). Primary BAs include cholic acid (CA), chenodeoxycholic acid (CDCA), α-muricholic acid (αMCA), and βMCA. Secondary BAs converted from corresponding primary BAs include 1) deoxycholic acid (DCA) from CA, 2) lithocholic acid (LCA) and ursodeoxycholic acid (UDCA) and CDCA, and 3) murideoxycholic acid (MDCA), ωMCA, and hyodeoxycholic acid (HDCA) from αMCA and βMCA (Martin et al., 2007; Hofmann, 2009; Zhang and Klaassen, 2010). The concentrations of individual BAs were summed to derive the concentrations of conjugated, unconjugated, and total BAs, as previously published (Fu et al., 2012).
Total RNA Isolation
Total RNA was isolated from liver and ileum tissues using RNA Bee reagent (Tel-Test Inc., Friendswood, TX) per the manufacturer’s protocol. The concentration of total RNA in each sample was quantified spectrophotometrically at 260 nm.
Multiplex Suspension Assay
The mRNAs of genes encoding BA synthetic enzymes (Cyp7a1, Cyp8b1, Cyp27a1, and Cyp7b1) and BA transporters in liver (Ntcp, Oatp1b2, and Bsep) were quantified by Panomics 2.0 QuantiGene Plex technology (Panomics/Affymetrix Inc., Fremont, CA). Individual gene information can be found on Panomics Web site (http://www.panomics.com) with Panel number 21150. Fluorescence was analyzed using a Bio-Plex 200 system array reader with Luminex 100 X-MAP technology, and data were acquired using Bio-Plex data manager software 5.0 (Bio-Rad, Hercules, CA). The mRNAs of target genes were normalized to Gapdh.
Reverse Transcription and Real-time PCR Analysis
Total RNA was transcribed to single-stranded cDNA using High Capacity cDNA Reverse Transcription Kit 1001073 (Applied Biosystems, Foster City, CA), and then the cDNA products were amplified by PCR, using Power SYBR Green PCR Master Mix in a 7900HT Fast Real-Time PCR System (Applied Biosystems, Foster City, CA). The mRNAs of genes encoding BA conjugating enzymes (BAL and BAT), BA transporters in ileum (Asbt, Ostα, and Ostβ), ileal BA binding protein (Ibabp), and proteins involved in Cyp7a1 regulation (FXR, SHP, Fgf15, and Fgfr4) were quantified, and normalized to β-actin. The sequences of real-time PCR primers (Integrated DNA Technologies, Coralville, IA) are listed in Supplemental Table 2.
Statistical Analysis
Data are presented as mean ± SEM. To compare among AL and three CR groups, data were analyzed by one-way ANOVA, followed by Duncan’s post-hoc test, differences being considered significant at p < 0.05. Due to space limitation on the figures, the authors decided not to show every significant difference between the various groups. Instead, the authors used asterisks (*) to indicate the differences between CR and AL groups. To compare the BA compositions between AL and 40% CR groups, data were analyzed by Student’s t-test, differences being considered significant at p < 0.05.
Results
Body Weight, Glucose, and Lipid Parameters in CR Mice
In order to validate the graded CR model, body weight was recorded weekly. As expected, the body weights of CR mice were lower than AL mice, and they reached a “steady state” by the end of the study (Fig. 2A). Interestingly, the final body weights of 15%, 30%, and 40% CR mice were 15%, 28%, and 38% lower than AL mice, respectively. The health condition of the CR mice was monitored throughout the study, and no malnutrition was apparent. As shown in Fig. 2B, CR mice had better glucose tolerance, evidenced by lower AUCs in the glucose tolerance test (GTT). In addition, 30 and 40% CR mice had lower blood glucose than AL mice before glucose challenge as well, but they were not hypoglycemic. Lipid parameters in serum and liver of AL and CR mice were examined. TG levels in plasma were decreased by 40% CR, and interestingly, the levels in liver were decreased proportionally by CR. Moreover, cholesterol and FA concentrations were decreased by CR in plasma and liver (Fig. 2C).
Fig. 2. Body weight, glucose, and lipid parameters of CR mice.
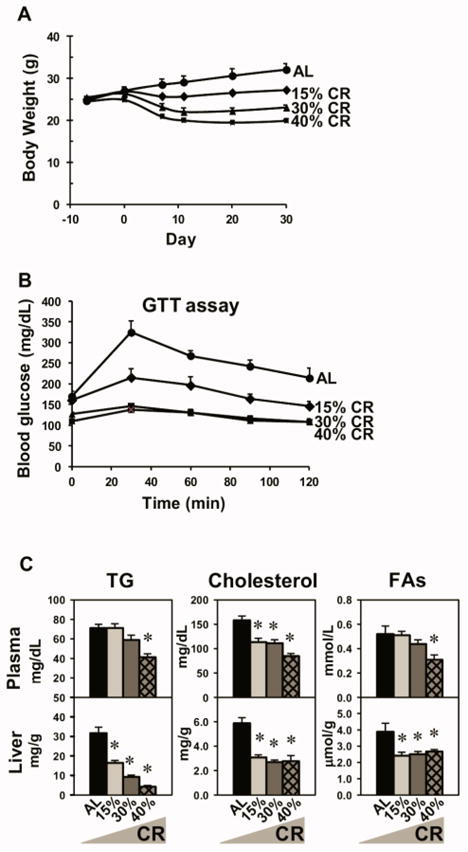
(A) Body weight changes of male mice by graded CR (AL, 15%, 30%, or 40% CR) throughout the study. The body weights of CR mice started to be lower than AL mice after 1 week of CR feeding. (B) GTT. After 6 h of fasting, the basal blood glucose (time 0) was taken. Then a bolus of 20% D-glucose was given (i.p.) and serial glucose levels were taken at indicated time points thereafter. (C) Triglycerides (TG), cholesterol, and fatty acids (FAs) in plasma and liver. Data are presented as means ± SEM of 5 mice. * p < 0.05, by one-way ANOVA, followed by Duncan’s post-hoc test (not shown in A and B panels due to space limit)
Effect of Graded CR on Total BAs in Various Compartments of the Enterohepatic Circulation
Serum, liver, GB, SI, and LI are the major compartments of the EHC of BAs. BA pool size refers to the total amounts of BAs in the whole animal, and it is generally accepted to estimate BA pool size by adding the amounts of BAs in several BA-enriched compartments, including liver, GB, and intestine. Forty percent CR increased BA pool size (162%), due to the increased amount of total BAs in GB (133%) and SI (174%) (Fig. 3, top-left panel). However, CR did not alter the amount of total BAs in liver and LI.
Fig. 3. Effect of graded CR on total BAs in various compartments of the enterohepatic circulation.

(Top left) Total BA amounts in liver, gallbladder (GB), contents of small intestine (SI) and large intestine (LI), as well as total BA pool size in male mice. (Top right) Concentrations of total, taurine-conjugated (T-BAs), unconjugated (U-BAs), primary, and secondary BAs in serum. (Bottom) Amounts of total, conjugated, unconjugated, primary, and secondary BAs in liver, GB, SI, and LI. Data are presented as means ± SEM of 5 mice. * p < 0.05, by one-way ANOVA, followed by Duncan’s post-hoc test.
In serum (Fig. 3, top-right panel), 40% CR increased total BA concentrations (231%). Specifically, 40% CR increased the concentrations of both conjugated (335%) and unconjugated BAs (178%). In addition, 40% CR increased similarly the concentrations of primary (224%) and secondary BAs (233%). In liver (Fig. 3), CR did not alter the amount of conjugated, unconjugated, primary, or secondary BAs. In GBs (Fig. 3), 40% CR increased the amount of conjugated (132%), primary (162%), and secondary BAs (77%), however, CR did not alter the amount of unconjugated BAs. In the SI contents (Fig. 3), 40% CR increased the amount of conjugated (179%), primary (219%), and secondary BAs (94%), however, CR did not alter the amount of unconjugated BAs. In the LI contents (Fig. 3), CR did not alter the amount of conjugated, unconjugated, primary, or secondary BAs.
Concentrations of Individual BAs in Serum of CR Mice
Four BA pathways are defined to aid in reading Fig. 4, each of which involves the primary BA and its secondary BA, as well as their taurine conjugates. For example, the CA pathway involves TCA, TDCA, CA, and DCA. In serum, 40% CR markedly increased the concentrations of TCA (872%), TDCA (over 1100%), and DCA (over 1000%) (Fig. 4). CA was increased by 30% CR (262%), but not by 40% CR. For the CDCA pathway, CR did not alter the concentrations of TCDCA, TLCA, TUDCA, or CDCA in serum, but LCA was increased by both 30% CR (262%) and 40% CR (408%), whereas, UDCA was increased by 30% CR (205%), but not 40% CR. For the αMCA pathway, 30% CR increased concentrations of TαMCA (558%) and αMCA (489%), whereas 40% CR did not alter either. The secondary BAs MDCA and TMDCA were not altered by CR. For the βMCA pathway, CR did not alter the concentrations of BA taurine conjugates (TβMCA, TωMCA, or THDCA) or βMCA. The concentration of ωMCA was increased by both 30% CR (95.6%) and 40% CR (135%), as was HDCA (128% and 169%, respectively).
Fig. 4. Individual BAs in various compartments of the enterohepatic circulation in CR mice.

Four pathways are classified, and each (CA pathway for instance) involves primary BAs (CA), and secondary BAs (DCA), and their taurine conjugates (TCA and TDCA). CA, cholic acid; DCA, deoxycholic acid; CDCA: chenodeoxycholic acid; LCA, lithocholic acid; UDCA, ursodeoxycholic acid; MCA, muricholic acid; MDCA, murideoxycholic acid; HDCA, hyodeoxycholic acid. Data are presented as means ± SEM of 5 mice. * p < 0.05, by one-way ANOVA, followed by Duncan’s post-hoc test.
Amounts of Individual BAs in Livers and Gallbladders of CR Mice
In livers (Fig. 4), for the CA pathway, 30 and 40% CR tended to double the amount of TCA in livers (not statistically different). The amount of TDCA was increased by both 30% CR (222%) and 40% CR (484%). CR did not alter the amount of CA. For the CDCA pathway, 40% CR decreased the amount of TCDCA (45.9%), TUDCA (57.2%), but increased CDCA (146%). CR did not alter the amount of TLCA or UDCA in liver. For the αMCA pathway, CR did not alter the amount of BAs (TαMCA, TMDCA, αMCA, or MDCA) in liver. For the βMCA pathway, 40% CR decreased the amount of βMCA (86.6%) and HDCA (70.0%), but CR did not alter the amount of TβMCA, TωMCA, THDCA, or ωMCA.
In gallbladders (GBs) (Fig. 4), for the CA pathway, 40% CR increased the amount of TCA (355%), TDCA (over 1000%), and DCA (over 1000%), and 15% CR increased the amount of CA (190%). CR did not alter the amount of BAs in the CDCA, αMCA, or βMCA pathways, except a modest increase in αMCA by 15% CR (180%).
Amounts of Individual BAs in Intestinal Contents of CR Mice
In the contents of the small intestines (SI) (Fig. 4), for the CA pathway, 40% CR increased the amount of TCA (506%) and TDCA (over 1800%), 30% CR increased the amount of CA (746%), whereas CR did not alter the amount of DCA. CR did not alter the amount of BAs in the CDCA, αMCA, and βMCA pathways, except modest increases in αMCA (137%) and βMCA (210%) by 30% CR.
In the contents of the large intestines (LI) (Fig. 4), for the CA pathway, 40% CR increased the amount of TCA (694%), TDCA (639%), and DCA (253%), but CR did not alter the amount of CA. CR did not alter the amount of BAs in the CDCA pathway, except the increases in TCDCA (694%) and LCA (145%) by 15% CR. CR did not alter the amount of BAs in the αMCA or βMCA pathways, except decreases in MDCA (64.2%) and βMCA (73.6%) by 30% CR.
Altered Enterohepatic BA Composition by 40% CR
BA compositions in AL and 40% CR groups were analyzed by calculating the proportion of each BA and its taurine conjugates in total BA concentrations. In general, 40% CR increased the proportions of BAs in the CA pathway, but decreased the proportions of BAs in the CDCA, αMCA, and βMCA pathways (Fig. 5). Specifically, 40% CR doubled CA proportions in serum (8.4% to 17.2%), liver (20.5% to 41.1%), GB (26.4% to 53.5%), and SI (26.8% to 58.5%), and tended to increase CA proportion in LI(1.6% to 5.9%; not statistically different). Similarly, 40% CR increased DCA proportions in serum (9.3% to 29.3%), liver (2.7% to 12.1%), GB (2.5% to 7.8%), SI (1.1% to 7.9%), and LI (3.5% to 13.7%). In contrast, 40% CR decreased βMCA proportions in serum (10.9% to 2.9%), liver (26.5% to 13.2%), GB (20.7% to 11.0%), and SI (22.4% to 9.2%). In addition, 40% CR decreased ωMCA proportions in serum (44.1% to 31.9%), liver (22.3% to 14.9%), GB (20.5% to 11.5%), SI (22.6% to 10.0%), and LI (74.8% to 61.4%).
Fig. 5. Altered enterohepatic BA composition by 40% CR.

For instance, the green portion of the pie chart represents the proportion of CA and TCA in total BA concentrations. Data are presented as means of 5 mice. * p < 0.05, by one-way ANOVA, followed by Duncan’s post-hoc test.
Expression of BA-Synthetic and Conjugating Enzymes in Liver of CR Mice
The expression of BA synthetic and conjugating enzymes in liver were quantified in the present study (Fig. 6). In the classic pathway, 40% CR increased the mRNA of the rate-limiting BA-synthetic enzyme Cyp7a1 (228%), but decreased the mRNA of Cyp8b1 (53.8%). In the alternative pathway, CR did not alter Cyp27a1 mRNA level. However, Cyp7b1 was decreased by 40% CR (76.2%), and Cyp39a1 was increased by 40% CR (440%). For BA conjugating enzymes, 40% CR increased BAL mRNA (123%), but CR had little or no effect on BAT mRNA level.
Fig. 6. Expression of BA-synthetic and conjugating enzymes in liver of CR mice.
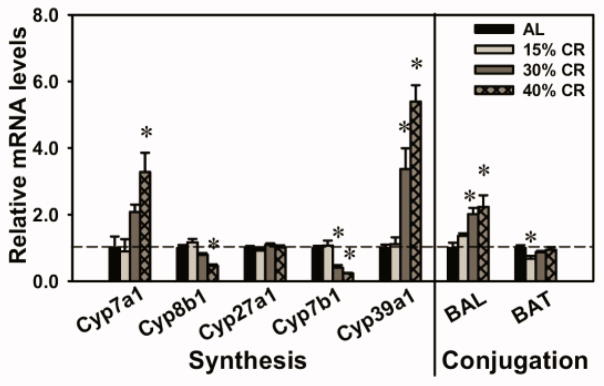
Cyp7a1 and Cyp8b1 are enzymes in the classic pathway for BA synthesis. Cyp7a1 is the rate-limiting enzyme for BA biosynthesis. Cyp27a1, Cyp7b1, and Cyp39a1 are enzymes in the alternative pathway for BA synthesis. BAL and BAT are BA conjugating enzymes. Data are presented as means ± SEM of 5 mice. The mRNAs of each genes in AL mice were set as 1. * p < 0.05, by one-way ANOVA, followed by Duncan’s post-hoc test.
Expression of Regulatory Factors for Cyp7a1 Transcription in Liver and Ileum of CR Mice
The mRNAs of several key regulatory factors for Cyp7a1 transcription in the EHC of BAs were quantified (Fig. 7). Forty percent CR increased the mRNAs of FXR in liver (87.5%) and SHP in ileum (120%). In addition, 40% CR tended to increase the mRNA of Fgf15 in ileum, but was not statistically increased. CR did not alter the mRNA levels of other regulatory factors for Cyp7a1 transcription, such as SHP and Fgfr4 in liver, and FXR in ileum.
Fig. 7. Expression of regulatory factors for Cyp7a1 transcription in liver and ileum of CR mice.
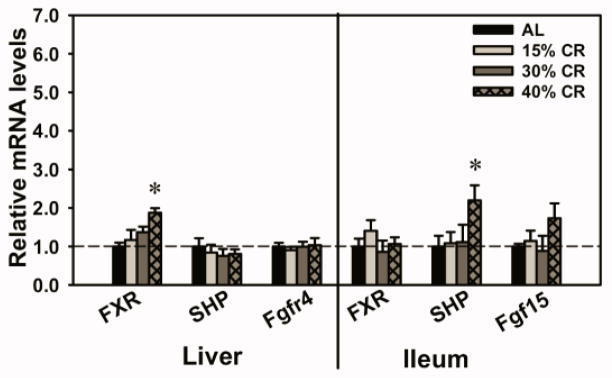
The transcription of Cyp7a1 is regulated by BA-induced feedback inhibition. One proposed mechanism involves BA receptor FXR and its target gene nuclear receptor SHP in liver. The other mechanism involves “enterohepatic communication”, where BAs activate FXR in the intestine, inducing an intestinal hormone Fgf15, which travels through the circulation to the liver and through Fgfr4 down-regulates Cyp7a1 transcription. Data are presented as means ± SEM of 5 mice. The mRNAs of each gene in AL mice were set as 1. * p < 0.05, by one-way ANOVA, followed by Duncan’s post-hoc test.
Expression of BA Transporters in the Enterohepatic Circulation in CR Mice
The expression of BA transporters in liver and ileum was quantified in the present study (Fig. 8). Forty percent CR increased the mRNAs of Ntcp (35%) in liver and Ibabp (206%) in ileum. However, CR did not alter the mRNA levels of other BA transporters, including Oatp1b2 and Bsep in liver, and Asbt, Ostα, and Ostβ in ileum.
Fig. 8. Expression of BA transporters in the enterohepatic circulation in CR mice.
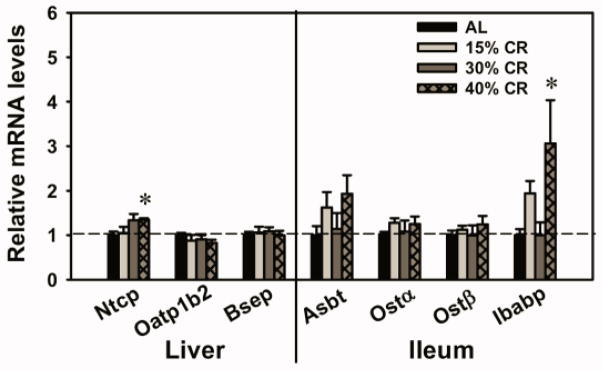
In liver, BA transporters include uptake transporters Ntcp extracts conjugated BAs and Oatp1b2 extracts unconjugated BAs into hepatocytes, and the BA efflux transporter Bsep pumps out BAs into canalicular bile. In ileum, the BA uptake transporter Asbt mediates the reabsorption of BAs from the intestinal lumen into ileocytes, the BA binding protein Ibabp mediates the intracellular transfer of BAs from apical to basolateral side of ileocyte membrane, and the BA efflux transporter Ostα/β pumps BAs out into portal blood. Data are presented as means ± SEM of 5 mice. The mRNAs of each gene in AL group were set as 1. * p < 0.05, by one-way ANOVA, followed by Duncan’s post-hoc test.
Discussion
The present study is the first to comprehensively characterize BA profiles in various compartments of the EHC using a “dose-response” CR model. In general, 15% CR is not sufficient to change most BAs, and 30% CR produces significant changes for some BAs. Obviously, 40% CR produces the most abundant and predominant changes.
Increased BA pool size by CR and increased expression of BA-related genes
The BA pool size usually maintains relatively constant. Interestingly, this study identifies an increase (162%) in BA pool size by 40% CR (Fig. 3). The increase in BA pool size by CR is mainly due to increase of BAs in the SI. It is noteworthy that the ratio of BAs in liver, GB, and intestine is approximately 1:2:20 under normal conditions. CR results in various changes in total BAs in these compartments. Specifically, 40% CR increases total BAs in GB and SI, but does not alter those in liver or LI. In addition, 30 and 40% CR increase total BA concentrations in serum, which might be associated with possible systemic effects (such as TGR5 activation in muscle).
CR-induced BA increase correlates with changes in the expression of BA-related genes. Cyp7a1 plays the leading role in determining BA synthesis and BA pool size (Li et al., 2011). In this study, 40% CR increases Cyp7a1 expression (Fig. 6), which correlates with the increase in BA pool size (Fig. 3). This finding indicates that the Cyp7a1 increase probably contributes to the CR-induced increase in BA pool size. In addition, the increase in BAL expression by CR (Fig. 6), correlates with the increases in the proportions of taurine-conjugated BAs in serum, liver, and SI contents (Fig. 5). Furthermore, 40% CR increases the expression of Ibabp (Fig. 8), which is part of the regulatory machinery for BA reabsorption in the ileum. In summary, increased expression of Cyp7a1, BAL, and Ibabp by CR appears to be responsible for the increase in BA pool size during CR. One should be cautious when drawing conclusions from these mRNA data. Protein activity assays are needed to confirm whether CR increases the BA synthesis, conjugation, or reasborption. For instance, an everted gut sac method may provide valuable information on possible changes of BA reabsorption in the ileum by CR.
Increased individual BAs by CR
In the “dose-response” model, CR increases several individual BAs in a “calorie-dependent” manner (Fig. 4). It appears that CA and its secondary BA (DCA) have the highest inverse correlation to calorie intake. In general, secondary BAs (such as DCA, LCA, ωMCA, and HDCA) increase more than primary BAs after CR. This suggests that the gut microbiome may play a role in determining the BA composition during CR, especially in the intestinal lumen. Currently, there is a lack of information on whether CR alters gut microflora, and which individual intestinal bacterial genus is responsible for the production of each secondary BAs. In future studies, it would be informative to characterize the changes of gut microflora by CR and correlate it to the changes in the BA profile.
BAs, as natural detergents, are considered cytotoxic at high concentrations (Hofmann, 1999). The CR-induced increase in serum total BAs (Fig. 3) is hundreds of magnitudes lower than that observed in the bile duct ligation-induced cholestatic mice (Zhang et al., 2012a). Low serum alanine aminotransferase activity (below 50 IU/L) in all groups of mice in the present study (data not shown) confirms that the CR-induced BA increases have not reached the concentration to cause hepatotoxicity.
Increased 12α-hydroxylated BAs by CR correlated with improved glucose and lipid parameters
CR leads to interesting changes in BA composition in various compartments of the EHC (Fig. 5), namely increasing the proportions of BAs in the CA pathway (namely CA and DCA), and decreasing the proportions of BAs in MCA pathway (namely α-, β-, and ωMCAs). This is exactly opposite to the BA composition changes observed during aging, which is increased proportion of βMCA and decreased proportion of DCA as previously published by our laboratory (Fu et al., 2012). One major difference of BAs in the CA pathway compared to those in MCA pathway is that both CA and DCA have 12α-hydroxyl groups, whereas the MCAs do not. Our finding on the correlation of increased proportions of 12α-hydroxylated BAs and improved insulin sensitivity and decreased lipid parameters (Fig. 2B and 2C) in CR mice is consistent with the previous report that impaired generation of 12α-hydroxylated BAs was associated with dyslipidemia and insulin resistance (Haeusler et al., 2012). Therefore, our study suggests the possible role of BA composition in regulating glucose and lipid metabolism.
CR-induced alterations in BA composition may lead to changes in the activation of the BA receptor TGR5. Individual BAs have various potencies for TGR5 activation: LCA > DCA > CDCA > CA (Chen et al., 2011). CR markedly increased DCA concentration and the proportion of DCA, which may lead to increased TGR5 activation. In future studies, it would be informative to quantify TGR5 targets (cAMP level and deiodinase 2) to determine changes of TGR5 activation during CR, as well as its relationship to energy expenditure in adipose and muscle tissue.
Feminized mRNA profiles of gender-divergently expressed BA-synthetic enzymes by CR
Some BA synthetic enzymes have gender-divergent expression in liver. Both Cyp8b1 and Cyp7b1 are expressed higher in male than female mice (Fu et al., 2012), which is opposite to Cyp39a1 (female > male) (Li-Hawkins et al., 2000a). Interestingly, the expression of Cyp8b1 and Cyp7b1 were decreased by CR, whereas Cyp39a1 was increased (Fig. 6). This appears to be attributable to feminization of the liver by CR. Previous reports have shown that CR can feminize genome-wide gene expression in male mice (Estep et al., 2009) and long-lived mice have lost the sex dimorphism of gene expression (Amador-Noguez et al., 2005). Therefore, the current finding of CR-induced feminization of some BA synthetic enzymes suggests that the connection between feminization and longevity is an interesting area of research.
FXR signaling in the regulation of BA synthetic enzymes during CR
Expression of BA-synthetic enzymes is feedback inhibited through two major mechanisms, namely the liver FXR-SHP pathway and the intestinal FXR-Fgf15 pathway. Recent data suggest that FXR-SHP plays a minor role in suppressing Cyp7a1, but is more important in Cyp8b1 suppression, whereas Fgf15 is important for both Cyp7a1 and 8b1 regulation (Kim et al., 2007; Kong et al., 2012). Expression of the FXR target gene SHP in liver is not altered by CR (Fig. 7), indicating that FXR activation by BAs in liver remains constant during CR. This correlates with the observation that CR does not alter the amounts of total BAs in liver (Fig. 3). In ileum, the expression of SHP is increased by CR, and another FXR target, Fgf15, has the tendency to increase although there is no statistical significance (Fig. 7). Moreover, the ileal bile acid-binding protein (Ibabp), a classic marker for FXR activation in ileum, also has increased expression during CR. Together, these findings indicate that FXR activation in ileum is likely increased by CR. This may be due to increased amounts of total BAs in the SI (Fig. 3). In summary, CR appears to increase FXR activation in intestine, and thus mediate feedback inhibition of Cyp8b1.
It is noteworthy that little or no feedback inhibition of Cyp7a1 is observed, indicating the possibility of an intrinsic induction of Cyp7a1 expression by CR, which may mask the FXR-mediated feedback inhibition of Cyp7a1, if any. The basal level of Cyp7a1 transcription is regulated by several factors, such as LXR, HNF4α, PGC-1α, and SREBP1c, which sense nutrient levels, such as glucose, oxysterols, cholesterol, as well as insulin. During fasting or high glucagon levels, the cAMP response element binding protein induces gluconeogenesis through PGC1α (Herzig et al., 2001), meanwhile PGC-1α binding to HNF4 increases, which leads to increased promoter-mediated Cyp7a1 transcription (De Fabiani et al., 2003; Shin et al., 2003). In contrast, during feeding or when there are high insulin levels, SREBP-1c, an insulin-induced lipogenic factor, competes with PGC-1α for binding to HNF4, thus inhibiting the transcription of Cyp7a1 (Ponugoti et al., 2007). In the present study, 40% CR increases PGC1α mRNA expression (157%) (data not shown), and whether this leads to promoter-mediated Cyp7a1 transcription increase by CR remains to be investigated.
Because of the difficulty in reasonable study design for percentage of CR in female mice as well as the extensive workload to perform the “dose-response” CR studies in both male and female mice for comparison, the current study has used only male mice. For future studies, it would be informative to perform the same studies in female mice to determine whether there is any gender-specificity in the regulation of BA homeostasis by CR in mice.
In conclusion, the present study demonstrates that short-term CR increases BAs in male mice, possibly through orchestrated increases in BA synthesis and conjugation in liver and intracellular transport in ileum (Fig. 9). This study also provides valuable information on the correlation of BA composition (for instance, increased ratio of 12α- vs non-12α-OH BAs) and improved glucose and lipid homeostasis.
Fig. 9. Schematic view of the regulation of BA homeostasis by CR.

CR increases BA pool size, which is likely due to increased BA synthesis (Cyp7a1) and conjugation (BAL) as well as intestinal BA reabsorption (Ibabp). Amounts of total BAs are increased by CR in gallbladder and small intestine, but remain relatively constant in liver.
Supplementary Material
Highlights.
Dose response effects of short-term CR on BA homeostasis in male mice.
CR increased the BA pool size and many individual BAs.
CR altered BA composition (increased proportion of 12α-hydroxylated BAs).
Increased mRNAs of BA enzymes in liver (Cyp7a1 and BAL) and ileal BA binding protein.
Acknowledgments
The authors would like to give acknowledgement to Udayan Apte, PhD, DABT for his suggestion on designing the calorie restriction study, Judith Larson, D.V.M. for her help with monitoring the health conditions of mice throughout the study, and all lab members for their help with tissue collection and critical review of the manuscript.
Abbreviations
- AL
ad libitum
- Asbt
apical sodium-dependent bile acid transporter
- BA
bile acid
- BAL
bile acid-CoA ligase
- BAT
bile acid-CoA: amino acid N-acyltransferase
- Bsep
bile salt export pump
- CA
cholic acid
- CDCA
chenodeoxycholic acid
- CR
calorie restriction
- DCA
deoxycholic acid
- EHC
enterohepatic circulation
- Fgf
fibroblast growth factor
- FXR
farnesoid X receptor
- GB
gallbladder
- HDCA
hyodeoxycholic acid
- Ibabp
ileal bile acid binding protein
- LCA
lithocholic acid
- LI
large intestine
- MCA
muricholic acid
- MDCA
murideoxycholic acid
- Ntcp
Na+/taurocholate cotransporting polypeptide
- Oatp
organic anion transporting polypeptide
- Ost
organic solute transporter
- SHP
small heterodimer partner
- SI
small intestine
- T-BA
taurine-conjugated bile acid
- U-BA
unconjugated bile acid
- UDCA
ursodeoxycholic acid
- UPLC-MS/MS
ultra-performance liquid chromatography-tandem mass spectrometry
Footnotes
Publisher's Disclaimer: This is a PDF file of an unedited manuscript that has been accepted for publication. As a service to our customers we are providing this early version of the manuscript. The manuscript will undergo copyediting, typesetting, and review of the resulting proof before it is published in its final citable form. Please note that during the production process errors may be discovered which could affect the content, and all legal disclaimers that apply to the journal pertain.
References
- Amador-Noguez D, Zimmerman J, Venable S, Darlington G. Gender-specific alterations in gene expression and loss of liver sexual dimorphism in the long-lived Ames dwarf mice. Biochem Biophys Res Commun. 2005;332:1086–1100. doi: 10.1016/j.bbrc.2005.05.063. [DOI] [PubMed] [Google Scholar]
- Anwer MS. Cellular regulation of hepatic bile acid transport in health and cholestasis. Hepatology. 2004;39:581–590. doi: 10.1002/hep.20090. [DOI] [PubMed] [Google Scholar]
- Ballatori N, Fang F, Christian WV, Li N, Hammond CL. Ostalpha-Ostbeta is required for bile acid and conjugated steroid disposition in the intestine, kidney, and liver. Am J Physiol Gastrointest Liver Physiol. 2008;295:G179–G186. doi: 10.1152/ajpgi.90319.2008. [DOI] [PMC free article] [PubMed] [Google Scholar]
- Barger JL, Kayo T, Vann JM, Arias EB, Wang J, Hacker TA, Wang Y, Raederstorff D, Morrow JD, Leeuwenburgh C, Allison DB, Saupe KW, Cartee GD, Weindruch R, Prolla TA. A low does of dietary resveratrol partially mimics calorie restriction and retards aging parameters in mice. PLoS One. 2008;3:e2264. doi: 10.1371/journal.pone.0002264. [DOI] [PMC free article] [PubMed] [Google Scholar]
- Boily G, Seifert EL, Bevilacqua L, He XH, Sabourin G, Estey C, Moffat C, Crawford S, Saliba S, Jardine K, Xuan J, Evans M, Harper ME, McBurney MW. SirT1 regulates energy metabolism and response to caloric restriction in mice. PLoS One. 2008;3:e1759. doi: 10.1371/journal.pone.0001759. [DOI] [PMC free article] [PubMed] [Google Scholar]
- Cao SX, Dhahbi JM, Mote PL, Spindler SR. Genomic profiling of short- and long-term caloric restriction effects in the liver of aging mice. Proc Natl Acad Sci U S A. 2001;98:10630–10635. doi: 10.1073/pnas.191313598. [DOI] [PMC free article] [PubMed] [Google Scholar]
- Cerqueira FM, Kowaltowski AJ. Commonly adopted caloric restriction protocols often involve malnutrition. Ageing research reviews. 2010;9:424–430. doi: 10.1016/j.arr.2010.05.002. [DOI] [PubMed] [Google Scholar]
- Chen X, Lou G, Meng Z, Huang W. TGR5: a novel target for weight maintenance and glucose metabolism. Exp Diabetes Res. 2011;2011:853501. doi: 10.1155/2011/853501. [DOI] [PMC free article] [PubMed] [Google Scholar]
- Chiang JY. Regulation of bile acid synthesis. Front Biosci. 1998;3:d176–193. doi: 10.2741/a273. [DOI] [PubMed] [Google Scholar]
- Chiang JY. Bile acid regulation of hepatic physiology: III. Bile acids and nuclear receptors. Am J Physiol Gastrointest Liver Physiol. 2003;284:G349–356. doi: 10.1152/ajpgi.00417.2002. [DOI] [PubMed] [Google Scholar]
- Claudel T, Staels B, Kuipers F. The Farnesoid X receptor: a molecular link between bile acid and lipid and glucose metabolism. Arterioscler Thromb Vasc Biol. 2005;25:2020–2030. doi: 10.1161/01.ATV.0000178994.21828.a7. [DOI] [PubMed] [Google Scholar]
- Csanaky IL, Lu H, Zhang Y, Ogura K, Choudhuri S, Klaassen CD. Organic anion-transporting polypeptide 1b2 (Oatp1b2) is important for the hepatic uptake of unconjugated bile acids: Studies in Oatp1b2-null mice. Hepatology. 2011;53:272–281. doi: 10.1002/hep.23984. [DOI] [PMC free article] [PubMed] [Google Scholar]
- Dawson PA, Haywood J, Craddock AL, Wilson M, Tietjen M, Kluckman K, Maeda N, Parks JS. Targeted deletion of the ileal bile acid transporter eliminates enterohepatic cycling of bile acids in mice. J Biol Chem. 2003;278:33920–33927. doi: 10.1074/jbc.M306370200. [DOI] [PubMed] [Google Scholar]
- De Fabiani E, Mitro N, Gilardi F, Caruso D, Galli G, Crestani M. Coordinated control of cholesterol catabolism to bile acids and of gluconeogenesis via a novel mechanism of transcription regulatioin linked to the fasted-to-fed cycle. J Biol Chem. 2003;278:39124–39132. doi: 10.1074/jbc.M305079200. [DOI] [PubMed] [Google Scholar]
- Estep PW, 3rd, Warner JB, Bulyk ML. Short-term calorie restriction in male mice feminizes gene expression and alters key regulators of conserved aging regulatory pathways. PloS one. 2009;4:e5242. doi: 10.1371/journal.pone.0005242. [DOI] [PMC free article] [PubMed] [Google Scholar]
- Faulks SC, Turner N, Else PL, Hulbert AJ. Calorie restriction in mice: effects on body composition, daily activity, metabolic rate, mitochondrial reactive oxygen species production, and membrane fatty acid composition. J Gerontol A Biol Sci Med Sci. 2006;61:781–794. doi: 10.1093/gerona/61.8.781. [DOI] [PubMed] [Google Scholar]
- Forman BM, Goode E, Chen J, Oro AE, Bradley DJ, Perimann T, Noonan DJ, Burka LT, McMorris T, Lamph WW, Evans RM, Weinberger C. Identification of a nuclear receptor that is activated by farnesol metabolites. Cell. 1995;81:687–693. doi: 10.1016/0092-8674(95)90530-8. [DOI] [PubMed] [Google Scholar]
- Fu ZD, Csanaky IL, Klaassen CD. Gender-divergent profile of bile acid homeostasis during aging of mice. PLoS One. 2012;7:e32551. doi: 10.1371/journal.pone.0032551. [DOI] [PMC free article] [PubMed] [Google Scholar]
- Goodwin B, Jones SA, Price RR, Watson MA, McKee DD, Moore LB, Galardi C, Wilson JG, Lewis MC, Roth ME, Maloney PR, Willson TM, Kliewer SA. A regulatory cascade of the nuclear receptors FXR, SHP-1, and LRH-1 represses bile acid biosynthesis. Mol Cell. 2000;6:517–526. doi: 10.1016/s1097-2765(00)00051-4. [DOI] [PubMed] [Google Scholar]
- Grober J, Zaghini I, Fujii H, Jones SA, Kliewer SA, Willson TM, Ono T, Besnard P. Identification of a bile acid-responsive element in the human ileal bile acid-binding protein gene. Involvement of the farnesoid X receptor/9-cis-retinoic acid receptor heterodimer. J Biol Chem. 1999;274:29749–29754. doi: 10.1074/jbc.274.42.29749. [DOI] [PubMed] [Google Scholar]
- Haeusler RA, Pratt-Hyatt M, Welch CL, Klaassen CD, Accili D. Impaired generation of 12-hydroxylated bile acids links hepatic insulin signaling with dyslipidemia. Cell Metab. 2012;15:65–74. doi: 10.1016/j.cmet.2011.11.010. [DOI] [PMC free article] [PubMed] [Google Scholar]
- Herzig S, Long F, Jhala US, Hedrick S, Quinn R, Bauer A, Rudolph D, Schutz G, Yoon C, Puigserver P, Spiegelman B, Montminy M. CREB regulates hepatic gluconeogenesis through the coactivator PGC-1. Nature. 2001;413:179–183. doi: 10.1038/35093131. [DOI] [PubMed] [Google Scholar]
- Hofmann AF. Bile acids: the good, the bad, and the ugly. News Physiol Sci. 1999;14:24–29. doi: 10.1152/physiologyonline.1999.14.1.24. [DOI] [PubMed] [Google Scholar]
- Hofmann AF. The enterohepatic circulation of bile acids in mammals: form and functions. Front Biosci. 2009;14:2584–2598. doi: 10.2741/3399. [DOI] [PubMed] [Google Scholar]
- Inagaki T, Choi M, Moschetta A, Peng L, Cummins CL, McDonald JG, Luo G, Jones SA, Goodwin B, Richardson JA, Gerard RD, Repa JJ, Mangelsdorf DJ, Kliewer SA. Fibroblast growth factor 15 functions as an enterohepatic signal to regulate bile acid homeostasis. Cell Metab. 2005;2:217–225. doi: 10.1016/j.cmet.2005.09.001. [DOI] [PubMed] [Google Scholar]
- Kawamata Y, Fujii R, Hosoya M, Harada M, Yoshida H, Miwa M, Fukusumi S, Habata Y, Itoh T, Shintani Y, Hinuma S, Fujisawa Y, Fujino M. A G protein-coupled receptor responsive to bile acids. J Biol Chem. 2003;278:9435–9440. doi: 10.1074/jbc.M209706200. [DOI] [PubMed] [Google Scholar]
- Kim I, Ahn SH, Inagaki T, Choi M, Ito S, Guo GL, Kliewer SA, Gonzalez FJ. Differential regulation of bile acid homeostasis by the farnesoid X receptor in liver and intestine. J Lipid Res. 2007;48:2664–2672. doi: 10.1194/jlr.M700330-JLR200. [DOI] [PubMed] [Google Scholar]
- Kim JH, Kwak HB, Leeuwenburgh C, Lawler JM. Lifelong exercise and mild (8%) caloric restriction attenuate age-induced alterations in plantaris muscle morphology, oxidative stress and IGF-1 in the Fischer-344 rat. Exp Gerontol. 2008;43:317–329. doi: 10.1016/j.exger.2007.12.012. [DOI] [PMC free article] [PubMed] [Google Scholar]
- Kong B, Wang L, Chiang JY, Zhang Y, Klaassen CD, Guo GL. Mechanism of tissue-specific farnesoid X receptor in suppressing the expression of genes in bile-acid synthesis in mice. Hepatology. 2012;56:1034–1043. doi: 10.1002/hep.25740. [DOI] [PMC free article] [PubMed] [Google Scholar]
- Lefebvre P, Cariou B, Lien F, Kuipers F, Staels B. Role of bile acids and bile acid receptors in metabolic regulation. Physiol Rev. 2009;89:147–191. doi: 10.1152/physrev.00010.2008. [DOI] [PubMed] [Google Scholar]
- Li T, Francl JM, Boehme S, Ochoa A, Zhang Y, Klaassen CD, Erickson SK, Chiang JY. Glucose and insulin induction of bile acid synthesis: mechanisms and implication in diabetes and obesity. J Biol Chem. 2012;287:1861–1873. doi: 10.1074/jbc.M111.305789. [DOI] [PMC free article] [PubMed] [Google Scholar]
- Li T, Matozel M, Boehme S, Kong B, Nilsson LM, Guo G, Ellis E, Chiang JY. Overexpression of cholesterol 7alpha-hydroxylase promotes hepatic bile acid synthesis and secretion and maintains cholesterol homeostasis. Hepatology. 2011;53:996–1006. doi: 10.1002/hep.24107. [DOI] [PMC free article] [PubMed] [Google Scholar]
- Makishima M, Okamoto AY, Repa JJ, Tu H, Learned RM, Luk A, Hull MV, Lustig KD, Mangelsdorf DJ, Shan B. Identification of a nuclear receptor for bile acids. Science. 1999;284:1362–1365. doi: 10.1126/science.284.5418.1362. [DOI] [PubMed] [Google Scholar]
- Martin FP, Dumas ME, Wang Y, Legido-Quigley C, Yap IK, Tang H, Zirah S, Murphy GM, Cloarec O, Lindon JC, Sprenger N, Fay LB, Kochhar S, van Bladeren P, Holmes E, Nicholson JK. A top-down systems biology view of microbiome-mammalian metabolic interactions in a mouse model. Mol Syst Biol. 2007;3:112. doi: 10.1038/msb4100153. [DOI] [PMC free article] [PubMed] [Google Scholar]
- McGrath LT, Elliott RJ. Lipid analysis and fatty acid profiles of individual arterial atherosclerotic plaques. Anal Biochem. 1990;187:273–276. doi: 10.1016/0003-2697(90)90456-j. [DOI] [PubMed] [Google Scholar]
- Niemann B, Silber RE, Rohrbach S. Age-specific effects of short- and long-term caloric restriction on the expression of adiponectin and adiponectin receptors: influence of intensity of food restriction. Exp Gerontol. 2008;43:706–713. doi: 10.1016/j.exger.2008.02.008. [DOI] [PubMed] [Google Scholar]
- Nogueira LM, Lavigne JA, Chandramouli GV, Lui H, Barrett JC, Hursting SD. Dose-dependent effects of calorie restriction on gene expression, metabolism, and tumor progression are partially mediated by insulin-like growth factor-1. Cancer Med. 2012;1:275–288. doi: 10.1002/cam4.23. [DOI] [PMC free article] [PubMed] [Google Scholar]
- Park WH, Pak YK. Insulin-dependent suppression of cholesterol 7α-hydroxylase is a possible link between glucose and cholesterol metabolisms. Exp Mol Med. 2011;43:571–579. doi: 10.3858/emm.2011.43.10.064. [DOI] [PMC free article] [PubMed] [Google Scholar]
- Parks DJ, Blanchard SG, Bledsoe RK, Chandra G, Consler TG, Kliewer SA, Stimmel JB, Willson TM, Zavacki AM, Moore DD, Lehmann JM. Bile acids: natural ligands for an orphan nuclear receptor. Science. 1999;284:1365–1368. doi: 10.1126/science.284.5418.1365. [DOI] [PubMed] [Google Scholar]
- Pasiakos SM, Caruso CM, Kellogg MD, Kramer FM, Lieberman HR. Appetite and endocrine regulators of energy balance after 2 days of energy restriction: insulin, leptin, ghrelin, and DHEA-S. Obesity. 2011;19:1124–1130. doi: 10.1038/oby.2010.316. [DOI] [PubMed] [Google Scholar]
- Ponugoti B, Fang S, Kemper JK. Functional interaction of hepatic nuclear factor-4 and peroxisome proliferator-activated receptor-gamma coactivator 1alpha in CYP7A1 regulation is inhibited by a key lipogenic activator, sterol regulatory element-binding protein-1c. Mol Endocrinol. 2007;21:2698–2712. doi: 10.1210/me.2007-0196. [DOI] [PubMed] [Google Scholar]
- Ramsey JJ, Colman RJ, Binkley NC, Christensen JD, Gresl TA, Kemnitz JW, Weindruch R. Dietary restriction and aging in rhesus monkeys: the University of Wisconsin study. Exp Gerontol. 2000;35:1131–1149. doi: 10.1016/s0531-5565(00)00166-2. [DOI] [PubMed] [Google Scholar]
- Rao A, Haywood J, Craddock AL, Belinsky MG, Kruh GD, Dawson PA. The organic solute transporter alpha-beta, Ostalpha-Ostbeta, is essential for intestinal bile acid transport and homeostasis. Proc Natl Acad Sci U S A. 2008;105:3891–3896. doi: 10.1073/pnas.0712328105. [DOI] [PMC free article] [PubMed] [Google Scholar]
- Ridlon JM, Kang DJ, Hylemon PB. Bile salt biotransformations by human intestinal bacteria. J Lipid Res. 2006;47:241–259. doi: 10.1194/jlr.R500013-JLR200. [DOI] [PubMed] [Google Scholar]
- Rocha JS, Bonkowski MS, de Franca LR, Bartke A. Effects of mild calorie restriction on reproduction, plasma parameters and hepatic gene expression in mice with altered GH/IGF-I axis. Mech Ageing Dev. 2007;128:317–331. doi: 10.1016/j.mad.2007.02.001. [DOI] [PubMed] [Google Scholar]
- Russell DW. The enzymes, regulation, and genetics of bile acid synthesis. Annu Rev Biochem. 2003;72:137–174. doi: 10.1146/annurev.biochem.72.121801.161712. [DOI] [PubMed] [Google Scholar]
- Shin DJ, Campos JA, Gil G, Osborne TF. PGC-1alpha activates CYP7A1 and bile acid biosynthesis. J Biol Chem. 2003;278:50047–50052. doi: 10.1074/jbc.M309736200. [DOI] [PubMed] [Google Scholar]
- Wang H, Chen J, Hollister K, Sowers LC, Forman BM. Endogenous bile acids are ligands for the nuclear receptor FXR/BAR. Mol Cell. 1999;3:543–553. doi: 10.1016/s1097-2765(00)80348-2. [DOI] [PubMed] [Google Scholar]
- Wang R, Salem M, Yousef IM, Tuchweber B, Lam P, Childs SJ, Helgason CD, Ackerley C, Phillips MJ, Ling V. Targeted inactivation of sister of P-glycoprotein gene (spgp) in mice results in nonprogressive but persistent intrahepatic cholestasis. Proc Natl Acad Sci U S A. 2001;98:2011–2016. doi: 10.1073/pnas.031465498. [DOI] [PMC free article] [PubMed] [Google Scholar]
- Watanabe M, Houten SM, Mataki C, Christoffolete MA, Kim BW, Sato H, Messaddeq N, Harney JW, Ezaki O, Kodama T, Schoonjans K, Bianco AC, Auwerx J. Bile acids induce energy expenditure by promoting intracellular thyroid hormone activation. Nature. 2006;439:484–489. doi: 10.1038/nature04330. [DOI] [PubMed] [Google Scholar]
- Yamamoto Y, Tanahashi T, Kawai T, Chikahisa S, Katsuura S, Nishida K, Teshima-Kondo S, Sei H, Rokutan K. Changes in behavior and gene expression induced by caloric restriction in C57BL/6 mice. Physiol Genomics. 2009;39:227–235. doi: 10.1152/physiolgenomics.00082.2009. [DOI] [PubMed] [Google Scholar]
- Yoshida K, Hirabayashi Y, Watanabe F, Sado T, Inoue T. Caloric restriction prevents radiation-induced myeloid leukemia in C3H/HeMs mice and inversely increases incidence of tumor-free death: implications in changes in number of hemopoietic progenitor cells. Exp Hematol. 2006;34:274–283. doi: 10.1016/j.exphem.2005.11.016. [DOI] [PubMed] [Google Scholar]
- Zhang Y, Csanaky IL, Lehman-McKeeman LD, Klaassen CD. Loss of organic anion transporting polypeptide 1a1 increases deoxycholic acid absorption in mice by increasing intestinal permeability. Toxicol Sci. 2011a;124:251–260. doi: 10.1093/toxsci/kfr236. [DOI] [PMC free article] [PubMed] [Google Scholar]
- Zhang Y, Hong JY, Rockwell CE, Copple BL, Jaeschke H, Klaassen CD. Effect of bile duct ligation on bile acid composition in mouse serum and liver. Liver Int. 2012a;32:58–69. doi: 10.1111/j.1478-3231.2011.02662.x. [DOI] [PMC free article] [PubMed] [Google Scholar]
- Zhang Y, Klaassen CD. Effects of feeding bile acids and a bile acid sequestrant on hepatic bile acid composition in mice. Journal of lipid research. 2010;51:3230–3242. doi: 10.1194/jlr.M007641. [DOI] [PMC free article] [PubMed] [Google Scholar]
- Zhang Y, Limaye PB, Lehman-McKeeman LD, Klaassen CD. Dysfunction of organic anion transporting polypeptide 1a1 alters intestinal bacteria and bile acid metabolism in mice. PLoS One. 2012b;7:e34522. doi: 10.1371/journal.pone.0034522. [DOI] [PMC free article] [PubMed] [Google Scholar]
- Zhang YK, Guo GL, Klaassen CD. Diurnal variations of mouse plasma and hepatic bile acid concentrations as well as expression of biosynthetic enzymes and transporters. PLoS One. 2011b;6:e16683. doi: 10.1371/journal.pone.0016683. [DOI] [PMC free article] [PubMed] [Google Scholar]
Associated Data
This section collects any data citations, data availability statements, or supplementary materials included in this article.